http://www.sciencepublishinggroup.com/j/ajche doi: 10.11648/j.ajche.20180605.11
ISSN: 2330-8605 (Print); ISSN: 2330-8613 (Online)
Analysis of some Physical Parameters under Workers'
Optimal Performance in Wet and Hot Tropical Climates; A
Literature Review
Modeste Kameni Nematchoua
Department of Applied Science, University of Liege, Liege, Belgium
Email address:
To cite this article:
Modeste Kameni Nematchoua. Analysis of some Physical Parameters under Workers' Optimal Performance in Wet and Hot Tropical Climates; A Literature Review. American Journal of Chemical Engineering. Vol. 6, No. 5, 2018, pp. 72-85.
doi: 10.11648/j.ajche.20180605.11
Received: September 10, 2018; Accepted: September 19, 2018; Published: October 13, 2018
Abstract:
In this decade, in the hot tropical zone, it is observed a rapid variation of the external climate which acts directly on the thermal comfort and the satisfaction of the occupants inside the buildings. The aim of this article is to analysis the influence of some indoor parameters on workers’ performance. In addition, this work reports the results of the conducted study to assess the effect of indoor environment quality on workers ‘productivity, in 102 offices distributed in 23 buildings in the coastal and central areas of Cameroon (Douala and yaounde). This research was conducted during the dry and rainy seasons, in naturally ventilated buildings using the adaptive approach, in accordance with ASHRAE 55/2004, ISO 7730 and ISO 10551. Wind speed, air temperature, relative humidity and CO2 levels were measured. While, simultaneously, 600 questionnaires weredistributed. The results revealed that the temperature, and relative humidity have significant effect on the office workers’ productivity. More than 80% of the participants were working under "no stress" condition, when the Universal Thermal Climate Index varied from 22.9 to 26.3°C". The optimum performance occurred when the thermal sensation was between -0.5 and 0.5. Increasing the air temperature to 28°C and above could reduce workers’ performance by a minimum of 1.5% during both seasons.
Keywords:
Workers, Productivity, Commercial Buildings, Physical Parameters, Indoor Environmental Quality, Tropical Climate1. Introduction
Several problems have already been solved in order to improve thermal comfort in new and old buildings. However, the effect of indoor air quality on the health and productivity of the occupants remains a major problem and a main concern of all nations. Potential health and productivity benefits are not yet generally considered in conventional economic calculations pertaining to building design and operation. Only initial costs as well as energy and maintenance costs are typically considered [1]. All indoor parameters do not act in the same way on worker productivity. For example, temperature and relative humidity are two elements with a significant effect on optimal productivity. Ventilation requirements in many existing guidelines and standards may be too low to protect occupants
of offices, schools, and homes from health and comfort problems and may not be optimal for human productivity [2]. The building occupants, whether aware of it or not, are responsible for ensuring the indoor environment and through their behavior they influence their comfort and even health [3]. More than 50% of the world’s population currently works in some form of office [4]. Therefore, it is important to conduct several studies on performance, health, well-being, and productivity of office workers to improve it [5-9]. According to previous studies, 10% of office worker’s performance may be increased by achieving the best indoor environmental quality [10-11]. Nowadays, building facility managers are interested in improving indoor environments and quantifying the effects [12-14]. The internet-based post-occupancy surveys have been used to build up comprehensive databases of occupant perceptions, which
allow for the study of the effect on human comfort and satisfaction of a multitude of IEQ factor combinations [15-18]. Today, in sub-Saharan Africa, several industries lose a lot of money for improving the worker's performance. It is very important to identify the sources of this problem and try to solve it. Some studies on these environmental factors can potentially to be benefit at millions of people around the world.
The main objective of this research is to study the effect of indoor air on the office productivity and suggested some ideas for improving the productivity and performance in the offices.
This research has several original and innovative aspects such as:
(1) Minitious analysis of the parameters that directly affect the productivity of the workers in hot climate with experimentation of several offices resulting from the buildings of several forms (terraced building, semi-detached buildings, and semi-detached buildings) located in Douala and yaounde.
(2) The various buildings studied were located in 10 districts with different micro-climates, specially selected on the basis of a statistical analysis of both regions to define the buildings most representative of this climate zone.
(3) No research has yet been conducted in this climate zone analyzing the effect of temperature, relative humidity, lighting, CO2 etc. on the worker's
performance.
The content of this research is constituted of several parts: Section 2, shows a review on thermal performance of workers. Section 3 provides the research methodology, including an analysis of cities. The last section introduces some important results and comments.
2. Overview
2.1. Thermal Indoor Environment: A Review
The thermal environment has a considerable effect on the performance of the workers [19]. Some research has proved that a comfortable environment is necessary not only for health, but also for the productivity of the building's occupants [20-25]. Previous studies have shown that people spend a great part of their time inside buildings, to work, live or sleep [26-30]. Brager and de Dear [31] showed that thermal adaptation can be attributed to three different processes: behavioral adjustment, physiological acclimatization and psychological habituation or expectation. Kameni et al. [25] showed that thermal indoor environmental conditions varied according to the seasons and climate type. In a study conducted by Mendell and Heath [32], it was found that public concern about adverse effects of indoor air has increased in recent decades. Among the commonly reported complaints, it was important to indicate eye and upper respiratory tract irritation, headache, fatigue, and lethargy. Dounis and Caraiscos [33] found that a multi-agent
control system (MACS), successfully manages the user’s preferences for thermal and luminance comfort, indoor air quality and energy conservation. Thompson et al. [34] conducted a study to compare the impact of indoor and outdoor activities on mental and physical well-being, health related quality of life and long-term adherence to physical activity. Their results showed that feelings of calmness may be decreased following outdoor exercise. Yanga et al. [35] showed that buildings account for about 40% of the global energy consumption and contribute over 30% of the CO2
emissions. After conducting several studies in this area, Mendell [37] suggested that work-related symptoms among office workers were relatively common, and some of these symptoms represented preventable physiologic effects of environmental exposures or conditions. It was showed by Taleghani et al. [38] that one of the more unfortunate aspects of modern global development has been the introduction and widespread acceptance of the use of mechanical means for providing desired comfortable temperature for building users. Koo et al. [39] developed a model to estimate heating and cooling demand of a residential building having different envelope designs. The results showed that the indoor thermal comfort can be dependent on the characteristics of building envelope. Karjalainen [40] suggested that females should primarily be considered as subjects when examining indoor thermal comfort requirements. If females are satisfied it is highly probable that males are also satisfied (figure 1).
2.2. Environment and Indoor Air Quality: A Review
Indoor air pollution is a major global public health threat requiring greatly increased efforts in the areas of research and policy-making [41]. There are numerous situations in offices that may result in possible exposure to contaminants, such as second-hand tobacco smoke, spraying of insecticides, accumulation of pollutants in carpets, poor air quality and others. The quality of worker’s environments can cause or prevent illness, disability and injury [42]. Slezakova et al. [43] showed that people who constantly stay indoors and being chronically exposed to indoor pollution, are often the most susceptible individuals. An increase in prevalence of sick building syndrome (SBS) between 30% and 200% in the buildings with air-conditioning systems when compared with natural ventilation systems was found by Seppanen and Fisk [44], following analysis of many researches. The biological effects of different pollutants may differ by orders of magnitude. Moreover, [45]. Wargocki et al. [46] showed that ventilation is strongly associated with comfort and health, and productivity in a building varied with the ventilation's type. Wargocki [47] suggested that the indoor air quality can be improved by reducing the concentration of pollutions in the air by selecting low-polluting buildings and furnishing materials and electronic office equipment, as well as reducing pollution in ventilation systems, and/or by increasing the outdoor air supply rate. It important to know that people’s comfort is better under some transient and non-uniform conditions than the uniform neutral condition. Zhang et al. [54] found that perceived air quality in the offices can
significantly be improved when air motion was provided, even when the air movement is re-circulated room air. Efforts to assess health risks associated with indoor air pollution are limited by insufficient information about the number of
people exposed in tropical regions. According to Spengler and Sexton [55], an overall strategy should be developed to investigate indoor exposures, health effects, control options, and public policy alternatives.
Figure 1. Illustration of the generate-and-test (GAT) and bi-direction inference (BDI) methods for model-based building systems control [64].
2.3. Environment Andair Control Level in Buildings: A Review
Several researches have explained that people believe daylight is superior to electric light in its effects on people [56-60]. The literature shows a consistent strong preference for daylight and a wide distribution between individuals in relation to the preferred luminance levels in offices. Therefore, we need to design the architecture of a multi-agent control system that will incorporate the knowledge of such expert operators. According to them, the different approaches to control systems for indoor building environments can be roughly classified into the following categories: (i) conventional methods; (ii) computational Intelligence techniques; and (iii) agent-based intelligent control systems. A model-based predictive controller, combined with a Building Energy Management System (BEMS), was presented by Kolokotsa et al [62]. They found that the system’s response to the environmental variables’ fluctuations was fast and stable. Širokýa et al [63] suggested an advanced control technique for minimizing energy consumption using current energy sources and minimal retrofitting. The basic formulation of the model predictive control (MPC) was described with emphasis on the building control application and it was tested in a two months experiment performed on a real building in the Czech Republic. The simulation results allowed for the comparative assessment of the control options and the selection of the most desirable of such options based on the applicable performance criteria [64-67]. Two methods to derive such control options are mentioned below; the generate-and-test method (GAT) for complex control tasks, the formulation of such rules may be non-trivial, and has to undertake on a case-by-case basis; and the bi-directional inference method (BDI). Sharples et al. [68] suggested an architecture consisting of distributed embedded agents, using sensory information to
learn how to perform tasks related to user comfort, energy conservation, safety, and monitoring functions. They showed how these agents, employing a behavior-based approach derived from robotics research, are able to continuously learn and adapt to individuals within a building, while always providing a fast, safe response to any situation. Erickson et al. [69] suggested a model allowing predicting room usage thereby enabled to control the HVAC systems in an adaptive manner. The results indicated a 14% reduction in HVAC energy usage by having an optimal control strategy based on occupancy estimates and usage patterns. Three criteria describing the way indoor air is used and controlled in real-time were defined with the aim of evaluating the control schemes performance and adapting the strategy to the specific use of a building by Paris et al [70].
2.4. Health and Productivity in Office: A Review
Performance is the product of efficiency and effectiveness [71].The relationship between the indoor environment on the one hand and well-being and performance on the other hand, and the systems and concepts that influence this relationship, offers the possibility to design in such a way that productivity improvements and a comfortable working environment can be created [72-75]. Air temperature is the commonly used indicator of thermal environment in indoor air quality and productivity research [76-77]. Both elevated and too-low temperatures have negative effects on performance of office work [78].Optimal performance may not occur under conditions providing optimal thermal comfort, as was found when subjects performed mental work at air temperatures in the range 20-30°C [79]. Several studies have shown that very moderate heat stress can negatively affect mental performance [80-86]. Vimalanath and Babu [87] used neurobehavioral test (NBT) to evaluate office workers’ performance. The results revealed that the independent and
interaction effect of temperature and illumination have significant effect on the office workers’ productivity. Some actions on human performance of elevated temperature causing thermal discomfort were assessed by LiLan et al [88]. The results showed that optimum performance can be achieved slightly below neutral, while thermal discomfort leads to reduced performance. Other factors outside of the working environment can have a positive or negative effect on a person's performance (Figure2). These factors cover areas such as domestic problems, personal relationships, or the excessive consumption of food or drink, which affect a person's performance at work [89-91].
Seppänen et al. [81] showed that performance increases with temperature up to 21-22°C, and decreases with temperature above 23-24°C. The highest productivity is at temperature of around 22°C. For example, at the temperature of 30°C, the performance is only 91.1% of the maximum, i.e. the reduction in performance is 8.9%.The equation for the curve with composite weighting factors was given in [81].
P=0.1647524T-0.0058274T2 + 0.0000623T3-0.4685328 (1)
where P is productivity relative to maximum value and T is room temperature,°C.
Seppanen and Faulkner [92] have conducted several experimental study to investigate the performance loss as a function of the indoor temperature in office buildings (Figure3). It was important to notice on these curves that at 25°C, the performance decrement was stable. Generally, the performance change depends on the thermal indoor environment in offices. Considerable opportunities exist for occupational health professionals to demonstrate the importance of certain services to productivity [93]. Niemelä et al. [94] investigated the effect of air temperature on labor productivity in telecommunication offices in two call centers. Productivity was monitored both before and after the intervention, and it was measured as labor productivity by monitoring the number of telephone calls divided by the active work time.The results showed that productivity might fall by 5–7% at the elevated indoor temperatures. Productivity is possible to improve by increasing outdoor airflow rate, decreasing emissions and improving ventilation efficiency (e.g.with displacement ventilation) [95].
Figure 2. Different factors affecting performance [ 89].
Figure 3. Summary of the studies on the effect of room temperature on decrement of performances and productivity [89]. With the aim to explore methodological refinements in
measuring health-related lost productivity and to assess the business implications, a regression analyses was used to
estimate the associations of health conditions with absenteeism using a range of models. Loeppke et al. [96] showed that Chronic conditions such as depression/anxiety,
obesity, arthritis, and back/neck pain are especially important causes of productivity loss. According to Goetzel et al. [97], to identify key success factors related to employer-based health and productivity management (HPM) programs, increased efforts should be directed at disseminating the experiences of promising practices.
3. Field Study
3.1. Cities Analyzed
Douala and Yaoundé rank among the largest cities in sub-Saharan Africa. Douala is the economic capital of Cameroon, the main business centre and one of the major cities in the country, located on the Atlantic Ocean coast, between 4°03’N and 9°42’E, covering an area of nearly 210 km2. The climate in Douala is tropical wet and hot, characterized by temperatures between 18◦C and 34◦C, accompanied by heavy precipitation, especially during the rainy season from June to October. The air nearly always records 99% relative humidity during the rainy season and about 80% during the dry season, between October and May.
The city of Yaoundé, on the other hand, is the political capital of Cameroon, located centrally, at an altitude between
600m and 800m and approximately 300km from the Atlantic coast. It enjoys a sub-equatorial climate (tropical wet and cold), with four seasons, including a long dry season (November to late March), a short rainy season (April to mid-June), a short dry season (mid-June to mid-August), and a long rainy season (mid-August to mid-November). The city is spread over several hills, and enjoys a relatively fresh climate, much better than that along the coast, with the maximum temperature ranging between 30°C and 35°C and a minimum temperature of 15°C.
3.2. Materials
In this study, the indoor air velocity, relative humidity, CO2, temperature, and surrounding light intensity were
measured using the Thermo-Anemometer Model CA1226, CO2 Monitor model CO200 and a Light Meter IM-1308,
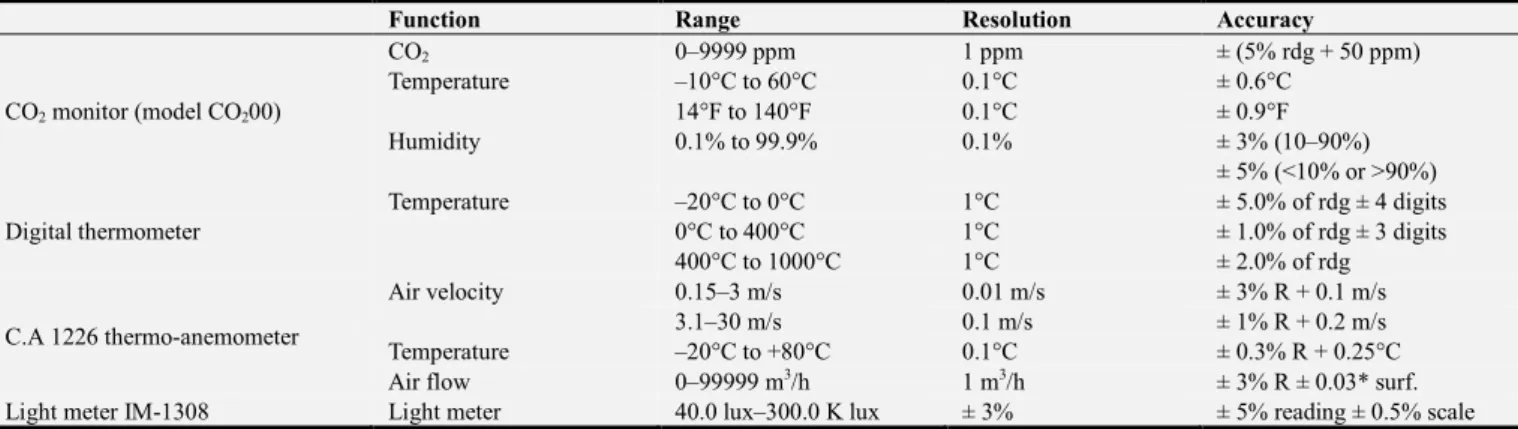
respectively. The outdoor temperature, wind speed, and relative humidity values were simultaneously collected from the National Weather Station System. The main characteristics of the measurement system employed in this work are shown in Table 1. All equipment was calibrated before each experiment to ensure reliability and accuracy in the readings recorded during the field studies.
Table 1. Characteristics of the measurement system.
Function Range Resolution Accuracy
CO2 monitor (model CO200) CO2 0–9999 ppm 1 ppm ± (5% rdg + 50 ppm) Temperature –10°C to 60°C 0.1°C ± 0.6°C 14°F to 140°F 0.1°C ± 0.9°F Humidity 0.1% to 99.9% 0.1% ± 3% (10–90%) ± 5% (<10% or >90%) Digital thermometer Temperature –20°C to 0°C 1°C ± 5.0% of rdg ± 4 digits 0°C to 400°C 1°C ± 1.0% of rdg ± 3 digits 400°C to 1000°C 1°C ± 2.0% of rdg C.A 1226 thermo-anemometer Air velocity 0.15–3 m/s 0.01 m/s ± 3% R + 0.1 m/s 3.1–30 m/s 0.1 m/s ± 1% R + 0.2 m/s Temperature –20°C to +80°C 0.1°C ± 0.3% R + 0.25°C
Air flow 0–99999 m3/h 1 m3/h ± 3% R ± 0.03* surf.
Light meter IM-1308 Light meter 40.0 lux–300.0 K lux ± 3% ± 5% reading ± 0.5% scale
3.3. Methodology
The study was conducted during the rainy and dry seasons in naturally ventilated buildings, adopting the new adaptive approach and using questionnaires to obtain quantitative data on the actual conditions prevailing in these habitats. To achieve this objective, two data collection methods were used, namely, a questionnaire as the subjective measurement,
and a physical measurement of certain parameters that influence the thermal comfort conditions in buildings. In each building, in accordance with prior research work, sampling processes were performed between two and five days per season, in each different room or office. For multi-story buildings, the offices chosen were those that supported a greater number of occupants. Table 2 shows some of the study periods.
Table 2. Periods of study.
Cities Dry season Rainy season
Time Months Years Time Months Year
Douala Four weeks Apr.-May 2012 Three weeks Jul.-Aug. 2012
Yaounde Five weeks Jan.-Feb. 2012 Three weeks May-Sep 2012
3.3.1. Field Measurement of the Environmental Parameters
Measurements were taken every 20 min at a height of 1.2m from the ground level in strict accordance with the prescriptions of the ASHRAE Standard 55 [100] and ISO
7730 Standard [101]. Once the devices were installed, measurements were recorded starting from 8:00 AM, to enable each unit to get adapted to the environment. The data was noted regularly until 7:00 PM. Table 3 lists some results
of the physical measurements obtained in 102 offices located in 23 buildings studied in both cities. The experiments were carried out in the offices where there were several workers in every building. One of the studied offices had the following characteristics: (LxWxH= 9.5x5x4m), in which participants sat at ten workstations, each consisting of a table, a chair, and a personal computer. The number of fluorescent lamps varied from one to six according to office volume. All the air conditioners were stopped during the experimental study.
3.3.2. Subjective Measurements
The questionnaires employed in this work were distributed twice a day (before and after noon). This implied that 600 questionnaires were collected and analyzed during the study. These questionnaires were constructed in accordance with Kameni et al. [26, 104,105,106]. Questionnaires were written
in both French and English, which are the country-official languages. The language preferences of the occupants were considered while distributing questionnaires. These questionnaires were subdivided into three different parts:
Part1: A section with personal data (age, sex, gender, height, weight, and the time period).
Part2: The thermal aspects: judgment about tolerability of thermal environment, air movement, temperature difference between head and ankle, activity performed in the last period, etc.
Part3: Personal microclimate control. Finally, as in the previous research works,the questionnaires enabled the identification of the thermal sensation, thermal preference and acceptance of the thermal control of air movement and humidity in the areas occupied. Some physical-measured data are shown in table3.
Table 3. Physical measured data in five buildings.
Buildings Air temperature (°C) Air Speed (m/s) CO2 concentration (ppm) Relative humidity (%) Luminosity (Lux)
Min Max Min Max Min Max Min Max Min Max
1 20.1 26.0 0.11 0.33 556.0 596.0 55.5 62.5 145.0 167.7
2 20.5 28.5 0.09 0.24 516.0 955.5 69.5 74.5 152.0 205.0
3 18.1 29.5 0.00 0.31 578.0 899.0 69.5 90.7 109.8 350.9
4 22.7 28.9 0.05 0.22 678.0 840.5 61.5 81.5 105.4 367.0
5 20.2 30.5 0.05 0.32 350.0 556.1 57.7 70.1 193.1 230.1
3.3.3. Thermal Comfort Field Survey
The opinions of voters were obtained from analysis of questionnaires and interview responses. The thermal sensation, the humidity and air movement sensation were adopted
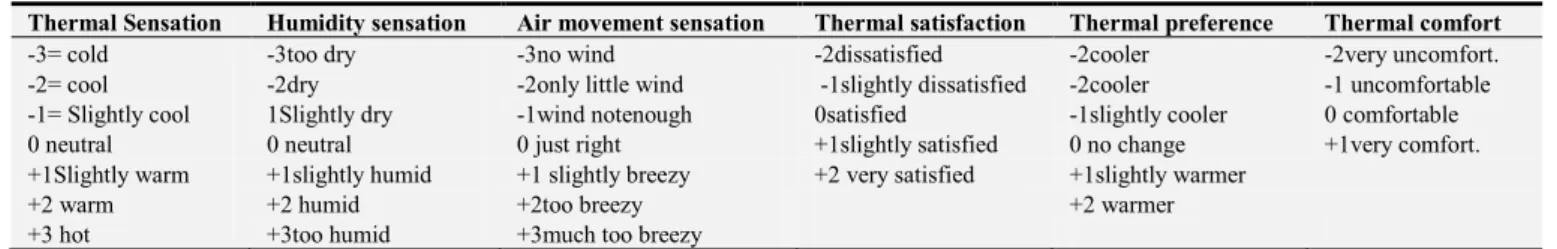
according to the American Society of Heating Refrigerating, and Air-Conditioning Engineers (ASHRAE) scale. Thermal satisfaction, preference and comfort were also estimated. The different used scales were detailed in table 4 as in [100]. Table 4. Adopted thermal scale.
Thermal Sensation Humidity sensation Air movement sensation Thermal satisfaction Thermal preference Thermal comfort
-3= cold -3too dry -3no wind -2dissatisfied -2cooler -2very uncomfort.
-2= cool -2dry -2only little wind -1slightly dissatisfied -2cooler -1 uncomfortable
-1= Slightly cool 1Slightly dry -1wind notenough 0satisfied -1slightly cooler 0 comfortable
0 neutral 0 neutral 0 just right +1slightly satisfied 0 no change +1very comfort.
+1Slightly warm +1slightly humid +1 slightly breezy +2 very satisfied +1slightly warmer
+2 warm +2 humid +2too breezy +2 warmer
+3 hot +3too humid +3much too breezy
3.4. Participants
The participants were the students, aged 18– 35 years, and also the workers who were familiar with computers and impartial to the office in which the experiment was carried out.
Each participant was entitled to a meal after the experimental study to increase their motivation and especially to encourage them to perform the tests seriously. It was noticed that all participants successfully completed experimental sessions. During the visiting hours, the CO2
monitor displayed a high CO2 concentration. Insulation due
to clothing was always the most difficult factor to be estimated in climate type. In particular, the range varies from 0.36 to 1.45 clo, with an average of 0.78 clo for Yaoundé, and between 0.45 and 1.37 clo with an average of 0.67 clo for Douala. All the experimental protocols were approved by the administration staffs.
3.5. Universal Thermal Climate Index (UTCI)
The UTCI was defined as the air temperature (Ta) of the reference condition causing the same model response as actual conditions. The different values of the UTCI are categorized in terms of thermal stress. UTCI was developed in 2009 by virtue of international co-operation between leading experts in the areas of human thermo physiology, physiological modelling, meteorology and climatology. The necessary research for this had been conducted within the framework of a special commission of the International Society of Biometeorology (ISB) and European Cost Action 730. This index was defined according to equation 2 [98].
UTCI = f (Ta; Tmrt; va; vp) = Ta + Offset (Ta; Tmrt; va; vp) (2) The general idea regarding UTCI deliverables was thus to entail goal-setting and attainment as regards [98]:
(1) Thermo-physiological significance across the entire range of heat exchange validity in all climates and seasons, as well as on spatial and temporal scales from the micro through to the macro.
(2) Applicability to whole-body calculations, but also local skin cooling (as in frost bite, for example).
(3) Usefulness for key applications in human biometeorology, for example in the Public Weather Service, Public Health Service, precautionary planning and climate impact research.
(4) Representation as a temperature-scale index.
The UTCI values have been categorized from the point of view of thermal stress that can cause different physiological reactions (Table 5).
Table 5. Different categories of UTCI according to thermal stress [99].
UTCI (°C) Physiological stress level Thermal sensation
> 46 Extreme thermal stress Torrid from +38 to +46 very strong thermal stress Hot from +32 to +38 Strong thermal stress Strongly hot from +26 to +32 Moderate thermal stress warm
--- Light Thermal Stress A little warmer
From +9 to + 26 No Stress Comfortable
from 0 to +9 Light stress due to cold Slightly cool
3.6. Statistical Analysis
All the statistical analyses of performance text were first tested with IBM SPSS 24.0 Statistical software. The significance level was set to be 0.05 (P< 0.05).The repeated-measures ANOVA was used as it has been showed to be robust even for data that are not completely normally distributed.
4. Results and Discussions
4.1. Worker Environment and Analysis of Indoor Air Parameters
In this study, the average age was 20.6 years for the students and 28.0 for the workers.
Table 3 lists some results of the physical measurements obtained in 102 offices distributed in the 23 studied buildings. It was noticed that indoor air temperature varied from 15.1 to 31.9°C, with an average of 25.6°C and standard deviation of (SD=1.34); air speed varied from 0.00 from 0.52m/s, with an average of 0.16m/s and (SD=0.07); CO2 concentration varied
from 318.0 to 1230.0ppm with an average of 794.2ppm (SD=223.78); on the other hand, relative humidity varied from 51.2 to 90.7% with an average around of 69.4% and (SD=2.29); finally, the luminosity concentration varied from 100.4 to 455.0lux, with an average of 189.4 (SD=47.93).These different indoor conditions are similarly in many office work environments in sub-Saharan Africa and Indian Ocean [25-26].
4.2. Worker Environment and Analysis of the Subjective Responses of Questionnaires
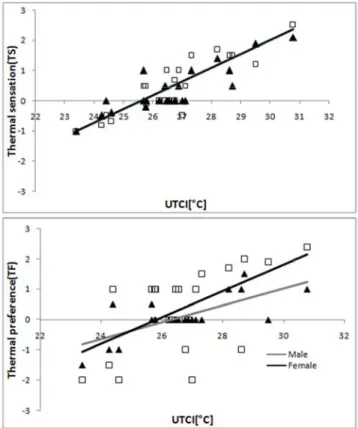
Figures 4 and 5 show Thermal sensation, preference, satisfaction and comfort versus Universal Thermal Climate Index (UTCI). Several linear regression lines
were obtained.
During the work times, at 8:00 - 12:00, for UTCI between 24.5 and 26.8, there were no obvious differences between the males and females in their thermal satisfactions, thermal preferences, and thermal comfort, since most of them thought the thermal environment was slightly satisfied, and wanted it to be slightly warmer to be more comfortable. However, between 14:00 and 18:00, there were no obvious differences between the males and females in their thermal satisfaction and thermal comfort, since most of them thought the thermal environment was comfortable and satisfactory, but their thermal preference levels showed great differences. For the males, a great number of them preferred a "no change" environment. However, the majority of the females wanted "cooler" as the thermal environment. In figure 4, for thermal sensation between -1 to 2.5, UTCI varied from 22.5 to 30.9°C. It is important to notice that for UTCI between 22.9 and 26.3°C, more than 80% of participants were working without stress, with "neutral work environment". However, for UTCI between 26.5°C and 31.5°C, a "moderate heat stress" was observed with a warm environment. In this judgment, Wyon [80] showed that very moderate heat stress can negatively affect mental performance. In general the thermal sensation for women is more influenced by temperature; in fact, thermal comfort temperature ranges are wider for women than for men in a tropical region.
Figure 4. Thermal sensation and thermal preference versus Universal
Figure 5. Thermal satisfaction and thermal comfort versus Universal
Thermal Climate Index for the genders.
4.3. Worker Environment and Analysis of the Thermal Sensation Index
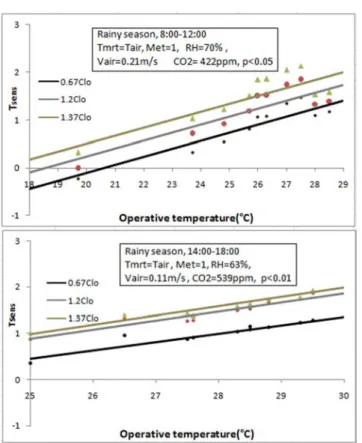
Figure 6. Variation of thermal sensation indices versus operative
temperature in function of thermal insulation during rainy season.
Figure 7. Variation of thermal sensation indices versus operative
temperature in function of thermal insulation during dry season.
Figures 6 and 7 show the variation of thermal sensation indices versus indoor uniform temperature in function of thermal insulation during dry and rainy seasons.
It is seen that, Tsens go up with increasing both temperature (T) and thermal insulation (Clo) (when T is constant, Tsens increases with Clo; when clo is constant, Tsens increases with T).
Thermal neutral temperature (corresponding to Tsens= 0.5 to +0.5) decreases when Clo increases. In the rainy season (figure6), during intense work times (8:00-12:00), when average relative humidity was 70%, average air speed at 0.21m/s, and average CO2 concentration at 422ppm, for indoor
temperatures between 17.8°C and 30.1°C, at 0.67Clo, Tsens varied from -0.55 to 1.48; at 1.2Clo, Tsens varied from -0.14 to 1.85 and at 1.37Clo, it was between 0 to 2.14. While, after midday (14:00-18:00), at the indoor air (RH=63%, Va=0.11m/s, CO2=539ppm), for air temperatures from 24.3 to
31.5°C, at the same thermal insulations (0.67, 1.2 and 1.37Clo), Tsens varied from 0.21 to 1.30, from 0.77 to 1.58, and from 0.89 to 1.65. In dry season (figure 7), during intense work times (8:00-12:00), when average relative humidity was 65%, average air speed at 0.15m/s, and average CO2 concentration at
502ppm, for indoor temperatures between 18.5°C and 31.8°C, at 0.36Clo, Tsens varied from -1.2 to 0.86; at 0.55Clo, Tsens varied from -0.17 to 1.50 and at 0.78Clo, it was between -0.05 to 1.98. Meanwhile, in after midday (14:00-18:00), at the indoor air (RH=58%, Va=0.09m/s, CO2=697ppm), for air
temperature from 23.1 to 31.5°C, at the same thermal insulation (0.36, 0.55 and 0.78Clo), Tsens varied from -0.21 to 1.38, from -0.08 to 1.51, and from 0.05 to 1.64. Some results
found in this study were similar with the conclusion of Buratti et al. [30].All this data show that indoor climate is not stable. It can vary according to workers' activity, outdoor climate and other parameters [106].
4.4. Worker Environment and Analysis of Percentage of Dissatisfied Index
Figure 8. Variation of percentage of dissatisfied versus air temperature in
function of relative humidity during rainy and dry season.
Figure 8 shows the variation of percentage dissatisfied versus air temperature as function of relative humidity during rainy and dry season. It is important to notice that during both seasons, for the temperatures around of 25°C, less than 10% of workers were dissatisfied. Percentage dissatisfied (PD) goes up with both temperature and relative humidity increasing (when T is constant, PD increases with RH; when RH is constant, PD increases with T); at high temperature the values of PD at different RH values are more distant than at low temperature (lines are fan-shaped); it means that high values of RH are more annoying when the thermal sensation is hot (hot-humid environment is less bearable than a cold-humid one). In the rainy season, for average thermal insulation (Icl)=1Clo, Vair=0.25m/s and CO2=453ppm, when
air temperature varied from 17.8 to 22.3°C, PD was the highest at RH=50% and the least high at RH=80%, while when air temperatures varied from 26.1 to 30.5°C, PD was the highest at RH=80% and the weakest at RH=50%. In the dry season, indoor air-conditioning is more disadvantageous; this leads to a higher stress rate. Fanger in many studies showed that, at the acceptable temperatures, it was possible to have more than 80% of satisfied for predicted mean votes between -0.5 and 0.5. This work, although carried out in
another type of climate, the found results confirm the conclusions made by Fanger [102].
4.5. Worker Environment and Analysis of Optimal Performance
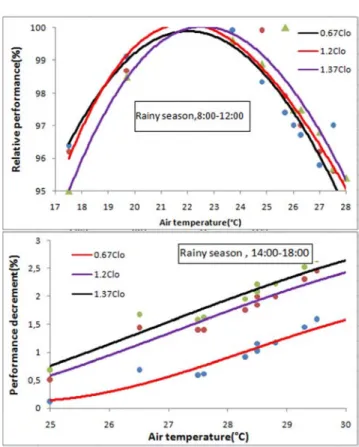
Figure 9. Worker performance versus air temperature during rainy season.
Figures 9 and 10 show the impact of changes in clothing insulation during rainy and dry season on the air temperature for optimum performance (8:00-12:00) and performance decrement (14:00-18:00). In the rainy season (figure8), between (8:00-12:00), for air temperatures from 17.5°C to 29.5°C, at 0.67Clo, worker's predicted mean vote varied from -2.46 to 1.39 and relative performance, between 91.3 and 99.22%; at 1.2clo, worker's predicted mean vote varied from -1.25 to 1.51, when relative performance were between 94.2 and 99.5; finally, at 1.37Clo, worker's predicted mean vote varied from -0.65 to 1.94 and optimal performance between 92.9 and 99.6. After midday, between 14:00 to 18:00, at average air speed from 0.11m/s and CO2 concentration from
539ppm, performance decrement went up with increasing both temperature and relative humidity. From figure 10, it was interesting to notice that in dry season between 24.5 and 31.9°C, performance decrement went up with increasing of thermal insulation. The indoor air temperature for optimum performance can be decreased from about 23.8°C to 22.1°C in the dry season, when people wear walking shorts and short-sleeved shirt corresponding to 0.36 clo instead of trousers and short-sleeved shirt corresponding to 0.78 clo. The increasing air temperature to 28°C and above, even with very light clothing, may reduce performance by a minimum of 1.5% during both seasons.
According to Seppänen et al. [92], a decrease in
performance by 2% per°C has an action on workers' performance when the air temperatures were ranged of 25-32°C. The results indicated that the derived model is statistically significant (P <0.05), at 99% of confidence interval. The maximum performance as a function of thermal sensation was obtained from the following relationship:
RP 0.0924T 0.786T 1.935T 98.851 (3)
where RP is the relative performance when compared to the maximum performance and tsens is the thermal sensation assessed as a function of (Indoor air (ta), air speed (Va), relative humidity (RH), thermal insulation (clo) and activities), this variable was define between -3 and +3, according to ASHRAE55 [100]. This formula is most suited to countries with tropical and equatorial climates dominated by two major seasons (dry and rainy seasons). Several tests have shown some similarities with literature.
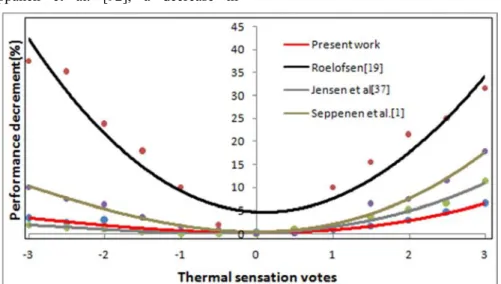
Figure 11 shows the comparison of the relationship between thermal sensation and performance decrement developed in this work with previously developed relationships in other studies. It should be noticed that among all relationships between either air temperature or thermal sensation and performance, the relationship developed in the present work shows a significant effect of thermal environment on worker performance in sub-Saharan Africa.
Figure 11. Comparison of the relationship between thermal sensation and performance decrement developed in this work with previously developed
relationships in other studies.
This figure shows that performance decrement decreases with thermal sensation vote between -3 and -0.5, and that performance decrement increases with thermal sensation vote, above from +0.5 to +1. For thermal sensation votes between -1 to 1, worker's performance decrement was lower than 10%, excluding Roelofsen's work [72], Meanwhile, for tsv fixed at ±3, worker's performance was slightly above 80%. The effect of ventilation rate was only observed at a low level of air temperature and humidity (20°C / 51% RH). The optimum performance decrement occurs when the thermal sensation vote is neutral.
5. Conclusion
This research evaluated the effects of indoor environment on worker's performance in 102 offices distributed in 23 buildings in the coastal and central areas of Cameroon. The data analysis revealed that some parameters such as the temperature, thermal insulation, and relative humidity have a significant effect on the office workers’ productivity. Indeed, the thermal sensation index (Tsens) goes up with both increasing temperature (T) and thermal insulation (Clo). The optimum performance interval was achieved when people
feel slightly cool and slightly warm, therefore it makes sense to set the PMV limits in work places in the range between −1 and 1. At 8:00- 12:00, for UTCI between 24.5 and 26.8, there were no obvious differences between the males and females in their thermal satisfaction, thermal preferences, or thermal comfort, since most of them thought the thermal environment was slightly satisfying and wanted it to be slightly warmer to be more comfortable. The percentage dissatisfied was always above 70% when indoor air temperature reached 28°C at a humidity rate under 53%. The results obtained in this work are significant and strongly dependant on climate type. This work can be a basis for all new researchers who would like to work in this field in sub-Saharan Africa and other world parts.
References
[1] Olli Seppanen, William J. Fisk, David Faulkner. Control of temperature for health and productivity in offices. LBNL-55448. 2004, 1-6.
[2] P. Wargocki, J. Sundell, W. Bischof, G. Brundrett, P. O. Fanger, F. Gyntelberg, S. O. Hanssen, P. Harrison, A. Pickering, O. Sepp) nen, P. Wouters. Ventilation and health in non-industrial indoor environments: report from a European Multidisciplinary Scientific Consensus Meeting (EUROVEN). Indoor Air 2002; 12: 113–128.
[3] Monika Frontczak, Rune Vinther Andersen, PawelWargocki. Questionnaire survey on factors influencing comfort with indoor environmental Quality in Danish housing. Building and Environment 50 (2012) 56-64.
[4] K. Vimalanathan, T. RameshBabu. Impact of Environment Ergonomics on the Productivity of Office Workers. Australian Journal of Basic and Applied Sciences, 7 (4): 366-374, 2013ISSN 1991-8178.
[5] Niemela, R., M. Hannula, S. Rautio, K. Reijula, J. Railio, 2002. The effect of indoor air temperature on labour productivity in call centres – a case study. Energy and Buildings, 34: 759-64.
[6] Federspiel, C., G. Liu, M. Lahiff, 2002. Worker performance and ventilation: of individual data for call center workers. In: Proceedings of indoor air, pp: 796-801.
[7] Charles, R., J. T. Reardon, R. J. Magee, 2005. Indoor air quality and thermal comfort in open-plan offices. Construction Technology updates No. 64, National Research Council of Canada ISSN 1206-1220.
[8] Kosonen, R., F. Tan, 2004. Assessment of productivity loss in air-conditioned building using PMV index. Energy and Building, 36: 987-993.
[9] Pilcher, J. J., N. Eric, B. Caroline, 2002. Effect of hot and cold temperature exposure on Performance: a meta analytic review. Ergonomics. 45 (10): 682-698.
[10] Li Lan, Z. W., L. Lian, Pan, Q. Ye, 2009. Neurobehavioural approach for evaluation of office workers’ productivity: the effects of room temperature. Building and Environment, 44: 1578-1588.
[11] Young S. Lee., Denise A. Guerin., 2010. Indoor
environmental quality differences between offices types in LEED certified buildings in the US. Building and Environment. 45: 1104-1112.
[12] Griffiths T., McIntyre D. 1975. The effect of mental effect on subjective assessments on warmth. Ergonomics. Vol 18, No 1, pp. 29-32.
[13] Federspiel C. 2001. Estimating the Frequency and Cost of Responding to Building Complaints In: Spengler, J. Sammet, J. and McCarthy, J. eds. Indoor Air Quality Handbook, McGraw Hill.
[14] Fisk WJ. 2001. Estimates of potential nationwide productivity and health benefits from better indoor environments: an update. In: Spengler, J. Sammet, J. and McCarthy, J. eds. Indoor Air Quality Handbook, McGraw Hill.
[15] Jørn Toftum. Central automatic control or distributed occupant control for better indoor Environment quality in the future. Building and Environment 45 (2010) 23–28.
[16] Niemelä, R., Hannula, M., Rautio, S., Reijula, K., Railio, J. The effect of indoor air temperature on labour productivity in call centers – a case study. Energy and Buildings. 34 (2002) 759-764.
[17] Holmberg, I. and Wyon, D. P. The dependence of performance in school on classroom temperature, Educational & Psychological Interactions, 31 (1969) 20p. Malmö, Sweden: School of Education.
[18] Heschong Mahone Group. Windows and offices: A study of office workers performance and the indoor environment. (2003) Prepared for California energy commission. Fair Oaks, California.
[19] Carel Paul Gerard ROELOFSEN. Modelling relationships between a comfortable indoor environment, perception and performance change. PhD thesis available at http: //repository. tudelft. nl/.
[20] Modeste Kameni Nematchoua, René Tchinda, Noël Djongyang, Paola Ricciardi. A field study on thermal comfort in naturally−ventilated buildings located in the equatorial climatic region of Cameroon. Renewable and Sustainable Energy Reviews, 39 (2014)381–393.
[21] Modeste Kameni Nematchoua, Paola Ricciardi, Sigrid Reiter, Andrianaharison Yvon. A comparative study on optimum insulation thickness of walls and energy savings in Equatorial and Tropical climate. International Journal Science Buil Environment. (2017), 1-13.
[22] Modeste Kameni Nematchoua, José A. Orosa. Building construction materials effect in tropical wet and cold climates: a case study of office buildings in Cameroon. Journal of Building Engineering, (2016)1-13.
[23] Elvis Wati, Pierre Meukam, Modeste Kameni Nematchoua, Tchinda Rene. Influence of external shading on optimum insulation thickness of building walls in a tropical region. Applied Thermal Engineering, 90 (2015) 754-762.
[24] Modeste Kameni Nematchoua, Chrysostôme R. R. Raminosoa, Ramaroson Mamiharijaona, Tchinda René, José A. Orosa, Watis Elvis, Pierre Meukam. Study of the economical and optimum thermal insulation thickness for buildings in a wet and hot tropical climate: Case of Cameroon. Renewable and Sustainable Energy Reviews 50 (2015) 1192– 1202.
[25] Modeste Kameni Nematchoua, René Tchinda, José A. Orosa, Wagner Augusto Andreasi. Effect of wall construction materials over indoor air quality in humid and hot climate. Journal of Building Engineering 3 (2015) 16–23.
[26] Modeste Kameni Nematchoua, René Tchinda, José A. Orosa. Adaptation and comparative study of thermal comfort in classrooms and buildings naturally ventilated in wet tropical zones. Energy and Buildings 85 (2014) 321–328.
[27] P. Ricciardi, A. Ziletti, C. Buratti. Evaluation of thermal comfort in an historical Italian opera theatre by the calculation of the neutral comfort temperature. Building and Environment 102 (2016) 116-127.
[28] P. Ricciardi, C. Buratti. Thermal comfort in the Fraschini theatre (Pavia, Italy): Correlation between data from questionnaires, measurements, and mathematical model. Energy and Buildings 99 (2015) 243–252.
[29] P. Ricciardi, C. Buratti. Thermal comfort in open plan offices in northern Italy: an adaptive approach, Build. Environ. 56 (2012) 314–320.
[30] C. Buratti, P. Ricciardi, M. Vergoni, HVAC systems testing and check: a simplified model to predict thermal comfort conditions in moderate environments, Appl. Energy 104 (2013) 117–127.
[31] Gail S. Brager, Richard J. De Dear. Thermal adaptation in the built environment: a literature review. 27, 1 (1998), 83-96. [32] M. J. Mendell, G. A. Heath. Do indoor pollutants and thermal
conditions in schools influence student performance? A critical review of the literature. Indoor Air, (2005)27-52. [33] A. I. Dounis, C. Caraiscos. Advanced control systems
engineering for energy and comfort management in a building environment—A review. Renewable and Sustainable Energy Reviews. 13, Issues 6–7, (2009) 1246–1261.
[34] J. Thompson Coon, K. Boddy, K. Stein, R. Whear, J. Barton, and M. H. Depledge. Does Participating in Physical Activity in Outdoor Natural Environments Have a Greater Effect on Physical and Mental Wellbeing than Physical Activity Indoors? A Systematic Review. Environmental Science and Technology, 2011, 45 (5), pp 1761–1772.
[35] Liu Yang, Haiyan Yan, Joseph C. Lam. Thermal comfort and building energy consumption implications – A review. Applied Energy. 115, (2014), 164–173.
[36] J. L. M. Hensen. Literature review on thermal comfort in transient conditions. Building and Environment, 25 (1990)4, 309-316.
[37] M. J. Mendell. Non-Specific Symptoms In Office Workers: A Review And Summary Of The Epidemiologic Literature. Indoor Air, 3 (1993) 227–236.
[38] Mohammad Taleghani, Martin Tenpierik, Stanley Kurvers, Andy van den Dobbelsteen. A review into thermal comfort in buildings. Renewable and Sustainable Energy Reviews, 26, (2013) 201–215.
[39] Choongwan Koo, Sungki Park, Taehoon Hong, Hyo Seon Park. An estimation model for the heating and cooling demand of a residential building with a different envelope design using the finite element method. Volume 115, 15 February 2014, Pages 205–215.
[40] S. Karjalainen. Thermal comfort and gender: a literature review. Indoor Air, 22, (2012) 96–109.
[41] Nigel Bruce, Rogelio Perez-Padilla, Rachel Albalak. Indoor air pollution in developing countries: a major environmental and public health challenge. Special Theme– Environment and Health. (2000)1078-1089.
[42] Children's Health and the Environment WHO Training Package for the Health Sector World Health Organization. July 2008 version, www. who. int/ceh. 1 (30).
[43] Klara Slezakova, Simone Morais, Maria do Carmo Pereira. Indoor Air Pollutants: Relevant Aspects and Health Impacts. Environmental Health – Emerging Issues and Practice, (2004)127-145.
[44] Seppanen, O., Fisk, W. J., Association of ventilation system type with SBS symptoms in office workers. Indoor Air (2000) 12, 98–112.
[45] B. F. Yua, Z. B. Hu, M. Liu, H. L. YangbQ. X. Kong, Y. H. Liu. Review of research on air-conditioning systems and Indoor air quality control for human health. International journal of refrigeration 32 (2009) 3–20.
[46] P. Wargocki, J. Sundell, W. Bischof, G. Brundrett, P. O. Fanger, F. Gyntelberg S. O. Hanssen, P. Harrison A. Pickering, O. Sepp, P. Wouters. Ventilation and health in non-industrial indoor environments: Report from a European Multidisciplinary Scientific Consensus Meeting (EUROVEN). Indoor Air 2002; 12: 113–128.
[47] Pawel Wargocki. Improving indoor air quality improves the performance of office work and school work. 8th International Conference for Enhanced Building Operations-ICEBO’08 Conference Center of the Federal Ministry of Economics and Technology. Berlin, October 20-22, 2008.
[48] DavidColey, Tristan Kershaw. Changes in internal temperatures with in the built environment as a response to a changing climate. Building and Environment 45 (2010) 89– 93.
[49] TM36. Climate change and the indoor environment: impacts and adaptation. London: The Chartered Institution of Building Services Engineers; 2005.
[50] EPSRC. Support by socio-economic theme in climate change, http: //gow. epsrc. ac. uk /ChooseTTS. aspx?Mode=SOCIO&ItemId=2; 2008.
[51] Grogan H, Hopkins PM. Heatstroke: implications for critical care and anaesthesia. British Journal of Anaesthesia 2002; 88: 700–7.
[52] Anderson K, Bows A. Reframing the climate challenge in light of Post-2000 Emissions trend. Philosphical Transactions of the Royal Society A 2008; 366: 3863–82.
[53] Fourth Assessment Report. Intergovernmental panel on climate change Avaiable from: http: //www. ipcc. ch/. [54] Hui Zhang, Edward Arens, Dong EunKim, Elena Buchberger,
Fred Bauman, Charlie Huizenga. Comfort, perceived airquality, and work performance in a low-power task– ambient conditioning system. Building and Environment 45 (2010) 29–39.
[55] JD Spengler, K Sexton. Indoor air pollution: a public health perspectiveScience, (1983) Vol. 221, Issue 4605, pp. 9-17.
[56] Anca D. Galasiu, Jennifer A. Veitch. Occupant preferences and satisfaction with the luminous environment and control systems in daylit offices: a literature review. Energy and Buildings 38 (2006) 728–742.
[57] J. A. Veitch. Lighting quality contributions from biopsychological processes, Journal of the Illuminating Engineering Society 30 (1) (2001)3–16.
[58] J. A. Veitch, Psychological processes influencing lighting quality, Journal of the Illuminating Engineering Society 30 (1) (2001) 124–140.
[59] C. Cuttle, People and wind ows in workplaces, in: Proceedings of the people and Physical Environment Research Conference, Wellington, New Zealand, (1983), pp. 203–212. [60] S. H. A. Begemann, G. vanden Beld, J. A. D. Tenner,
Daylight, artificial light and people inanoffice environment, overview of visual and biological responses, Industrial Ergonomics 20 (1997) 231–239.
[61] A. I. Dounis, C. Caraiscos. Advanced control systems engineering for energy and comfort management in a building environment—Areview. Renewable and Sustainable Energy Reviews 13 (2009) 1246–1261.
[62] D. Kolokots, A. Pouliezos, G. Stavrakakis, C. Lazos. Predictive control techniques for energy and indoor environmental quality management in buildings. Building and Environment 44 (2009) 1850–1863.
[63] Jan Široký, Frauke Oldewurtel, Jiří Cigler, Samuel Prívara. Experimental analysis of model predictive control for an energy efficient building heating system. 88, Issue 9, (2011), 3079–3087.
[64] Ardeshir Mahdavi. Simulation-based control of building systems operation. Building and Environment 36 (2001) 789– 796.
[65] Mahdavi A. “Open” simulation environments: a“preference-based” Approach. Proceedings of CAAD Futures’93, CMU, Pittsburgh, PA, 1993; 195–214.
[66] Mahdavi A, Berberidou L. A generative simulation tool for Architectural lighting. Proceedings of the Fourth International Conference of the International Building Performance Simulation Association (IBPSA). Madison, Wisconsin, 1995; p. 395–402.
[67] Mahdavi A, BerberidouL. GESTALT: a prototypical realization of an “Open” day lighting simulation environment. Journal of the Illuminating Engineering Society 1994; 23 (2): 62–71.
[68] Sue Sharples, Vic Callaghan, Graham Clarke. "A multi-agent architecture for intelligent building sensing and control", Sensor Review, Vol. 19 Issue: 2 (1999), 135-140.
[69] Varick L. Erickson, Yiging Lin, Ankur Kamthe, Rohini Brahme, AmitSurana, Alberto E. Cerpa, Michael D. Sohn, Satish Narayanan. Energy efficient building environment control strategies using real-time occupancy measurements. BuildSys’09 Proceedings of the first ACM workshop on Embedded Sensing Systems for Energy- Efficiency in Buildings. 19-24.
[70] Benjamin Paris, Julien Eynard, Stéphane Grieu∗, Thierry Talbert, Monique Polit. Heating control schemes for energy management in buildings. Energy and Buildings 42 (2010)
1908–1917.
[71] Vink P, Koningsveld EAP, Molenbroek JF. Positive outcomes of participatory ergonomics in terms greater comfort and higher productivity. Applied Ergonomics. 2006; 37: p. 537-546. [72] P. Roelofsen, The design of the work place as a strategy for
productivity enhancement, in: Clima2000/Napoli 2001 World Congress, Napoli, 2001.
[73] Veld J. Analyse van organisatieproblemen - Eentoepassing van denken in systemenen processen. zesdeherzienedruk, vierdeoplage ed. The Netherlands: StenfertKroese/Educatieve Partners; 1996.
[74] Clements-Croome D. Creative and productive workplaces: a review. Intelligent Buildings International. 2015 mei 19; http: //dx. doi. org/10. 1080/17508975. 2015. 1019698: p. 1-20. [75] He L, Chen L, Hoyle C, Yannou B. Choice modeling for
Usage Context-Based Design. Journal of Mechanical Design. 2012; 134 (3): p. (11 pages): DOI: 10. 1115/1. 4005860. [76] Li Lan, Pawel W., ZhiweiLian. Optimal thermal environment
improves performance of office work. REHVA Journal (2012), 12-17.
[77] J. E. Wood, Cost avoidance and productivity in owning and operating buildings, occupational Medicine 4 (4) (1989) 753– 770.
[78] O. Seppänen, Estimated cost of indoor climate in Finnish buildings, in: Proceedings of the Eighth International Conference on indoor Air Quality, Climate, Edinburgh, Scotland, vol. 3, 1999, pp. 13–18.
[79] Pepler RD and Warner RE. Temperature and learning: an experimental study. ASHRAE Transactions, (1968) 42, 211-219.
[80] Wyon DP. Indoor environmental effects on productivity. Proceedings of IAQ ’96: Paths to better building environments, 1996 pp. 5-15. Atlanta, Georgia, USA: ASHRAE.
[81] O. Seppänen, W. Fisk, Q. H. Lei, Room temperature and productivity in office work, in: eScholarship Repository, Lawrence Berkeley National Laboratory, University of California, 2006, http: //repositories. cdlib. org/lbnl/LBNL-60952.
[82] Jørn To ftum. Central automatic control ordistributed occupant control for better indoor. Environment quality in the future. Building and Environment 45 (2010) 23–28.
[83] A. P. Gagge, A. P. Fobelets, L. G. Berglund, A standard predictive index of human response to the thermal environment, ASHRAE Transactions 92 (2B) (1986) 709–731. [84] Niemelä, R., Railio, J., Hannula, M., Rautio, S., Reijula, K.
Assessing the effect of indoor environment on productivity. Proceedings (CD) of Clima 2000 Conference in Napoli, 2001. [85] Niemelä, R., Hannula, M., Rautio, S., Reijula, K., Railio, J. The effect of indoor air temperature on labour productivity in call centers – a case study. Energy and Buildings. 34 (2002) 759-764.
[86] Holmberg, I. and Wyon, D. P. The dependence of performance in school on classroom temperature, Educational & Psychological Interactions, 31 (1969) 20p. Malmö, Sweden: School of Education.
[87] K. Vimalanathan and T. Ramesh Babu. Impact of Environment Ergonomics on the Productivity of Office Workers. Australian Journal of Basic and Applied Sciences, 7 (4): 366-374, 2013 ISSN 1991-8178.
[88] LiLan, Pawel Wargocki, ZhiweiLian. Quantitative measurement of productivity loss due to thermal discomfort. Energy and Buildings 43 (2011) 1057–1062.
[89] Paul Roelofsen. Modelling relationships between a comfortable indoor environment, perception and performance change. Doctorate thesis. 2016, http: //repository. tudelft. nl/ [90] Clements-Croome D. Naturally Ventilated Buildings London:
E & FN Spon; 1997.
[91] Wargocki P, Seppanen O, Andersson J, Boerstra A, Clements-Croome D, Fitzner K, et al. Guidebook No. 6. "Indoor Climate and Productivity in Offices". REHVA; 2006.
[92] Seppänen, O., Fisk, W. J., Faulkner, D. Cost benefit analysis of the night-time ventilative cooling. In: Proceedings of the Healthy Buildings 2003 Conference. Singapore 2003, Vol 3: 394-399.
[93] McCunney, Robert J. MD, MPH. Health and Productivity: A Role for Occupational Health Professionals. Journal of Occupational & Environmental Medicine: (2001)43, 30-35. [94] Raimo Niemel, Mika Hannula, Sari Rautio, Kari Reijula,
Jorma Railio. The effect of air temperature on labour productivity in call centres—a case study. Energy and Buildings 34 (2002)759–764.
[95] R. Kosonen, F. Tan. The effect of perceived indoor air quality on productivity loss. Energy and Buildings 36 (2004) 981– 986.
[96] Loeppke, Ronald, MPH; Taitel, Michael; Haufle, Vince MPH; Parry, Thomas; Kessler, Ronald C. ; Jinnett, Kimberly. Health and Productivity as a Business Strategy: A Multiemployer Study. Journal of Occupational & Environmental Medicine: 4 (2009) 51, pp 411-428.
[97] Goetzel, Ron Z. ; Shechter, David; Ozminkowski, Ronald J. ; Marmet, Paula F. MS, Tabrizi, Maryam J. CHES; Roemer, Enid Chung. Promising Practices in Employer Health and Productivity Management Efforts: Findings From a Benchmarking Study. Journal of Occupational & Environmental Medicine, 49 (2007)pp 111-130.
[98] Krzyszt of Błażejczyk, Gerd Jendritzky, Peter Bröde, Dusan Fiala, George, Havenith, Yoram Epstein, Agnieszka Psikuta, Bernhard Kampmann. An introduction to the universal thermal climate index (UTCI). Geographia Polonica Volume 86, Issue 1, pp. 5-10 http: //dx. doi. org. /10. 7163/GPol. 2013. [99] Boko N. P. M., Vissin E. W, Houssou S. C., Błaŝejczyk K. Application de l’indiceuniversel de charge Hermiquedans le contexteafricain: exemple de Cotonou (republique du benin). XXVIèmecolloque de l’AssociationInternationale de Climatologie. (2010)107-109.
[100] ASHRAE Standard 55, Thermal environment conditions for human occupancy, Atlanta, Ga., USA; 2004.
[101] UNI EN ISO 7730, Ergonomics of the thermal environment– analytical determination and interpretation of thermal comfort using calculation of the PMV and PPD indices and local thermal comfort criteria; 2006.
[102] Fanger PO. Thermal comfort. Copenhagen: Danish Technical press; 1970.
[103] Modeste Kameni Nematchoua, Paola Ricciardi, José A. Orosa, Cinzia Buratti. A detailed study of climate change and some vulnerabilities in Indian Ocean: A case of Madagascar island. Sustainable Cities and Society 41 (2018) 886–898.
[104] Modeste Kameni Nematchoua, Paola Ricciardi, Cinzia Buratti. Adaptive approach of thermal comfort and correlation between experimental data and mathematical model in some schools and traditional Buildings of Madagascar under natural ventilation. Sustainable Cities and Society 41 (2018) 666–678. [105] Modeste Kameni Nematchoua, Paola Ricciardi, Cinzia
Buratti. Statistical analysis of indoor parameters an subjective responses of building Occupants in a hot region of Indian ocean; a case of Madagascar island. Applied Energy 208 (2017) 1562–1575.
[106] Modeste Kameni Nematchoua, Paola Ricciardi, Sigrid Reiter, Somayeh Asadi, Claude MH Demers. Thermal comfort and comparison of some parameters coming from hospitals And shopping centers under natural ventilation: The case of Madagascar Island. Journal of Building Engineering 13 (2017) 196–206.
![Figure 1. Illustration of the generate-and-test (GAT) and bi-direction inference (BDI) methods for model-based building systems control [64]](https://thumb-eu.123doks.com/thumbv2/123doknet/5645871.136621/3.892.191.705.192.465/figure-illustration-generate-direction-inference-methods-building-systems.webp)
![Figure 3. Summary of the studies on the effect of room temperature on decrement of performances and productivity [89]](https://thumb-eu.123doks.com/thumbv2/123doknet/5645871.136621/4.892.185.711.759.1036/figure-summary-studies-effect-temperature-decrement-performances-productivity.webp)