Publisher’s version / Version de l'éditeur:
Vous avez des questions? Nous pouvons vous aider. Pour communiquer directement avec un auteur, consultez la
première page de la revue dans laquelle son article a été publié afin de trouver ses coordonnées. Si vous n’arrivez pas à les repérer, communiquez avec nous à [email protected].
Questions? Contact the NRC Publications Archive team at
[email protected]. If you wish to email the authors directly, please see the first page of the publication for their contact information.
https://publications-cnrc.canada.ca/fra/droits
L’accès à ce site Web et l’utilisation de son contenu sont assujettis aux conditions présentées dans le site LISEZ CES CONDITIONS ATTENTIVEMENT AVANT D’UTILISER CE SITE WEB.
Research Report (National Research Council of Canada. Institute for Research in Construction), 2008-08-01
READ THESE TERMS AND CONDITIONS CAREFULLY BEFORE USING THIS WEBSITE.
https://nrc-publications.canada.ca/eng/copyright
NRC Publications Archive Record / Notice des Archives des publications du CNRC :
https://nrc-publications.canada.ca/eng/view/object/?id=72dcbb48-5894-4595-833d-b83a829392fa https://publications-cnrc.canada.ca/fra/voir/objet/?id=72dcbb48-5894-4595-833d-b83a829392fa
NRC Publications Archive
Archives des publications du CNRC
For the publisher’s version, please access the DOI link below./ Pour consulter la version de l’éditeur, utilisez le lien DOI ci-dessous.
https://doi.org/10.4224/20378218
Access and use of this website and the material on it are subject to the Terms and Conditions set forth at SPMSoft (Speech Privacy Measurement Software) User's Manual
http://irc.nrc-cnrc.gc.ca
S P M S o f t ( S p e e c h P r i v a c y M e a s u r e m e n t
S o f t w a r e ) U s e r ' s M a n u a l
R R - 2 6 6
B r a d l e y , J . S .; E s t a b r o o k s , T .
A u g u s t 2 0 0 8
The material in this document is covered by the provisions of the Copyright Act, by Canadian laws, policies, regulations and international agreements. Such provisions serve to identify the information source and, in specific instances, to prohibit reproduction of materials without written permission. For more information visit http://laws.justice.gc.ca/en/showtdm/cs/C-42
Les renseignements dans ce document sont protégés par la Loi sur le droit d'auteur, par les lois, les politiques et les règlements du Canada et des accords internationaux. Ces dispositions permettent d'identifier la source de l'information et, dans certains cas, d'interdire la copie de documents sans permission écrite. Pour obtenir de plus amples renseignements : http://lois.justice.gc.ca/fr/showtdm/cs/C-42
SPMSoft
(Speech Privacy Measurement Software)
User’s Manual
J.S. Bradley and T. Estabrooks
Table of Contents
page
Acknowledgements ……… 2
SPMsoft Program Overview ……… 3
Hardware Requirements ……….. 4 Getting Started ………. 5 Making a Measurement ……… 6 Main Menu ……….. 7 File………. 7 Settings……….. 7 Load……….. 7 Help………... 7 Main Window ………. 8 New Measurement……… 8 Calibrate Microphone………... 8
Measure Ambient Noise ………. 10
Measure Impulse……….. 10 Calculate Results………. 11 Diagnostics……….. 11 Print Report……….. 11 Save to File……… 12 Levels at 1 m……….……… 13
File Types Used by SPMSoft……… 15
Troubleshooting……… 16
Appendix A: Program Data ..………... 17
Appendix B: Example Test Report Printout .…..………. 20
References ………... 21
Acknowledgements
The first version of SPMSoft was written Darren Ronda while on an Engineering Coop work term at the Institute for Research in Construction. Subsequent modifications were made by Sebastian Schmidt and Tim Estabrooks. The development of this software was funded by Public Works and Government Services Canada (PWGSC) and the National Research Council (NRC).
SPMSoft Program Overview
The SPMSoft computer program makes it possible to conveniently measure speech privacy between locations in open-plan offices. The program outputs test signals and measures the response to them as well as measuring ambient noise levels. From these data the program calculates objective measures of the speech privacy between the source and receiver locations. These include the Articulation Index (AI) [1], the Speech
Intelligibility Index (SII) [2] and the Speech Transmission Index (STI) [3].
The program requires a measurement microphone connected to the computer’s sound card input via a suitable signal amplifier. The output of the computer’s sound card must be connected to a power amplifier that is used to amplify the test signals for reproduction by a loudspeaker.
Ambient noise levels are measured in 1/3-octave bands but are displayed on the screen as octave band values to provide a simpler display that can be compared with octave band rating contours.
The attenuation of sound from the source position to the receiver position is obtained by measuring the impulse response between the two points. Impulse responses are calculated by outputting a sine sweep test signal. The response to this signal is transformed into the impulse response between the source and receiver locations. The output of the sine sweep test signal is first calibrated by measuring it at a distance of 1 m in free field conditions. The attenuation of sound between the loudspeaker and microphone positions in an office is then determined from the difference between the measured test signal in the open-plan office and the previous free-field measurement of the same signal.
The user selects a speech source spectrum and the speech levels at the receiver are calculated by subtracting the measured attenuations from the 1/3-octave band levels of the speech source spectrum. The calculated speech levels at the receiver position and the measured ambient noise levels at this location are used to calculate values of the speech privacy measures. When representative ambient noise levels are not available, the user can select a preset noise spectrum for these calculations. This also permits comparisons of measurements at different locations in terms of only the attenuation differences. The software can estimate the arrival times of test sounds traveling via two key sound paths: the initial ceiling reflection path and the initial path by which sound is diffracted over the separating panel. The user enters dimensions of the office design and the program draws boxes on the plotted impulse response to indicate the location of these events. This helps the user to estimate the relative importance of ceiling absorption and panel height for improving speech privacy conditions in the open-plan office.
Impulse responses are saved for possible further analysis. All measured and calculated values are saved in *.csv files for convenient further use with spreadsheet software.
The ‘Getting Started’ and ‘Making a Measurement’ sections of this document give short descriptions of the steps to run the program. The other sections describe each menu item in more detail. Further information about the development and use of SPMSoft can be found in references [4] and [5]. The design requirements for successful open-plan offices are discussed in references [6] to [8].
Hardware Requirements
SPMSoft is intended to run on a computer running under either the Windows 2000 or the Windows XP operating systems.
The computer must have a good quality sound card and using the internal sound card on many laptop computers may not be satisfactory. We have successfully used an M-Audio external USB sound card. It is important to select a sound card that supports the use of ASIO drivers.
To make measurements there must also be a microphone and loudspeaker connected to the computer’s sound card.
The microphone should be a measurement quality microphone that can be calibrated with a standard microphone calibrator. Measurement microphones are typically 12 mm
diameter condenser microphones. It may be convenient to use the microphone of a small sound level meter because this will effectively include a battery powered microphone preamplifier. The signal level from the microphone to the sound card must be adequate and a microphone preamplifier may be required so that the input to the sound card is appropriate. The acceptability of the microphone signal level can be verified by following the microphone calibration procedure described later in this report. The microphone signal must be connected to the left channel input of the sound card. A standard microphone calibrator is required on all occasions that measurements are made.
It is recommended that a small loudspeaker with directional properties similar to a human talker be used to radiate the test signal. We have used an Electro Voice 405-8H driver in a non-vented box with external dimensions 185 mm by 185 mm by 145 mm deep. This can be powered by a modest power amplifier and should be set up to produce peak levels for the sine sweep signal at frequencies between 160 and 5k Hz of approximately 55 dB at 1 m from the loudspeaker. The sine sweep signal is output to both the left and right channel outputs of the sound card and either output can be used.
An equalizer can be used to ensure that the radiated signal has the intended pink spectrum shape characteristics. However, it must not be a 1/3-octave band geometric equalizer, which will introduce unwanted time delays at lower frequencies and will lead to errors in calibrating the source levels of the test signal.
During most measurements the loudspeaker and microphone should be mounted 1.2 m above the floor and the loudspeaker pointed towards the location of the microphone.
Getting Started
1. Make sure the sound card is properly installed and all cables are connected. The sine sweep signal is output on both left and right audio channels, but the signal from the microphone must be connected to the left input channel of the sound card.
2. Point the loudspeaker towards microphone, 1 m apart and at the same height, in either a free field (anechoic room) or a large room with the microphone and loudspeaker at least 2 m away from all reflecting surfaces.
3. Open SPMSoft and click on the ‘New Measurement’ button, select the proper driver software (ASIO is preferred, not MME), as well as the play and record devices. Next click on the ‘Levels at 1 m’ button.
4. Before the levels at 1 m are measured, the system latency must be calculated. Connect the sound card’s output to its input (include any other equipment with delays such as digital equalizers). After the cables have been connected click on the ‘Calculate
System Latency’ button in the ‘Levels at 1 m’ Screen. Wait for the calculation. Then
reconnect the loudspeaker and microphone and proceed to measuring the reference levels at 1 m.
5. In the ‘Levels at 1 m’ window set the gain setting as high as possible without clipped or distorted sounds, which may damage the loudspeaker.
6. Select the 5 ms time window if the measurement is being carried out in a large open room, or the 20ms time window if in an anechoic chamber.
7. Once the various settings are chosen click ‘Measure’. The program will prompt you to calibrate the microphone. Place the calibrator on the microphone and enter the
calibration time (typically 10 s), level (usually 94 dB), frequency (usually 1000 Hz) and then click ‘ok’. After a successful calibration a smooth horizontal blue line will be drawn between the two red lines. If it is lower than the bottom red line the
microphone signal must be amplified more, and if it is higher than the top red line, less amplification is required. If it is not smooth the calibrator may have been moved during the calibration. The calibration should be repeated. After the microphone is calibrated click ‘yes’ to measure the levels at 1 m.
8. Click ‘Accept’ to save all your settings or ‘Cancel’ to discard all changes. To re-measure just click the ‘Measure’ button again.
This reference level must be measured when a sine sweep signal is used for the first time, when some of the associated hardware is changed or may need to be recalibrated. The system latency only has to be re-measured when there is a change in digital signal processing hardware (sound card, equalizer, etc.) or in the sound card driver software.
Making A Measurement
Attention: First complete steps in ‘Getting Started’ section.
1. After connecting all the necessary cables and turning everything on, one would usually place the loudspeaker in the centre of one workstation and the microphone in the centre of an adjacent one. Make sure the loudspeaker is pointing towards the microphone and that they are both 1.2 m above the floor.
2. Start SPMSoft and click on the ‘New Measurement’ button. Enter the appropriate room, loudspeaker, and receiver descriptions. Next select the appropriate number of repeats, the output signal gain, and the background noise measurement duration. Click ‘ok’.
3. Click on ‘Calibrate microphone’ and follow step number 7 in the ‘Getting Started’ section. (Calibration only has to be done once per measurement session or if there are any equipment changes).
4. Once the microphone has been calibrated the background noise and an impulse response can be measured. Either can be measured first.
a) Measuring the background noise: Click on the ‘Measure Ambient Noise’ button and wait until the noise spectrum is displayed on the screen.
b) Making an impulse response measurement: Click on the ‘Measure Impulse’ button and wait for all repeats of the sine sweep to be played and the impulse response to be displayed on the screen.
5. Click the ‘Calculate Results’ button to get the values of speech privacy measures for this measurement. This measurement can be saved to a *.csv file by clicking ‘Save To
File’ or printed out by clicking ‘Print Report’. You cannot save results before first
calculating the results is performed.
Main Menu
File:
• Save IR envelope: This saves the time and sound levels of the impulse response envelope plot in a *.csv file so that it can be re-plotted in reports using plotting
software. The diagnostic information must be completed before saving so that the correct screen diffracted sound and ceiling reflection arrival times are also output. • Exit: Exits program
Settings:
• Reference Contours - The reference contours on the octave band noise spectrum plot can be: NC, RC or NCB contours. These are not used for any calculation but are displayed simply to help the user interpret the measured noise levels.
• Voice Spectrum - The user must select one of 3 speech source level spectra (the voice level 1 m from the talker in a free field). The speech spectra available are the Intermediate Office Speech Level (IOSL) [7,8], the Normal Speech level from the ANSI S3.5 (1997) standard for SII [2], or they can enter a custom voice spectrum in 1/3-octave bands. Refer to Appendix A for voice spectra. The IOSL speech source spectrum is recommended as the most representative of voice levels found in open-plan offices.
• Noise Spectrum - The user can select to measure the ambient noise level, or to use one of the preset noise spectra. These are an Optimum Masking Noise Spectrum (equal to 45 dBA from COPE project), a Maximum Masking Noise Spectrum (equal to 48 dBA from COPE project), or a custom user defined masking spectrum. Appendix A includes the details of these noise spectra.
• Sound Power – Opens the ‘Levels at 1 m’ window. The measured reference test signal levels at 1 m are stored as sound power levels. Here the user can select the sound power level file to use, or measure new reference test signal levels at one meter.
Load:
• Previous Measurement - Loads a complete previous measurement. • Background Noise - Loads a saved background noise measurement. • Impulse Response - Loads a saved impulse response measurement.
Help
• Help: Takes you to the program’s user manual.
• About: Displays the program’s version number and copyright date.
Main Window
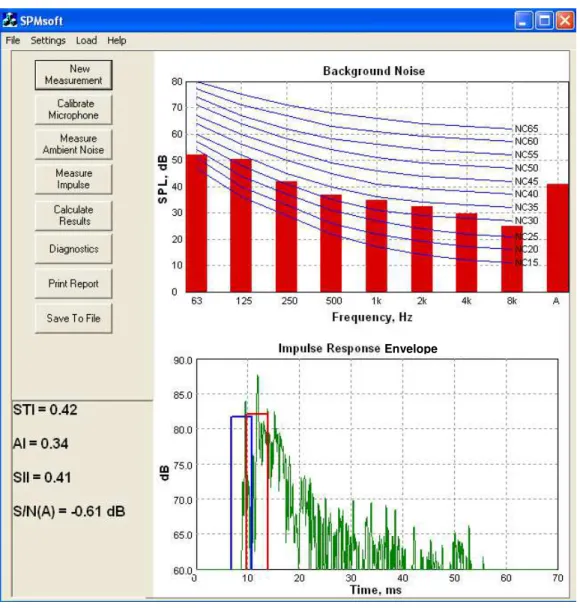
Envelope
Figure 1. SPMSoft Main Window
After completing a measurement, the Main Window displays the measured octave band noise levels as a bar graph in the upper half and the envelope of the measured impulse response in the lower half. Measurements are carried out by pressing the buttons at the left of the upper part of the screen systematically in order from top to bottom. The program ‘grays out’ some buttons so that the user is forced to use them in the correct order. At the lower left the calculated values of the speech privacy measures AI, SII and STI are displayed as well as the A-weighted signal-to-noise ratio (S/N(A)).
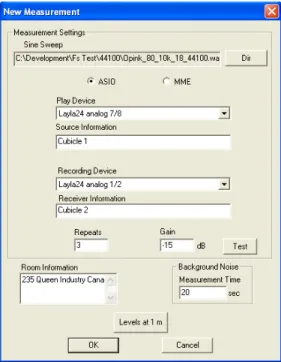
New Measurement:
Clicking this button will take you to the new measurementwindow. This is where you select the play and record devices, the sound card driver software, the number of repeats and output signal gain setting, as well as entering room, source, and receiver information. The program ‘remembers’ these values for subsequent measurement sessions.
Figure 2. New Measurement window
The ASIO and MME buttons indicate which type of driver software is to be used to control the soundcard. ASIO drivers are preferred if the sound card permits them. Sound cards that do not support ASIO drivers may not be of adequate quality.
Dir: Allows the user to change the sine sweep file being used.
Play Device and Recording Device: These boxes list the available devices (sound card channels) for the soundcard(s) installed on the computer and for the type of drivers that are selected.
Source Information and Receiver Information: These boxes are text boxes where the user can type descriptive information about the source and receiver details.
Repeats: Specifies the number of times the output of the sine sweep signal is repeated for the impulse response measurement. The measured impulse response will be obtained by synchronously averaging the measured responses to this number of repeats of the sine sweep signal. A larger number of repeats will provide better noise rejection in the impulse measurement. SPMSoft allows a maximum of 100 repeats.
Gain: Determines the level of the output sine sweep signal. The maximum is 0 dB. You can use a reduced output level and more repeats (averages) if the test signal disturbs occupants.
Test: Pressing this button plays one repetition of the sine sweep signal but does not record a response.
Room Information: The user can enter a description of the room being tested in this text box.
Background Noise Measurement Time: The ambient noise level measurement integrates over the number of seconds specified by the user in this box. For reasonably constant noises without strong low frequency components a value of 20 s is usually adequate.
Levels at 1 m: This brings up the ‘Levels at 1 m’ window where the reference sound levels can be measured. Refer to the ‘Getting Started’ section of this manual for directions on measuring the reference sound level.
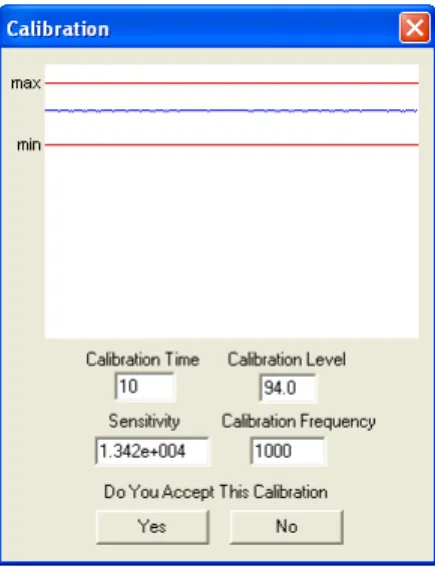
Calibrate Microphone:
Clicking this button will take you to the microphonecalibration window. You must enter the calibration time (typically 10 s), as well as the calibrator level (usually 94 dB) and frequency (usually 1000 Hz). Next press ‘Start’ to perform the calibration. The calibration level and frequency are properties of the calibrator that you are using.
Figure 3. SPMSoft Calibration window.
For an acceptable calibration the blue line must be a smooth horizontal line lying between the two red lines as shown in Figure 3. If it is lower than the bottom red line, the
microphone signal should be amplified more, and if the blue line is higher than the top red line, lower amplification of the microphone signal is required. If it is not smooth the calibrator may have been moved during the calibration. If this occurs, the calibration should be repeated.
Measure Ambient Noise:
Clicking this button will start the background noisemeasurement and the program will integrate the noise signal over the time specified in the ‘New Measurement’ window (typically 20 s). Once it is finished it will display the octave band sound pressure levels and the overall A-weighted noise level on the screen.
Measure Impulse:
This button will start the impulse response measurement. It will play the sine sweep signal at the gain level selected and repeated the number of times that was set in the ‘New Measurement’ window. The first 70ms of the envelope of theimpulse response will be plotted in the lower part of the main window. The envelope of the impulse response display is scaled to avoid negative decibel values. This includes adjusting for the selected signal level (Gain) and then adding 25 dB to the values. This is intended to remove any effect of Gain setting changes and repeated measurements of the same conditions at different Gain settings should produce similar impulse response envelope plots.
Calculate Results:
This button will appear once you have completed both abackground noise measurement and an impulse response measurement. Selecting it will calculate the attenuation and determine AI, SII, STI, and S/N(A) values, which will be displayed at the lower left corner of the main window. These results and the attenuations in each 1/3-octave band can be saved in the *.csv file.
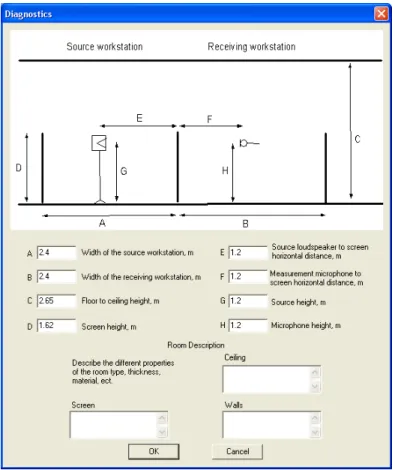
Diagnostics:
Clicking this button opens the diagnostics window where the user can type in the dimensions of the workstation. This data is then used to calculate the arrival times of the initial reflection off the ceiling and the initial sound diffracting over the separating panel between the adjacent workstations. These are then identified on the impulse response envelope plot by red and blue boxes respectively.Figure 4. SPMSoft Diagnostic window
Print Report:
Clicking this will print a page that contains the room, source and receiver locations, the voice spectrum used, the AI, SII, STI and S/N(A) values. A table with the octave band noise, voice, and attenuation spectra is included along with the background noise graph from SPMSoft. The diagnostic information is also printed out and so are the loudspeaker, amplifier and equalizer descriptions that were entered in the levels at 1 m window. (See example report in Appendix B).Save To File:
Clicking this button allows you to save your data to a *.csv file. Thefollowing table shows the information that is saved. Content Description
STI Average
Speech Transmission Index calculated as the average of the results using the frequency weightings for male and female talkers.
STI Female
Speech Transmission Index calculated using frequency weightings for female talkers.
STI Male
Speech Transmission Index calculated using frequency weightings for male talkers.
AI Articulation Index (ANSI S3.5 (1969))
SII Speech Intelligibility Index (ANSI S3.5 (1997)) S/N(A) A-weighted speech level - A-weighted noise level.
U50 Useful-to-Detrimental sound ratio (Experimental, not validated) Source Width Width of the source workstation (m)
Receive Width Width of the receiving workstation (m) Ceiling Height Height of the office ceiling (m)
Screen Height Height of the separating panel (m)
Source Distance Distance of source (m) from separating panel
Microphone Distance Distance of the microphone (m) from separating panel Loudspeaker Height Height of the loudspeaker (m)
Microphone Height Height of the microphone (m) Ceiling Text related to office ceiling Screen Text related to workstation panels Walls Text related to office walls
Noise levels 1/3 octave band noise levels used in the measurement from 50 Hz to 10,000 Hz plus the overall A-weighted noise level.
Attenuations levels Measured attenuations in 1/3-octave bands from 100 to 10,000 Hz plus the overall A-weighted attenuation.
Voice spectrum Speech source levels used in the measurement from 100 to 10,000 Hz plus the overall A-weighted level.
Sound power level 1/3-octave band sound power levels of the test source from 100 to 10,000 Hz plus the overall A-weighted level. These are obtained from the measured on-axis levels of the test source at a distance of 1 m in a free field.
Sensitivity Microphone sensitivity in units (of digitized signal) per pascal SNRsii22 Uniform weighted signal to noise ratio (Experimental, not validated) SNRuni32 SII weighted signal to noise ratio (Experimental, not validated)
Table 1. Contents of the *.csv file
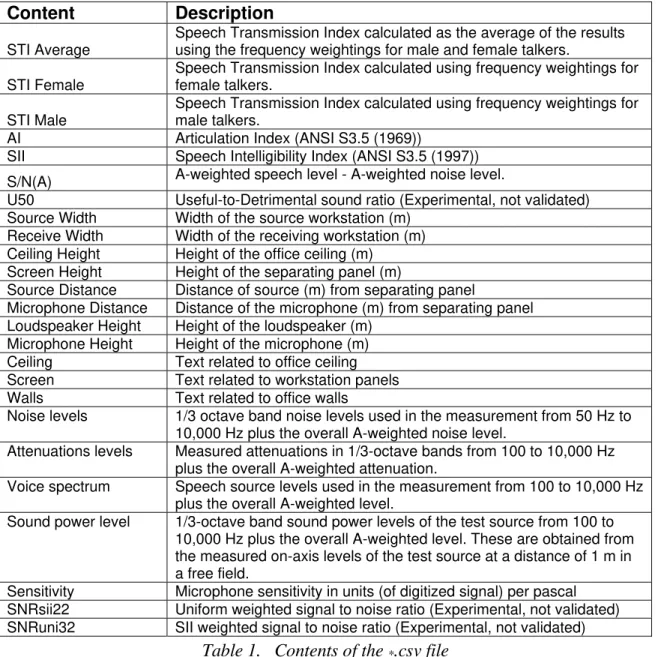
Levels at 1 m window
Figure 5. Levels at 1 m window
This window is used to measure the reference levels of the sine sweep test signal at 1 m in a free field. For detailed steps on how to perform this measurement please refer to the ‘Getting Started’ section of this manual.
On the upper right hand side of the window the current 1/3-octave reference levels are displayed. These have been corrected to an output Gain setting of 0 dB. The left hand side of this window contains information from the ‘New Measurement’ window; please refer to the ‘New Measurement’ section for a description of these properties. The rest of the features are described below.
Load SWL File: Clicking this button will allow the user to load a different sound power level file. It will then be converted to the reference sound pressure levels at a distance of 1 m and for a 0dB Gain setting when displayed on the screen. For example, if
measurements are to be made with two different loudspeakers the appropriate reference sound levels would be required for each. The sine sweep file that was used to create the SWL file also gets loaded so the user cannot accidentally combine the reference level of one sine sweep with a different sine sweep signal.
Loudspeaker, EQ, Amplifier and Soundcard text boxes: These are text boxes where the user can describe the hardware that was used in the measurement.
Load Sine Sweep: Clicking this allows you to load a sine sweep file.
Calculate System Latency: This starts a system latency calculation. For the detailed steps of how to perform this calculation, refer to step 4 in the ‘Getting Started’ section.
Window Size and Measure Buttons: The time window size for measurement of the reference sound level can be set to either 20 ms (for anechoic room measurements) or 5 ms (for measurements in a large room with the source and receiver at least 2 m from all reflecting surfaces). The ‘Measure’ button starts the reference level measurement with the settings selected. Refer to the ‘Getting Started’ section to learn how to perform this measurement.
File Types Used by SPMsoft
The sine sweep file is a *.wav format file.When you open a sine sweep file such as C.wav in SPMsoft, it creates a new file named, C_ext.wav.
This is exactly the same as C.wav. After the number of repeats is specified, the final output sine sweep file is created with multiple copies of the output sine sweep in a file called, C_rep.wav.
Name.csv –all calculated results are in this file for easy input into Excel. Multiple measurements can be appended to the same file or the user can select to create a new
*.csv file name.
Name_nn.f –is the name format for the binary data output files and nn is a two-digit number. They contain the measured impulse response and the noise measurement data and other information that is used when reloading previous measurements.
The SPMsoft program can also create files with the reference output sound power of the source.
Name.TLW –is the reference sound power level data file for use with the SPMsoft program.
Name.LW –is the reference source sound power level data in octave bands that could be used by the RAMWIN software. It is not needed for SPMsoft.
Troubleshooting
Problem Solution
No sound is output Check that all cables are plugged in and that all components are powered on and functioning.
If you are not using a USB soundcard, windows may not have detected your sound card. Restart computer and try again with the sound card turned on before the computer is restarted.
Click ‘Test’ on ‘New Measurement Window’ to verify that a test sound is output.
Improper impulse response start
The displayed impulse response should start after a time interval determined by the speed of sound (0.34 m per ms) and the separation of loudspeaker and microphone. If this time interval is not correct, repeat the ‘Calculate System
Latency’ procedure on the ‘Levels at 1 m Window’.
Noisy impulse response plot
Increase the output signal level (but without distorted output) and/or increase the number of averages (repeats) of the sine sweep test signal.
Calibration level varies
If the blue line indicating the calibration level on the ‘Calibration Window’ is not a smooth horizontal line there may be a faulty connection between the microphone and the sound card.
Sound card not detected
If the desired sound card channel is not found for the Play or Recording devices on the “New Measurement
Window”, try shutting down the program and re-booting
the computer. It is usually necessary to power on external sound cards before the computer is started.
No calibration signal
If the horizontal blue line is at the bottom of the
Calibration Window, no calibration signal was detected. Check all connections between the microphone and the sound card.
Diagnostic
information is lost
If you modify diagnostic information on the ‘Diagnostics
Window’ but it is not retained, you may have forgotten to
click ‘Save to File’ on the ‘Main Window’. You must do this after any changes to the contents of the ‘Diagnostics
Window’.
Appendix A: Program Data
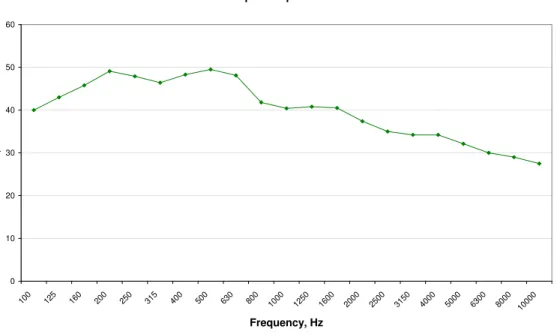
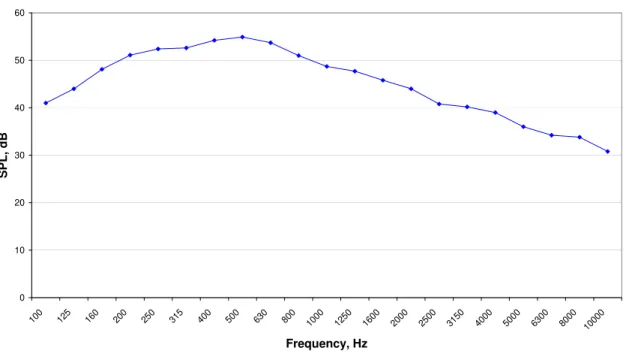
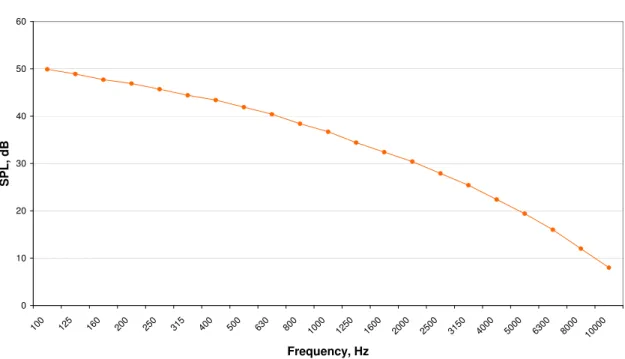
Frequency, Hz IOSL speech ANSI speech Optimum masking Maximum masking 100 40.0 41.0 46.9 49.9 125 43.0 44.0 45.9 48.9 160 45.8 48.1 44.7 47.7 200 49.1 51.1 43.9 46.9 250 47.9 52.4 42.7 45.7 315 46.4 52.6 41.4 44.4 400 48.3 54.2 40.4 43.4 500 49.5 54.9 38.9 41.9 630 48.1 53.7 37.4 40.4 800 41.8 51.0 35.4 38.4 1000 40.4 48.7 33.7 36.7 1250 40.8 47.7 31.4 34.4 1600 40.5 45.8 29.4 32.4 2000 37.4 44.0 27.4 30.4 2500 35.0 40.8 24.9 27.9 3150 34.2 40.2 22.4 25.4 4000 34.2 39.0 19.4 22.4 5000 32.1 36.0 16.4 19.4 6300 30.0 34.2 13.0 16.0 8000 29.0 33.8 9.0 12.0 10000 27.5 30.8 5.0 8.0Table 2. Speech and Noise Spectra
Speech Spectra:
IOSL Speech Spectrum
0 10 20 30 40 50 60 100 125 160 200 250 315 400 500 630 800 1000 1250 1600 2000 2500 3150 4000 5000 6300 8000 10000 Frequency, Hz SPL, dB
Figure 6. IOSL speech spectrum
ANSI S3.5 (1997) Speech Spectrum 0 10 20 30 40 50 60 100 125 160 200 250 315 400 500 630 800 1000 1250 1600 2000 2500 3150 4000 5000 6300 8000 10000 Frequency, Hz SPL, dB
Figure 7. ANSI S3.5 Speech Spectrum
Background Noise Spectra:
Optimum Masking Noise Spectrum 45dBA
0 5 10 15 20 25 30 35 40 45 50 100 125 160 200 250 315 400 500 630 800 1000 1250 1600 2000 2500 3150 4000 5000 6300 8000 10000 Frequency, Hz SPL, dB
Figure 8. Optimum masking noise spectrum
Maximum Masking Noise 48dBA 0 10 20 30 40 50 60 100 125 160 200 250 315 400 500 630 800 1000 1250 1600 2000 2500 3150 4000 5000 6300 8000 10000 Frequency, Hz SPL, dB
Figure 9. Maximum masking noise spectrum
Appendix B: Example Test Report Printout
SPMSoft User’s Manual - 21
References
[1] ANSI S3.5-1969, “American National Standard Methods for the Calculation of the Articulation Index”, Standards Secretariat, Acoustical Society of America, New York, USA.
[2] ANSI S3.5-1997, “Methods for Calculation of the Speech Intelligibility Index”, American National Standard, Standards Secretariat, Acoustical Society of America, New York, USA.
[3] IEC 60268-16, Ed. 3, 2003, “Sound system equipment – Part 16, Objective rating of speech intelligibility by speech transmission index”, International Electrotechnical Commission, Geneva.
[4] Bradley, J.S., “Development and Evaluation of Speech Privacy Measurement Software: SPMSoft”, IRC Research Report, RR-262, August 2008.
[5] Bradley, J.S., “Open-Plan Office Speech Privacy
Case Studies”, IRC Research Report, RR-263, August 2008.
[6] Bradley, J.S., “Acoustical Design for Open-Plan Offices”, Construction Technology Update, (63), pp 6, 2004 . http://irc.nrc-cnrc.gc.ca/pubs/ctus/63_e.html ,
also in French, «Acoustique des bureaux à aire ouverte».
http://irc.nrc-cnrc.gc.ca/pubs/ctus/63_f.html
[7] Bradley. J.S., “The Acoustical Design of Conventional Open Plan Offices”, Canadian Acoustics, 27(3) 23-30 (2003).
[8] Bradley, J.S., “A Renewed Look at Open Office Acoustical Design”, Paper N1034, Proceedings Inter Noise 2003, Seogwipo, Korea, August 25-28, 2003.