Analysis of building's response to diurnal variation in ambient temperature
Texte intégral
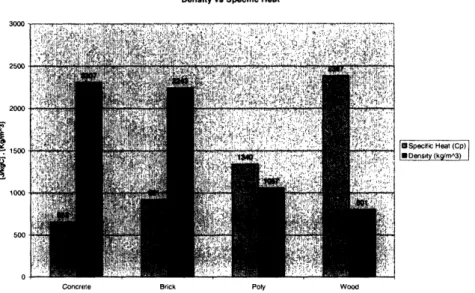
Figure


Documents relatifs
Les larges corridors communs des établissements commerciaux sont parfois utilisés de façon temporaire pour des activités communautaires, commerciales ou pour l’étalage de
Important findings include evidence that users have tried to educate themselves regarding their online security and privacy, but with limited success; different
In the blue region, the fastest mean decision time for a fixed accuracy assuming equilibrium binding, comes from a two binding site architecture with a non-zero first unbinding
Autrement dit, toutes les théories de la monnaie que nous évoquons formulent un postulat à un stade plus ou moins avancé de leur cheminement logique : postulat du choix de la
Validation sur des cas simples Applications VIVABRAIN.. La simulation IRM D´ eveloppement d’un outil adapt´ e aux flux R´ esultats de simulation.. Bases physiques
Dans ce sens, nous proposons dans cet article une démarche d’analyse et d’interprétation de la trace des interactions de l’apprenant dans un dispositif de FOAD pour
In order to investigate the diurnal variation of tropospheric temperature, the spectral data is collected on every alternate hour during 24–25 August 1998, thus providing twelve sets
Le monde est dirigé par des hommes puissants Qui agissent en secret dans un cercle influant Très souvent x pont mais aussi franc maçon Ils font partie du pacte qui régit les nations
