Groundwater flow modelling under past ice-sheets
Insight into paleo-recharge in the northern Baltic Artesian Basin
Thèse
Arnaud Sterckx
Doctorat interuniversitaire en Sciences de la Terre
Philosophiae doctor (Ph. D.)
Québec, Canada
Groundwater flow modelling under past ice-sheets
Insight into paleo-recharge in the northern Baltic Artesian Basin
Thèse
Arnaud Sterckx
Sous la direction de:
Jean-Michel Lemieux, directeur de recherche
Rein Vaikmäe, co-directeur de recherche
iii
RÉSUMÉ
Des données de terrain et des études de modélisation ont montré que la recharge d'eau de fonte sous les calottes glaciaires peut avoir un impact important et durable sur l'écoulement des eaux souterraines. En Estonie, au nord du Bassin Artésien Balte (BAB), ce mécanisme de recharge est invoqué pour expliquer la présence d’importants volumes d'eaux souterraines marquées par un signal isotopique et géochimique glaciaire caractéristique, étant donné que la région a connu plusieurs glaciations durant le Pléistocène et a été entièrement recouverte par la calotte Fennoscandienne au cours du Dernier Maximum Glaciaire (DMG), il y a 20000 ans environ. Cette étude vise à tester cette hypothèse à l’aide de simulations numériques.
En premier lieu, une étude conceptuelle a été effectuée pour déterminer quels processus sous-glaciaires doivent être représentés dans un modèle numérique qui reproduise adéquatement les écoulements souterrains et le transport de solutés. Les processus suivants ont été étudiés: la recharge sous-glaciaire d'eau de fonte, la déformation poroélastique du milieu poreux sous le poids de la glace, l’isostasie, l’évolution du drainage en surface, le permafrost et les écoulements densitaires impliquant des eaux douces de fonte et des saumures profondes. Ces processus ont été simulés dans un modèle représentant un bassin sédimentaire conceptuel, au cours d'un épisode glaciaire suivi d'une période postglaciaire. Le transport de trois traceurs d’eau glaciaire a été simulé: δ18O, solides dissouts et âge de l’eau. Les résultats montrent que la simulation de
la recharge sous-glaciaire avec une condition-limite de type 1 (Dirichlet) n'est pertinente que pour des flux de faible amplitude, ce qui pourrait être le cas sous des calottes glaciaires dont la base n’est que partiellement en fusion. La compression de la matrice rocheuse diminue les surpressions, qui apparaissent uniquement dans les couches à faible diffusivité hydraulique et épaisses. Si la recharge sous-glaciaire est faible, la compression de la matrice rocheuse peut entraîner des sous-pressions après le retrait de la calotte glaciaire. L’isostasie réduit considérablement l'infiltration d'eau de fonte et les écoulements d'eau souterraine. Sous la couche de pergélisol, l'écoulement des eaux souterraines est réduit en-dessous de la calotte glaciaire mais augmente en région périglaciaire. Tenir compte des variations de densité en lien avec la salinité diminue l'infiltration d'eau de fonte en profondeur. Cette étude montre que chaque processus
sous-iv
glaciaire est potentiellement important et devrait être pris en compte dans des modèles d’écoulement des eaux souterraines et de transport de solutés en milieu sous-glaciaire. Cependant, il est raisonnable de ne représenter que la recharge sous-glaciaire si les informations manquent pour décrire correctement les autres processus. Par conséquent, ce seul processus a été simulé pour reproduire les écoulements d'eau souterraine sous la calotte Fennoscandienne dans le BAB. Les simulations ont été réalisées dans deux modèles 2D verticaux, afin de vérifier si la recharge sous-glaciaire d’eau de fonte peut expliquer la distribution particulière de δ18O (un traceur d’eau de fonte) dans les eaux
souterraines de la région. L’un recoupe l’Estonie, l’autre la Lettonie et les îles estoniennes dans le Golfe de Riga. L'écoulement des eaux souterraines est simulé durant 28000 ans, depuis le DGM jusqu’à aujourd’hui, de même que le transport de δ18O pour tracer l'eau de
fonte et confronter les résultats des simulations avec les données de terrain. L'espace d’incertitude de certains paramètres a été exploré, comme l’intensité et la durée de la recharge sous-glaciaire, ainsi que la composition isotopique initiale de l'eau de fonte. Les simulations fournissent un ajustement satisfaisant entre les valeurs observées et calculées de δ18O, confirmant l’hypothèse que le BAB a subi une phase de recharge sous-glaciaire
durant le DMG. Elles montrent que la recharge sous-glaciaire a créé une inversion de l'écoulement des eaux souterraines dans le bassin. L’eau de fonte a infiltré tous les aquifères, en particulier les aquifères non confinés. Après le retrait de la calotte Fennoscandienne, l'eau de fonte a été entièrement remplacée par de l'eau météorique moderne, excepté dans les aquifères confinés où de l’eau de fonte a été préservée à proximité des zones de décharge. Par ailleurs, d’importants volumes d'eau de fonte sont probablement préservés sous la mer Baltique. Les simulations indiquent enfin que des épisodes de recharge sous-glaciaire antérieurs au DGM doivent être considérés afin d'expliquer les valeurs de δ18O dans la partie plus profonde du bassin.
v
ABSTRACT
Field evidence and modelling studies have shown that subglacial recharge of meltwater under wet-based ice-sheets can have a significant and long-lasting impact on groundwater flow. In the northern Baltic Artesian Basin (BAB), in Estonia, this mechanism of recharge is thought to be responsible of the presence of large volumes of groundwater with a characteristic glacial isotopic and geochemical signal, because the region experienced several glaciations during the Pleistocene and was entirely covered by the Fennoscandian ice-sheet during the Last Glacial Maximum (LGM), some 20 ky BP. The present study aims at testing this hypothesis by means of numerical simulations.
First, a conceptual numerical study was performed to determine which glacial and subglacial processes need to be represented in numerical models for adequately capturing subglacial groundwater flow dynamics and solute transport. The relevance of the following processes was studied: subglacial recharge of meltwater, poroelastic deformation of the porous medium under ice-sheet loading, isostasy, evolution of surface drainage, permafrost, and density-dependent flow involving fresh glacial meltwater and deep brines. Simulations of these processes were conducted in a generic sedimentary basin during a single glacial event followed by a postglacial period. The transport of three common tracers of subglacial recharge was simulated: δ18O, TDS, and groundwater age. Results
show that simulating subglacial recharge with a fixed flux boundary condition is relevant only for low fluxes, which could be the case under partially wet-based ice-sheets. Glacial loading decreases overpressures, which appear only in thick and low hydraulic diffusivity layers. If subglacial recharge is low, glacial loading can lead to underpressures after the retreat of the ice-sheet. Isostasy considerably reduces the infiltration of meltwater and the groundwater flow rates. Below permafrost, groundwater flow is reduced under the ice-sheet but is enhanced beyond the ice-ice-sheet front. Accounting for salinity-dependent density reduces the infiltration of meltwater at depth. This study shows that each glacial process is potentially relevant in models of subglacial groundwater flow and solute transport.
However, representing only subglacial recharge can be a reasonable assumption if information is missing to describe the other processes properly. Therefore, this single process is simulated to reproduce groundwater flow beneath the Fennoscandian ice-sheet in the northern BAB. Simulations are performed in two cross-sectional models, in order to
vi
check whether subglacial recharge of meltwater can explain the unusual distribution of δ18O in groundwater in the region, which serves as a tracer of glacial meltwater. One
model crosses Estonia, the other crosses Latvia and Estonian islands in the Gulf of Riga. Groundwater flow is simulated over 28 ky, from the Last Glacial Maximum (LGM) to present-day, along with δ18O transport for tracing meltwater and to compare the results of
the simulations with field data. Parameter space exploration of subglacial recharge conditions is used to tackle the uncertainty in the intensity and duration of subglacial recharge in the northern BAB, as well as in the isotopic composition of meltwater. Simulations provide a satisfying fit between the observed and the computed values of δ18O, supporting the idea that subglacial recharge happened in the northern BAB during
the LGM. Simulations show that subglacial recharge created a flow reversal in the basin. Meltwater infiltrated into all aquifers, especially the shallow ones. After the retreat of the Fennoscandian ice-sheet, meltwater was entirely replaced by modern meteoric water, excepted in confined aquifers where some meltwater has been preserved close to the discharge areas. Large volumes of meltwater are also probably preserved beneath the Baltic Sea. Simulations also indicate that episodes of subglacial recharge prior to the LGM must be considered in order to explain the values of δ18O in the deeper basin.
vii
TABLE OF CONTENTS
RÉSUMÉ ... iii
ABSTRACT ... v
TABLE OF CONTENTS ... vii
LIST OF FIGURES ... x
LIST OF TABLES ... xi
ACKNOWLEDGMENTS ... xiii
PREFACE ... xv
1 BACKGROUND ... 1
1.1 Subglacial recharge in the northern Baltic Artesian Basin ... 4
1.2 Objectives ... 5
2 STUDY AREA ... 7
2.1 Glacial history ... 9
2.2 Hydrogeology ... 9
2.3 Geochemical and isotopic evidence of subglacial recharge in the northern BAB 15 3 REPRESENTING GLACIATIONS AND SUBGLACIAL PROCESSES IN HYDROGEOLOGICAL MODELS: A NUMERICAL INVESTIGATION ... 22
Résumé ... 22 Abstract ... 23 3.1 Introduction ... 23 3.2 Glacial Processes ... 26 3.2.1 Subglacial Recharge ... 26 3.2.2 Glacial Loading ... 27 3.2.3 Isostasy ... 28 3.2.4 Permafrost ... 28 3.2.5 Surface Drainage ... 29
3.2.6 Variable Density and Viscosity ... 29
3.3 Methods ... 30
3.3.1 Conceptual Model ... 31
3.3.2 Reference Simulation ... 32
viii
3.3.3.1 Simulations B1 and B2: Subglacial Recharge Boundary Condition ... 34
3.3.3.2 Simulation C: Glacial Loading ... 34
3.3.3.3 Simulations D1 and D2: Isostasy ... 35
3.3.3.4 Simulation E: Permafrost ... 35
3.3.3.5 Simulation F: Variable Density ... 37
3.3.4 Numerical Implementation ... 37
3.4 Results ... 37
3.4.1 Reference Simulation ... 42
3.4.2 Simulations of Individual Glacial Processes ... 44
3.4.2.1 Simulations B1 and B2: Subglacial Recharge Boundary Condition ... 44
3.4.2.2 Simulations C: Glacial Loading ... 44
3.4.2.3 Simulations D1 and D2: Isostasy ... 44
3.4.2.4 Simulation E: Permafrost ... 45
3.4.2.5 Simulation F: Variable Density ... 46
3.5 Discussion ... 46
3.6 Conclusion ... 48
4 MODELLING PALEO-RECHARGE UNDER THE FENNOSCANDIAN ICE-SHEET IN THE NORTHERN BALTIC ARTESIAN BASIN ... 51
Résumé ... 51 Abstract ... 52 4.1 Introduction ... 53 4.2 Study area ... 54 4.3 Methods ... 57 4.3.1 Geometry ... 58 4.3.2 Simulated processes ... 59 4.3.3 Boundary conditions ... 60 4.3.4 Initial conditions ... 63 4.3.5 Hydraulic properties ... 64 4.3.6 Numerical implementation ... 65 4.4 Results ... 66
4.4.1 Steady-state groundwater flow in the northern BAB ... 66
4.4.2 Subglacial recharge in Model A ... 67
ix
4.5 Discussion ... 75
4.6 Conclusion ... 78
5 CONCLUSION ... 81
x
LIST OF FIGURES
1 – Conceptual representation of the processes associated with glaciations in
hydrogeology. ... 4
2 – Location of the Baltic Artesian Basin. ... 8
3 – Geological map and cross-sections of the BAB. ... 12
4 – Measurements of δ18O in the northern BAB and location of models A and B ... 17
5 – Calculated ages in the northern BAB and location of models A and B.. ... 18
6 – Measurements of Cl- in the northern BAB and location of models A and B. ... 19
7 – Identification of mixing between three end members on the basis of Cl- and δ18O data from the Cambrian-Vendian aquifer system. ... 20
8 – Conceptual basin. ... 32
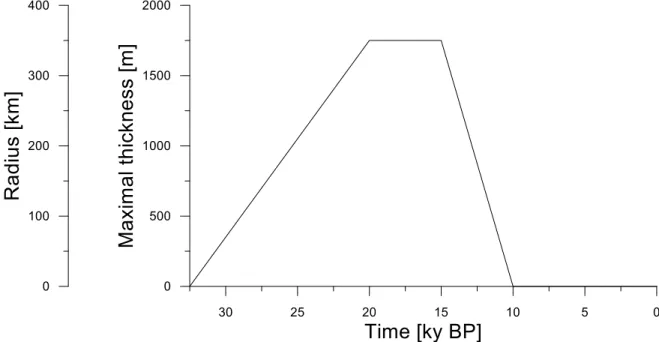
9 – Glaciation scenario: variation of the ice-sheet radius and maximum thickness over time. ... 33
10 – Evolution of hydraulic head, δ18O, salinity, and groundwater age in all simulations. .. 40
11 – Groundwater flow rates in all simulations, in the two deepest aquifers simulations at 27 ky BP. ... 41
12 – Evolution of meltwater content in all simulations, in the two deepest aquifers. ... 42
13 – Evolution of hydraulic head, δ18O, salinity, and groundwater age during reference simulation A. ... 43
14 – Hydraulic heads and δ18O in simulation D1 during the growth of the ice-sheet. ... 45
15 – Evolution of hydraulic heads and δ18O during the simulation considering permafrost. ... 45
16 – Models A and B. ... 58
17 – Scenario of the LGM in the northern BAB. ... 62
18 – Distribution of δ18O in the Ordovician-Cambrian and Cambrian-Vendian aquifer systems. ... 63
19 – Comparison between computed and observed hydraulic heads in the two models. .. 67
20 – Cumulative frequency of the MAE provided by the 288 simulations performed in each model. ... 68
21 – Comparison between computed and observed values of δ18O in the two models. .... 69
xi
LIST OF TABLES
1 – List of simulations. ... 31
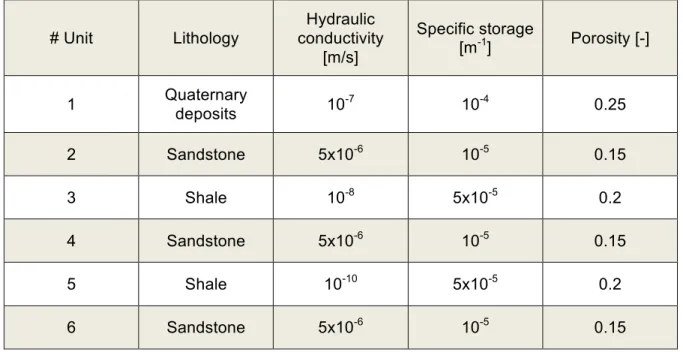
2 – Hydraulic properties of the hydrogeological units. ... 32
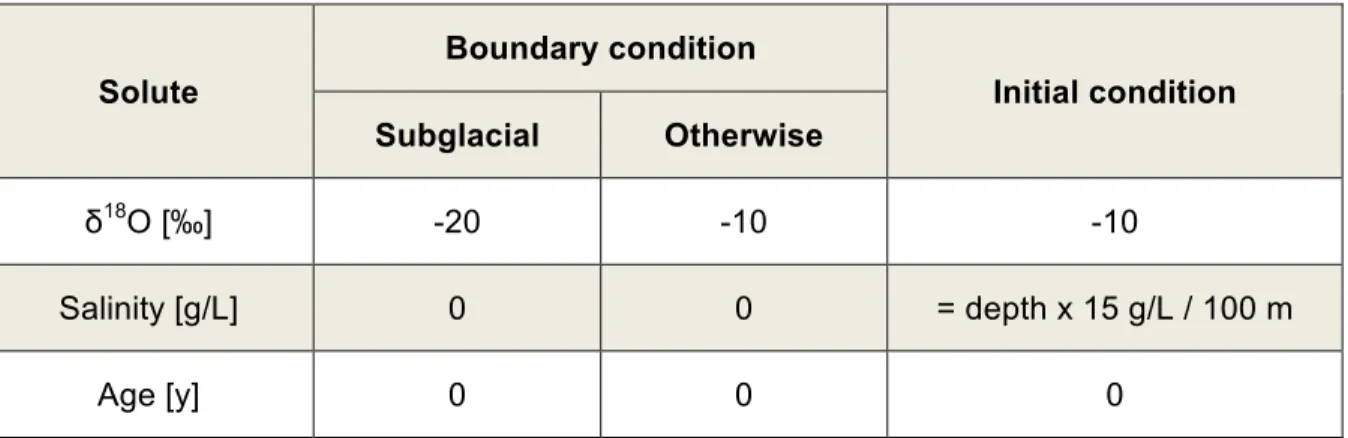
3 – Solute transport initial and boundary conditions. ... 34
4 – Parameters used for the calculation of permafrost thickness and depth. ... 36
5 – Hydraulic properties of the hydrostratigraphic layers. ... 65
6 – Summary of the simulations. ... 62
xii
To my daughter, Chiara To my uncle, Gérald
xiii
ACKNOWLEDGMENTS
As a Ph.D. student, I benefited from a couple of grants and awards. I wish to thank the DoRa program and the Tallinn University of Technology for funding my stays in Estonia in 2014, 2015 and 2016, as well as the Center for Northern Studies, the Faculty of Sciences and Engineering at Laval University and the AEGSEG association for granting me several awards and scholarships.
In addition, I would like to thank a couple of people who particularly supported me during this project. I would like to thank first my supervisor, Jean-Michel Lemieux, who offered me the opportunity to work on this project and supported me financially during its realization, as well as my co-supervisor, Rein Vaikmäe, who hosted me at the Tallinn University of Technology. They both guided me through these years, advising me and sharing their experience of scientific research. I really appreciate the freedom they allowed me in conducting this project and their availability whenever I needed their help. I couldn’t have enjoyed better coaching.
I also would like to thank Pierre Therrien of the Department of Geology and Geological Engineering at Laval University for his precious assistance for solving whatever computer problem I encountered (there were several).
I thank my colleagues from the Department of Geology of the Tallinn University of Technology, especially Joonas Pärn and Valle Raidla, for bringing me to the field and sharing their year-long expertise in Estonian groundwater. It was a real pleasure to work with them and I hope we will collaborate again in the future.
I would also like to acknowledge Prof. Marco Petitta of the Department of Geology at La Sapienza University of Rome for hosting me within his research group for more than a year. Grazié tanto!
Furthermore, I want to thank my friends for their informal but no less important support. I am grateful to my Estonian friends, Liina and Alex, for their kindness and their hospitality. They helped me discover their beautiful and mysterious country and I look forward to return the favor and welcome them in Rome or wherever I will end up after this project. More generally, I heartily thank all my friends without the warm presence of which I probably wouldn’t have survived tough winters in Quebec City, in Tallinn and less tough winters in Rome.
xiv
Finally, I don’t want to end this shortlist of acknowledgments without expressing my gratitude and my love to my family, in particular to Livia, my love, and Chiara, our daughter.
xv
PREFACE
The scientific outcomes of this Ph.D. project are presented in two scientific articles: “Representing Glaciations and Subglacial Processes in Hydrogeological Models: A Numerical Investigation” and “Modelling of paleo-recharge under the Fennoscandian ice-sheet in the northern Baltic Artesian Basin”. The first article presents the first part of these outcomes, i.e. the identification of relevant processes which need to be accounted in numerical models of subglacial hydrogeology. The second article presents the case-study of plaeo-subglacial recharge of meltwater in the northern Baltic Artesian Basin, in Estonia and Latvia.
The Ph.D. student, Arnaud Sterckx, provided the scientific outcomes and had the largest role in the preparation and editing of these two articles, which he accordingly signed as first author. The second and third authors, Prof. Jean-Michel Lemieux and Prof. Rein Vaikmäe, are respectively the supervisor and the co-supervisor of this Ph.D. thesis and contributed to a lesser extent to the preparation of these articles.
The first article was published in Geofluids in April 2017 and is available online in open access. Its full reference is:
Arnaud Sterckx, Jean-Michel Lemieux, and Rein Vaikmäe, “Representing Glaciations and Subglacial Processes in Hydrogeological Models: A Numerical Investigation,” Geofluids, vol. 2017, Article ID 4598902, 12 pages, 2017. doi:10.1155/2017/4598902
It is reproduced here in the same version.
The second article is ready for submission. However, the authors decided to wait for the comments from the reviewers of this Ph.D. thesis before submitting it to the Hydrogeology Journal, in order to account for their comments and remarks and leave some space for the final discussion of this Ph.D. thesis. This article is therefore not presented in its final version. It is likely that some modifications will be made in the version that will be subsequently published.
The two articles are presented after an introduction presenting the context of the research and the objectives of the study, as well as a description of the study area. They are followed by a general conclusion summarizing the major outcomes of this Ph.D. project.
1
1
BACKGROUND
Several geochemical and isotopic studies have shown that glacial meltwater recharged aquifers in North America (e.g., Siegel & Mandle 1984; Clark et al. 2000; Grasby et al. 2000) and northern Europe (Vaikmae et al. 2001), in regions that were covered by ice-sheets during Pleistocene glaciations (see McIntosh et al. 2012 for a review of these studies). The presence of glacial meltwater is commonly identified by low salinity, depletion in heavy isotopes such as 18O and 2H, high excess air, cold recharge
temperatures inferred from noble gases, as well as old groundwater age.
Subglacial recharge is widely recognized as an important mechanism of recharge of meltwater during the Pleistocene. It is well known that ice-sheets can be partially wet-based due to basal friction (Kleman & Glasser 2007) and can release large volumes of subglacial meltwater. Boulton et al. (1995) suggested that meltwater could infiltrate into sufficiently permeable porous media under the pressure exerted by ice-sheets. Supporting this idea, studies have shown that subglacial drainage landforms, such as eskers, are less frequent in more permeable terrains, where more meltwater could have infiltrated into the subsurface instead of flowing at the bed of the ice-sheet (Boulton et al. 1996; Grasby & Chen 2005). Grundl et al. (2013) showed that recharge of supraglacial meltwater can also occur through crevasses in the ablation zone of ice-sheets. In this case, the pressure at the base of the ice-sheet would not be induced by the weight of the ice but by the weight of the column of water within the ice. The rare field studies of subglacial environments in Antarctica and Greenland show that the bed of ice-sheets can be either confined or unconfined and that basal water pressure varies accordingly. In confined conditions, basal water pressure is slightly less than the overburden pressure of the ice (Engelhardt & Kamb 1997), while in unconfined conditions, the pressure depends on the inflow of supraglacial meltwater (Claesson Liljedahl et al. 2016). Claesson Liljedahl et al. (2016) suggest that a gradual evolution exists from confined to unconfined conditions toward the front of ice-sheets. In addition, this study is the only one that collected direct evidence of present-day subglacial recharge of meltwater, in Greenland. The presence of glacial meltwater at depth (Clark et al. 2000) or in abnormal locations with respect to present-day hydraulic gradients (Grasby et al. 2000) suggests that the trend and the intensity of regional flow was considerably modified by subglacial recharge during the Pleistocene.
2
Understanding the impact of glaciations on groundwater flow systems is important for several reasons. First, waters of glacial origin are usually of good quality and are, in some locations, an important source of non-renewable freshwater (e.g. Vaikmäe et al. 2001; Person et al. 2003; Cohen et al. 2010; DeFoor et al. 2011; Siegel et al. 2014). The sound management of these resources requires a good scientific understanding of their origin, their extent and the driving forces acting on them. Secondly, groundwater flow can be an important transport vector for nuclear waste radionuclides. In cases where the containment mechanism of spent nuclear fuel is compromised, groundwater flow could remobilize the radionuclides into the ecosystems and increase the health risks to fauna and humans who depend on it (Talbot 1999). Given the long time scale required for spent nuclear fuels to decay to safe levels, the suitability of deep geologic repositories (DGR) must be demonstrated over timescales of 100 ky. According to geological history, it is likely that at least one glaciation event will occur during this period (Loutre & Berger 2000). Therefore, DGR stability and the risks of contamination from groundwater flow during a glaciation event depend on the dynamics of groundwater flow below ice sheets (van Weert et al. 1997; Person et al. 2012; Provost et al. 2012). In addition to peer-reviewed scientific papers, many technical reports have been issued by nuclear waste agencies in Finland (Posiva), Sweden (SKB) and Canada (NWMO) that have contributed greatly to research in subglacial hydrogeology. Another motivation for studying glaciations in hydrogeology is the migration or the enhancement of hydrocarbon resources in deep basins affected by ice-sheets (Boulton et al. 1996; Lerche et al. 1997; Forsberg 1997; McIntosh & Walter 2005). In North America and northern Europe, ice-sheets retreated at the end of the Pleistocene, more than 10 ky BP. In these regions, groundwater flow systems containing meltwater are not at equilibrium with present-day conditions and their study requires a transient approach, at the scale of climate change (Lemieux et al. 2008b). Numerical models of groundwater flow are powerful tools that can be used to quantify Pleistocene recharge origin, rates and patterns, along with groundwater dynamics. Modelling studies have confirmed that recharge of large volumes of meltwater has the potential to completely reorganize the pattern of regional flow, even to reverse the direction of flow if the ice-sheet runs opposite to the direction of interglacial topography-driven flow (Breemer et al. 2002; Hoaglund et al. 2004). The effects of subglacial recharge of meltwater on groundwater flow can last several thousands of years after the final retreat of ice-sheets (Boulton et al. 1995; Boulton et al. 1996; Person et al. 2007; for a review of these models, see Person et al. 2012). Several studies also have shown that abnormal groundwater pressures with
3
respect to present-day conditions could be explained by stress changes during past glaciations (Neuzil 2012; Nasir et al. 2011; Khader & Novakowski 2014; Neuzil & Provost 2014).
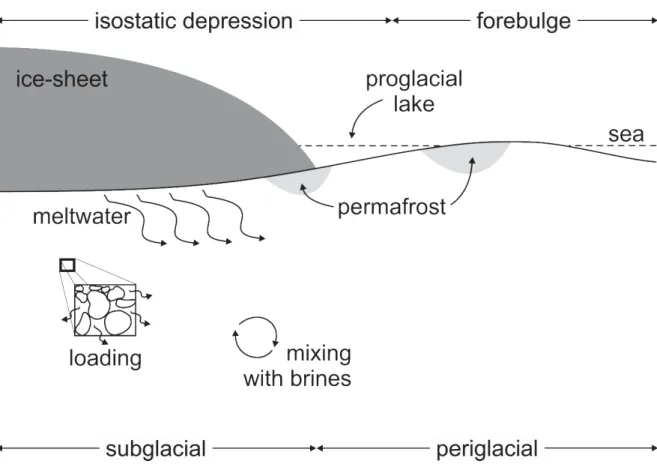
Recent advances in modelling have allowed taking into account not only subglacial recharge but also other processes related to glacial periods, such as permafrost evolution, glacial isostasy, glacial loading, sea-level change and mixing between fresh glacial meltwater and dense brines (e.g. Chan et al. 2005; Bense & Person 2008; Lemieux et al. 2008a; Cohen et al. 2010, McIntosh et al. 2011; Normani & Sykes 2012; Provost et al. 2012; Khader & Novakowski 2014; Siegel et al. 2014; Vidstrand et al. 2014). These processes are illustrated on Figure 1. The state-of-the-art models now include transient 3D groundwater flow, solute and heat transport and elastic deformation of the porous medium. Numerical efforts have also been made to incorporate complex chemical reactions (Bea et
al. 2015). Some models even couple groundwater flow and ice flow (Moeller et al. 2007).
These improvements allow a more accurate representation of glaciations in hydrogeology. However, accurately representing glaciations in hydrogeological models is uncertain because subglacial environments under modern ice-sheets in Greenland and Antarctica are rarely accessible for collecting data (Engelhardt & Kamb 1997; DeFoor et al. 2011; Claesson Liljedahl et al. 2016). Models of Pleistocene recharge are further limited by uncertainties related to paleo-boundary conditions. As noted by Person et al. (2012), boundary conditions pose a major challenge for calibrating and validating these models. Furthermore, the number of processes considered makes it difficult to understand their respective impacts on groundwater flow dynamics. It is not even clear which processes are important to consider for adequately capturing the impact of glaciations on groundwater flow dynamics, because all models neglected at least some processes. In this context, there is a need for new studies, supported by extensive field data and perhaps founded on new approaches.
4
Figure 1 – Conceptual representation of the primary processes associated with glaciations in hydrogeology. Modified after Lemieux et al. (2012a).
1.1 Subglacial recharge in the northern Baltic Artesian Basin
The northern Baltic Artesian Basin (BAB) represents a very interesting case-study because subglacial recharge is attested by one of the most extensive collections of geochemical and isotopic data (after McIntosh et al. 2012), including δ18O, chloride content
and age tracers (Vaikmäe et al. 2001; Raidla et al. 2012; Pärn et al. 2016). Meltwater is found along the coast of the Gulf of Finland in northern Estonia, where it represents a major source of drinking water (Vaikmäe et al. 2008). Meltwater is also found on two small islands in the Gulf of Riga, on Ruhnu and Kihnu islands. Geochemical and isotopic data suggest that meltwater recharged beneath the Fennoscandian ice-sheet (Vaikmäe et al. 2001), which entirely covered the northern BAB during the Last Glacial Maximum (LGM), some 20 ky BP. Studies indicating that the Fennoscandian ice-sheet was wet-based over the northern BAB territory during the LGM support this hypothesis (Jõeleht 1998, cited in Vaikmäe et al. 2001; Boulton et al. 2001; Kleman & Glasser 2007). In a numerical study,
5
Saks et al. (2012) showed that subglacial recharge could indeed have recharged the northeastern part of the basin, creating a reversal of regional flow.
However, Saks et al. (2012) did not simulate transient flow and solute transport. They could not compare their simulation results with the geochemical and isotopic data and could not resolve groundwater recharge dynamics, including the timing and the volume of subglacial recharge. It is still unclear whether subglacial recharge can explain the observed groundwater isotopic distribution in the basin or whether prior glaciations must be referred to, as suggested by Saks (2012) and Gerber et al. (2017). It is also unclear why meltwater is mostly found in northern Estonia and on Ruhnu and Kihnu islands. In other parts of the BAB that were equally covered by the ice-sheet during the LGM, only scattered traces of diluted meltwater are found.
1.2 Objectives
The general objective of this thesis is to better understand the impact of glaciations and related processes on regional groundwater flow systems using numerical models.
This work is divided in two parts. The first part aims to determine which subglacial processes need to be simulated for adequately capturing the impact of glaciations on groundwater flow at the basin scale in numerical models. The following sublacial processes that have been simulated in previous modelling studies are considered: subglacial recharge of meltwater, poro-elastic deformation of rocks under the weight of the ice-sheet (referred to as glacial loading), isostasy, sea-level changes, permafrost evolution and density-dependent flow involving glacial meltwater and deep brines. The individual impacts of these processes on groundwater flow dynamics and solute transport are assessed using a simple conceptual model representing a generic sedimentary basin. The second part builds on the results from the first part and aims at testing the hypothesis of subglacial recharge of meltwater in the northern BAB. Transient modelling of groundwater flow and δ18O transport is used to perform simulations of subglacial recharge
during the LGM and the subsequent evolution of groundwater flow under modern hydrologic conditions. The numerical representation of the LGM is based on the results of the first phase of this work. The uncertainty related to some key parameters controlling subglacial recharge of meltwater is considered through a parameter space exploration.
6
Computed and observed values of δ18O are compared in order to verify whether subglacial
recharge can explain the present-day distribution of δ18O in the region. These simulations
are intended to check the consistency of the hypothesis of subglacial recharge in the northern BAB.
7
2
STUDY AREA
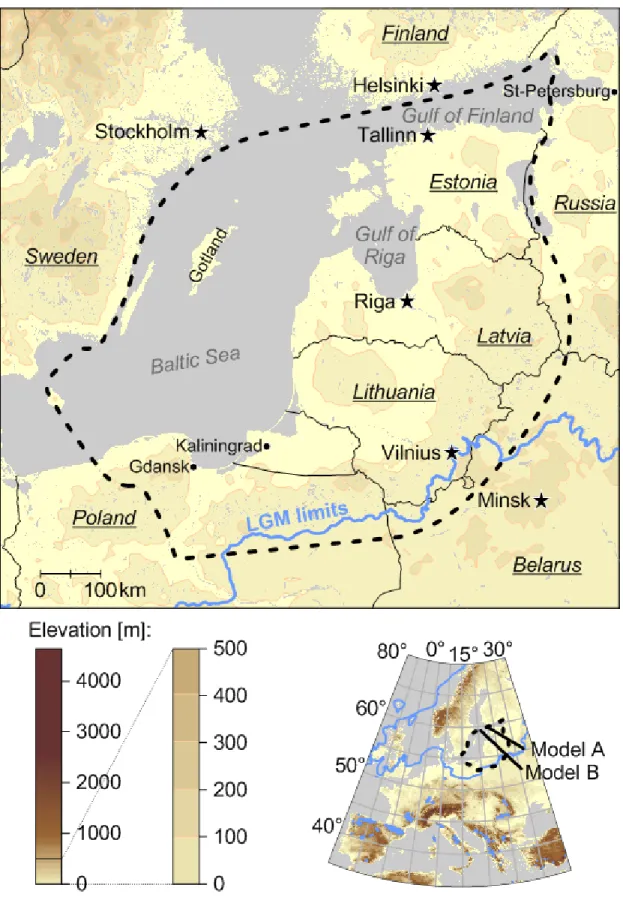
The study area is located in Estonia, which is part of the Baltic Artesian Basin. With a surface area of about 480,000 km², the BAB is one of the largest sedimentary basins in Europe. It covers the Baltic States (Estonia, Latvia and Lithuania), northern Poland and a large part of the Baltic Sea, including the island of Gotland (Figure 2). The most noteworthy evidence of meltwater is found in the northern BAB: in Estonia, along the southern shore of the Gulf of Finland, and on two small islands in the Gulf of Riga, Rihnu and Kuhnu. For this reason, this work focuses on this part of the BAB.
Despite its northern latitude (between 55° and 58.5° N), the region is characterized by a mild climate, under the influence of the Gulf Stream. Temperature ranges from about -4°C in January to about 17°C in summer. The seasonal variation is less along the coast and on the islands than inland. Precipitation is distributed throughout the year and amounts to 600 to 700 mm yearly, as rain and snow. Snow cover is frequent during winter. The relief is quite flat: the average elevations of Estonia and Latvia are 61 m and 87 m, respectively, and their highest points are 318 m and 312 m. Mixed forests (taiga) cover around one half of the region, while peatbogs cover from 5 to 10%. The rest is covered by surface water, arable lands and urban centers. Of interest are two very large postglacial lakes in Estonia, Peïpsi and Võrtsjärv lakes with surface areas of 3550 and 270 km², respectively.
8
Figure 2 – Location of the Baltic Artesian Basin (in dotted lines). The blue line shows the limits of the Fennoscandian ice-sheet during the LGM.
9
2.1 Glacial history
Many glacial landforms such as drumlin fields and erratic boulders record that the northern BAB experienced several glaciations during the Quaternary, during which it was frequently recovered by ice-sheets (Kalm et al. 2011). The LGM corresponds to the last phase of growth of ice-sheets on Earth and marks the end of the Pleistocene. During the LGM, the northern BAB was entirely recovered by the Fennoscandian ice-sheet (Figure 2). The retreat of the Fennoscandian ice-sheet is well documented by stratigraphic evidence, especially in end moraines, and was completed around 12.5 ky BP. Dating the beginning of the LGM in the region is less easy, as most of the stratigraphic evidence was destroyed by the flow of ice. After Lasberg & Kalm (2013), it didn’t start earlier than 25 ky BP and no later than 19 ky BP. Estimates of the maximum ice-sheet thickness in the northern BAB vary around 2000 m (Siegert et al. 2004; Clason et al. 2014). No evidence of paelo-permafrost has been found in the northern BAB but is abondant in more southern regions of Europe (Huijzer & Vandenberghe 1998), suggesting that permafrost was present in the northern BAB before and maybe after the LGM. The LGM was followed by a rapid increase of the relative sea level over the Baltic region. Stratigraphic evidence reflects a complex history of the Baltic Sea during the Holocene, influenced by postglacial isostatic uplift, during which shorelines and salinity varied irregularly (Harff & Meyer 2011; Emeis et
al. 2003). Again, the postglacial uplift is well documented by paleo-shorelines, while
isostasy before the deglaciation must be estimated by inverse modelling (e.g. Lambeck et
al. 1998).
Before the LGM, Estonia was ice-free up to at least 44 ky BP (Kalm et al. 2011). Several till deposits dating back up to the older Saalian indicate that the northern BAB was covered several times by ice-sheets (Kalm et al. 2011), which is in agreement with the climatic history of the Quaternary.
2.2 Hydrogeology
A geological map of the BAB and two cross-sections are presented in Figure 3. The BAB is a synclinal structure of sedimentary layers lying on the southern slope of the Baltic Shield, which outcrops in Finland and in a very few places on the northern coast of
10
Estonia. It is folded along a NE-SW direction and thickens along this axis to reach 4.5 km in northern Poland. Groundwater from the BAB constitutes the major source of fresh drinking water in the Baltic States (Juodkazis 1994). In Estonia, it accounts for 70% of the total drinking water consumption (Perens & Vallner 1997), the rest being provided by treated surface water. In Latvia, it accounts for 60% of the total water withdrawal (Eurostat 2016).
12
Figure 3 – Geological map and cross-sections of the BAB, based on the geological model of Saks et al. (2012). Quaternary deposits are not represented on the map.
13
In the northern BAB, sedimentary layers range from Vendian (Ediacarian) to Devonian. Due to the synclinal structure, the older aquifer systems outcrop in northern Estonia, while younger aquifer systems outcrop in central Latvia. A description of the hydrostratigraphy was made by Perens & Vallner in Geology and Mineral Resources of Estonia (1997), which is summarized here.
- The crystalline basement is sometimes assumed to be impervious (Virbulis et al.
2013) but its upper portion may have developed some permeability and some studies considered it as a permeable layer (Vallner et al. 2003). Marandi & Vallner (2010) showed that in the area of Tallinn, the lower Vendian aquifer contains saline water from the crystalline basement.
- The Cambrian-Vendian aquifer system is made of sandstones and siltstones
with hydraulic conductivities of 2 to 6 m/d on average. In eastern Estonia, the clayey Kotlin aquitard separates the Gdov and Voronka aquifers.
- The Lontova aquitard system is formed by the clayey Lükati and Lontova
Formations, whose thickness reaches 100 m in northern Estonia. It is an efficient confining unit, whose vertical hydraulic conductivity averages 10-7 – 10-5 m/d.
- The Cambrian-Ordovician aquifer system regroups Upper Cambrian and Lower
Ordovician Formations composed of fine grained sandstones and siltstones. Its total thickness varies from 20 to 60 m. Their hydraulic conductivity is about 1 – 3 m/d.
- Other Ordovician and Silurian layers are dominated by limestones. Their permeability is low but increases near the surface where fractures and weathering (karst) occur. This implies making a distinction between the upper Ordovician-Silurian aquifer system and the lower Ordovician-Ordovician-Silurian aquitard system.
- Formations of the Middle to Lower Devonian aquifer system are dominated by
sandstone, with a good hydraulic conductivity averaging 2 to 6 m/d.
- The clay content of the Narva aquitard considerably decreases its hydraulic
conductivity (around 10-5 – 10-4 m/d). It acts as a regional aquitard.
- The Middle Devonian aquifer system consists of silts and sandstones, with
interlayers of clay. These lenses are estimated to account for one-third of the aquifer volume, so that the Middle Devonian aquifer can be seen as an assembly
14
of smaller confined aquifers. The hydraulic conductivity of the Middle Devonian aquifer averages 1 to 3 m/d.
- The Upper Devonian aquifer system consists of fissured and karstified dolomites
and dolomitized limestones, whose hydraulic conductivity is high and highly dependent on the weathering.
- Quaternary deposits mainly consist of Pleistocene glacial deposits, i.e. glacial till
and glaciolacustrine sandy loam. Their thickness usually ranges from 3 to 30 m but may occasionally exceed 100 m in southeastern Estonia.
To summarize, the sedimentary series contains carbonated and terrigeneous aquifers. It also hosts two aquitards with a very low permeability: the Lontova aquitard system and the Narva aquitard. The role of the Silurian-Ordovician aquitard system remains unclear because its permeability is highly heterogeneous. This description holds for continental Estonia. In the West-Estonian Archipelago, hydrostratigraphy is slightly different (Perens & Vallner 1997). Some changes are also expected in Latvia, though no equivalent to Perens & Vallner’s compilation work was made in this country.
Two models of regional groundwater flow have been developped by Vallner (2003) and Virbulis et al. (2013). The first model covers Estonia, while the second covers the entire BAB. Both models are 3D steady-state models representing present-day hydrologic conditions. They show that the deeper confined aquifers are affected by regional flow recharging in the south-eastern BAB and discharging into the Baltic Sea. In shallower aquifers, the flow is shorter and controlled by local topography. No abnormal pressure was noticed in the northern BAB in these two studies, which suggests that the flow is at equilibrium with present-day conditions. These two models used different geometric models. It is impossible to compare the hydraulic properties assigned in the two models because they weren’t mentioned by Vallner (2003). One major assumption that was made in these two models is that variable density flow was not considered, which could have a great influence on the flow computed in the deeper basin, where brines are present.
Studies have shown that seawater intrusion occurred in northern Estonia during the second half of the 20th century, where groundwater extraction was the most intensive, i.e.
near Tallinn, the capital of Estonia, and the major industrial centers (Karro et al. 2004; Marandi & Vallner 2010). Since the nineties, declining industrial activities and a better management of groundwater resources have enabled a gradual recovery of the depression cones that had been created (Vaikmäe et al. 2008).
15
In addition, noticeable hydrogeological features have been identified, such as buried valleys and faults. In northern Estonia, buried valleys have been interpreted as permeable pathways connecting the Cambrian-Vendian and Ordovician-Cambrian aquifer systems as deep as 200 m to the surface (Geology and mineral resources of Estonia, 1997; Pärn et al. 2016). Several faults cross the northern BAB, many of which are located in central Latvia, with a vertical displacement up to several hundreds of meters. They may play an important role in regional flow of groundwater within the deeper aquifer systems (Saks et al. 2012; Gerber et al. 2017) but to date it is not clear whether they act as barriers or as conduits.
2.3 Geochemical and isotopic evidence of subglacial recharge in
the northern BAB
A map of δ18O distribution in groundwater in the northern BAB is presented in Figure 4. In
northern Estonia, groundwater exhibits the most negative values of δ18O ever measured in
groundwater in Europe (about -22‰, Vaikmäe et al. 2001). Though subject to regional and seasonal variation (Raidla et al. 2016), δ18O averages 10.4‰ in modern precipitation in
Estonia (Punning et al. 1987), which clearly indicates that groundwater paleo-recharge occurred under colder climatic conditions. This is further supported by the temperature of recharge that was inferred from noble gases concentrations, which is slightly above the freezing point (Vaikmäe et al. 2001). Absence of 3H (Vaikmäe et al. 2001) and 14C ages
ranging from 27 to 14 ky BP (Raidla et al. 2012, Figure 5) suggest recharge during the LGM, during which Estonia was entirely recovered by the Fennoscandian ice-sheet. Relatively low salinity (< 1 g/L, Figure 6) also indicates a not too ancient recharge (at the scale of the Pleistocene). Raidla et al. (2012) acknowledge that radiocarbon ages only provide an estimate of the time of recharge, because of matrix dissolution and organic reactions. Nevertheless, recharge under the Fennoscandian ice-sheet is plausile because permafrost would have prevented any recharge in periglacial environments during this period. As noted by Jirakova et al. (2011), the LGM corresponds to a gap of recharge in most of northern Europe due to the presence of permafrost. In the northern BAB, the Fennoscandian ice-sheet was probably wet-based (Jõeleht 1998, cited in Vaikmäe et al. 2001; Boulton et al. 2001; Kleman & Glasser 2007), which supports the hypothesis of subglacial recharge. Regional flow reversal induced by subglacial recharge could also explain why glacial water is found in the deepest, confined aquifers, i.e. the
Cambrian-16
Vendian aquifer system and, to a lesser extent, in the Ordovician-Cambrian aquifer system, at depths up to 300 m and close to the discharge area in the Gulf of Finland. Evidence of flow reversal was highlighted by Grasby et al. (2000) in the Williston Basin, in North America. Saks et al. (2012) showed numerically that subglacial recharge in the northern BAB could indeed have created a reversal of regional flow. Another curiosity is the high excess gas that is found in some wells, reaching up to five times oversaturation (Vaikmäe et al. 2001). Oversaturation could have been reached by ice melting under high pressure (Vaikmäe et al. 2001) or due to the rapid changes of the water table within the ice-sheet.
In addition to subglacial recharge of meltwater, alternative explanations to the glacial signature of groundwater in the northern BAB were proposed by Mokrik (1997) and Mokrik & Mažeika (2012), implying cryogenic metamorphism of groundwater through several cycles of freezing and thawing of permafrost and intrusion of surface water through taliks, respectively. However, none of these hypotheses was tested numerically and they didn’t find much support in subsequent studies (Vaikmäe et al. 2001; Saks et al. 2012).
Figure 4 shows that glacial water is found everywhere along the northern coastline of Estonia, excepted in its central part where the Cambrian-Vendian aquifer system outcrops. Glacial water is also found on Rihnu and Kihnu islands, in the Gulf of Riga, in the shallower Lower Devonian aquifer system. In the rest of the BAB, the glacial geochemical and isotopic signal is absent, or diluted, suggesting that meltwater was mixed with some other water (Babre et al. 2016). On the basis of chloride content and δ18O, several studies
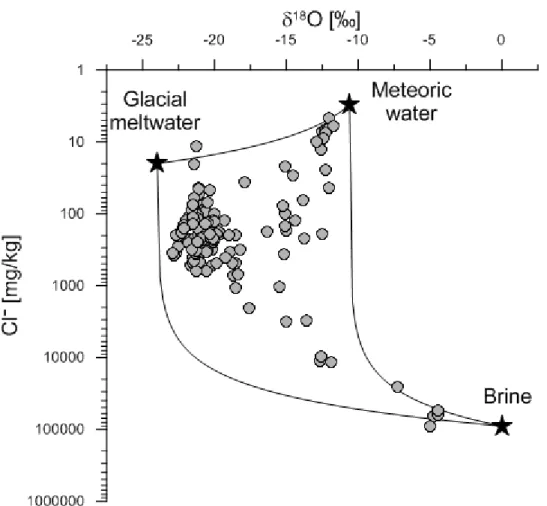
showed that any groundwater in the BAB results from the mixing between three end-members: glacial water, deep dense brines and modern meteoric recharge, as displayed in Figure 7 (Raidla et al. 2009; Pärn et al. 2016; Gerber et al. 2016). Glacial water is characterized by low chloride content and very negative δ18O (around -22.5‰), dense
brines have a very high chloride content (up to 100 g/L) and δ18O around -5‰, while
modern precipitation is fresh and depleted in 18O to -11‰. Modern meteoric recharge is
also identified by large tritium concentrations, while 81Kr enables the dating of brines back
to 1.3 Ma (Gerber et al. 2017, Figure 5). However, there is no guarantee that these three end-members have homogeneous chemical and isotopic compositions, especially if mixing occurred during several glacial and interglacial cycles (Gerber et al. 2017). Saks et al. (2012) estimated the depths of meltwater intrusion in the northern BAB during the LGM and concluded that the present-day distribution of glacial meltwater results from several
17
glaciations. Gerber et al. (2017) also argued that the geochemical and isotopic signature of deep groundwater in southern Estonia results from at least two glaciations.
The northern BAB is the only place in Europe where strong evidence of subglacial recharge has been extensively collected. However, it is likely that subglacial recharge also occurred across the Estonian-Russian border because strong depletion in 18O has also
been measured in Russia, in the region of Saint-Petersburg (Tokarev 2015). δ18O values
as low as -16‰ have also been measured in Finland (Posiva 2013) but the low permeability of crystalline rocks in Finland probably didn’t allow the infiltration of large volumes of meltwater as in the BAB. In England, Black & Barker (2016) suggest that abnormal pressures measured today could be inherited from subglacial recharge during the LGM.
Figure 4 – Measurements of δ18O in the northern BAB and location of models A and B.
The colors of the circles refer to the sampled aquifer system (see Figure 3 for the color legend). The size of the circles increases linearly. Data are from Raudsep et al. (1989), Välkmann et al. (1992), Kivit et al. (1993), Savitskaja & Viigand (1994), Savitskaja et al.
18
(1995), Savistkaja et al. (1996a), Savistkaja et al. (1996b), Savitskaja et al. (1997), Vaikmäe et al. (2001), Karro et al. (2004), Raidla et al. (2009), Raidla et al. (2012), Raidla
et al. (2014), Pärn et al. (2016), Raidla et al. (2016).
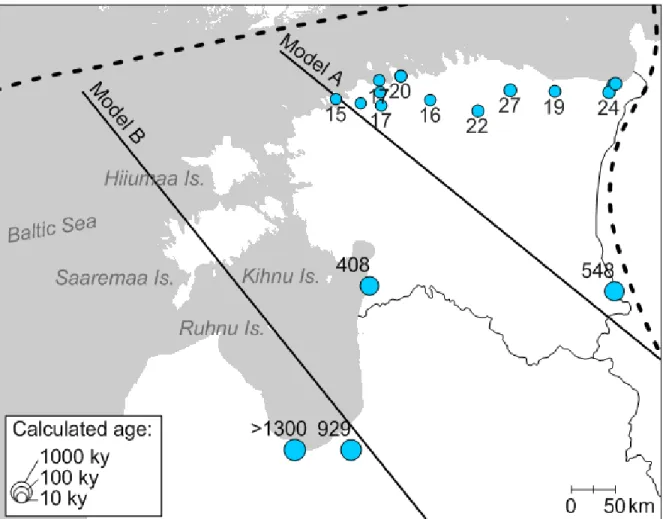
Figure 5 – Calculated ages in the northern BAB and location of models A and B. Ages in northern Estonia were calculated by Raidla et al. (2012) on the basis of 14C
measurements. Larger ages in the south of the study area were calculated by Gerber et al. (2017) on the basis of 81Kr measurements. The colors of the circles refer to the sampled
aquifer system (see Figure 3 for the color legend). The size of the circles increases logarithmically.
19
Figure 6 – Measurements of Cl- in the northern BAB and location of models A and B. The
colors of the circles refer to the sampled aquifer system (see Figure 3 for the color legend). The size of the circles increases logarithmically. References of the data are the same as in
20
Figure 7 – Identification of mixing between three end members on the basis of Cl- and δ18O
data from the Cambrian-Vendian aquifer system published in Raidla et al. (2009) and Gerber et al. (2017). The figure is reproduced from Gerber et al. (2017).
22
3
REPRESENTING GLACIATIONS AND SUBGLACIAL
PROCESSES IN HYDROGEOLOGICAL MODELS: A
NUMERICAL INVESTIGATION
Arnaud Sterckx1,2, Jean-Michel Lemieux1,2 and Rein Vaikmäe3
1Département de Géologie et de Génie Géologique, 1065 avenue de la Médecine,
Université Laval, Québec, QC, Canada G1V 0A6
2Center for Northern Studies, Université Laval, 2405 rue de la Terrasse, Québec,
QC, Canada G1V 0A6
3Department of Geology, Tallinn University of Technology, 5 Ehitajate Tee, 19086
Tallinn, Estonia
Published in: Geofluids, Volume 2017 (2017), Article ID 4598902, 12 pages https://doi.org/10.1155/2017/4598902
Résumé
L'impact de processus glaciaires sur l'écoulement des eaux souterraines et le transport de solutés en-dessous de grandes calottes glaciaires a été déterminé au moyen de simulations numériques. L'écoulement des eaux souterraines ainsi que le transport de δ18O, de solide dissouts et d'âge ont été simulés durant un épisode glaciaire suivi d’une
période postglaciaire, dans un modèle représentant un bassin sédimentaire conceptuel. Les résultats montrent que la simulation de la recharge sous-glaciaire avec une condition-limite de type 1 (Dirichlet) n'est pertinente que pour des flux de faible amplitude, ce qui pourrait être le cas sous des calottes glaciaires dont la base n’est que partiellement en fusion. La compression de la matrice rocheuse diminue les surpressions, qui apparaissent uniquement dans les couches à faible diffusivité hydraulique et épaisses. Si la recharge glaciaire est faible, la compression de la matrice rocheuse peut entraîner des sous-pressions après le retrait de la calotte glaciaire. L’isostasie réduit considérablement
23
l'infiltration d'eau de fonte et les écoulements d'eau souterraine. Sous la couche de pergélisol, l'écoulement des eaux souterraines est réduit en-dessous de la calotte glaciaire mais augmente en région périglaciaire. Tenir compte des variations de densité en lien avec la salinité diminue l'infiltration d'eau de fonte en profondeur. Cette étude montre que chaque processus sous-glaciaire est potentiellement important et devrait être pris en compte dans des modèles d’écoulement des eaux souterraines et de transport de solutés en milieu sous-glaciaire. Les résultats produits constituent une bonne base pour l’élaboration et l’interprétation de tels modèles dans le futur.
Abstract
The specific impact of glacial processes on groundwater flow and solute transport under ice-sheets was determined by means of numerical simulations. Groundwater flow and the transport of δ18O, TDS, and groundwater age were simulated in a generic sedimentary
basin during a single glacial event followed by a postglacial period. Results show that simulating subglacial recharge with a fixed flux boundary condition is relevant only for small fluxes, which could be the case under partially wet-based ice-sheets. Glacial loading decreases overpressures, which appear only in thick and low hydraulic diffusivity layers. If subglacial recharge is low, glacial loading can lead to underpressures after the retreat of the ice-sheet. Isostasy reduces considerably the infiltration of meltwater and the groundwater flow rates. Below permafrost, groundwater flow is reduced under the ice-sheet but is enhanced beyond the ice-ice-sheet front. Accounting for salinity-dependent density reduces the infiltration of meltwater at depth. This study shows that each glacial process is potentially relevant in models of subglacial groundwater flow and solute transport. It provides a good basis for building and interpreting such models in the future.
3.1 Introduction
Glaciations are known to have a large and long-lasting impact on groundwater flow. Several geochemical and isotopic studies have shown that water of glacial origin is still present in basins in North America (e.g., Siegel & Mandle 1984; Clark et al. 2000) and
24
northern Europe (Vaikmäe et al. 2001) that were formerly covered by ice-sheets (see McIntosh et al. 2012 for a review of these studies). The presence of glacial water is commonly identified by low salinity, depletion in heavy isotopes such as 18O and 2H, high
excess air, cold recharge temperature inferred from noble gases, and old groundwater age.
Subglacial recharge of meltwater is the prevailing hypothesis of recharge of water of glacial origin during the Pleistocene (e.g., Boulton et al. 1995; Vaikmäe et al. 2001). Ice-sheets can be partially wet-based (Kleman & Glasser 2007) due to basal friction and can release large volumes of subglacial meltwater. If the permeability of the ground is sufficient, it was put forward that meltwater could infiltrate into the subsurface under the pressure exerted by the ice-sheet (Boulton et al. 1996; Grasby & Chen 2005). Grundl et al. (2013) showed that recharge of supraglacial meltwater can also occur below ice-sheets due to the presence of crevasses. In this case, the pressure at the base of the ice-sheet would not be induced by the weight of the ice but by the weight of the column of water within the ice. The presence of fresh water at depth (Clark et al. 2000) or in abnormal position with respect to present-day hydraulic gradient (Grasby et al. 2000) suggests that the trend and the intensity of regional flow were considerably modified. Modelling studies confirmed that the injection of large volumes of meltwater has the potential to reorganize entirely the pattern of regional flow (Boulton et al. 1996) and even to reverse the direction of the flow if the ice-sheet runs opposite to the direction of interglacial topography-driven flow (Breemer et al. 2002).
Understanding the impact of glaciations on groundwater flow systems is important for several reasons. First, waters of glacial origin are usually of good quality and are, in some locations, an important source of non-renewable freshwater (Vaikmäe et al. 2001; Person
et al. 2003). The sound management of these resources requires a good scientific
understanding of their origin, their extent, and the driving forces acting on them. Secondly, groundwater flow can be an important transport vector for nuclear waste radionuclides. In cases where the containment mechanism of spent nuclear fuel is compromised, groundwater flow could remobilize the radionuclides into the ecosystems and increase the health risks to fauna and humans who depend on it (Talbot 1999). Given the long time scale required for spent nuclear fuels to decay to safe levels, the suitability of deep geologic repositories (DGR) must be demonstrated over timescales of 100 ky. According to geological history, it is likely that at least one glaciation event will occur during this period
25
(Loutre & Berger 2000). Therefore, DGR stability and the risks of contamination from groundwater flow during a glaciation event depend on the dynamics of groundwater flow below ice-sheets (Person et al. 2012). Another motivation for studying glaciations in hydrogeology is the migration or the enhancement of hydrocarbon resources in deep basins affected by ice-sheets (Lerche et al. 1997; McIntosh & Walter 2005).
In North America and northern Europe, ice-sheets have retreated at the end of the Pleistocene, more than 10 ky BP. In these regions, groundwater flow systems containing glacial water are not at equilibrium with present-day conditions and their study requires a transient approach, at the scale of climate changes (Lemieux et al. 2008b). Numerical models of groundwater flow are powerful tools that can be used to quantify Pleistocene recharge origin, rates, and patterns, along with groundwater dynamics. Recent advances in modelling have allowed taking into account the numerous processes involved during a glacial period. The state-of-the-art models now include sophisticated transient 3D groundwater flow, subglacial recharge, permafrost evolution, glacial isostasy, ice loading, and sea-level change (Bense & Person 2008; Lemieux et al. 2008a; Cohen et al. 2010; McIntosh et al. 2011; Normani & Sykes 2012; Provost et al. 2012; Khader & Novakowski 2014; Siegel et al. 2014; Vidstrand et al. 2014).
However, the paucity of field data as well as uncertainties in paleoclimatic forcing, palaeoboundary conditions, and petrophysical properties pose a major challenge for calibrating and validating these models (Person et al. 2012). Moreover, the amount of processes considered makes it difficult to understand their respective impacts on groundwater flow dynamics. It is also unclear whether all these processes are important to be considered for adequately capturing the impact of glaciations on groundwater flow dynamics.
The objective of this study is to assess the specific impact of glacial processes on groundwater flow dynamics and to find out which are relevant to include into a numerical model for efficiently capturing the impact of glaciations on groundwater flow at the basin scale. To do so, glacial processes that are characteristic of subglacial environments and could have an impact on groundwater flow are first identified and the strategy for implementing those processes into a numerical model is discussed. Those glacial processes are subglacial recharge, poroelastic deformation of rocks under the weight of the ice-sheet, isostasy, surface drainage evolution, permafrost evolution, and density-dependent flow involving glacial meltwater and deep brines. The individual impacts of
26
these processes on groundwater flow dynamics and solute transport are then assessed using a simple conceptual model representing a sedimentary basin. The finding of this study should help determining which of these processes need to be simulated for adequately representing glaciations in hydrogeological numerical models.
3.2 Glacial Processes
Over the last decades, a wide range of numerical models of subglacial hydrogeology have been published, spanning different space and time scales, being two- or three-dimensional and steady-state or transient, solving solute transport, heat transport, or deformation equations in addition to the flow equation, and, last but not least, representing different glacial processes. This section briefly presents those glacial processes and the challenges associated with their numerical representation.
3.2.1 Subglacial Recharge
Numerical models have demonstrated that subglacial recharge is able to explain the presence of large volumes of fresh glacial water at great depth or in abnormal position with respect to present-day flow conditions (Boulton et al. 1995). Therefore, the fundamental relevance of this process on subglacial hydrogeology is not discussed in this paper. What is discussed instead is the impact of the boundary condition used for representing this process numerically. Two approaches are commonly used: (1) a prescribed head below the ice-sheet or (2) a specified flux representing the inflow of meltwater into the subsurface.
When a fixed head is chosen, it is most of the time considered that the head is equivalent to the weight of the ice-sheet, after the following relation:
ℎ = 0.9×𝑇𝑇, (1)
where ℎ is the head prescribed beneath the ice-sheet [m], 0.9 is the ratio between the density of ice and the density of liquid water, and 𝑇𝑇 is the ice-sheet thickness [m] (e.g., Bense & Person 2008; Cohen et al. 2010; McIntosh et al. 2011; Siegel et al. 2014; Vidstrand et al. 2014). Whether this head represents the weight of the ice-sheet or the water column within the ice, this boundary condition can be seen as an upper limit,
27
because any upper value would cause the ice-sheet to “float.” For this reason, some authors (Piotrowski 1997; Normani & Sykes 2012) have assigned smaller heads, which means that not all the weight of the ice-sheet was supported by basal meltwater or the water-table was located lower within the ice-sheet. However, the rare field measurements of subglacial pressure under modern ice-sheets support the use of (1) (Engelhardt & Kamb 1997; Claesson Liljedahl et al. 2016).
When a specified flux is used, it can be constrained by a maximal head equivalent to the weight of the ice (Lemieux et al. 2008a; Provost et al. 2012): fixed flux turns into fixed head when basal meltwater reaches the pressure of the ice-sheet. In the literature, meltwater fluxes usually vary between 0 and 30 mm/yr (e.g., Boulton et al. 1995; van Weert et al. 1997; Breemer et al. 2002).
3.2.2 Glacial Loading
One of the glacial processes much subject to speculation is the deformation of the porous medium. Neuzil (2012) identified two types of deformation: direct loading (or compaction) under the weight of the ice and flexural loading in subglacial and periglacial regions affected by glacioisostatic flexure of the lithosphere. Direct loading is supposed to generate abnormal pressures in low hydraulic diffusivity porous media, where pressure changes induced by direct loading/unloading dissipate slowly (Bense & Person 2008). Nasir et al. (2011), Khader and Novakowski (2014), and Neuzil and Provost (2014) showed that direct loading could explain abnormal underpressures observed in the eastern Michigan Basin, USA. The effect of flexural loading is more obscure, because flexure causes compressive and extensive stresses whose distribution and intensity evolve transiently. Neuzil (2012) and Khader and Novakowski (2014) argue that flexural loading could be of greater magnitude than direct loading. However, no clear relation between abnormal pressures and flexural loading was found on the field (Neuzil 2012). Given the complexity to represent flexural loading numerically, few hydrogeological models have considered this process (Khader & Novakowski 2014).
For this reason, only direct loading was considered in the present study. To simulate direct loading, constitutive equations for poroelastic deformation and flow should be coupled, which can be done numerically (Rühaak et al. 2014). However, in a review of the hydromechanical effects of glaciations, Neuzil (2012) notes that the poroelastic
28
deformation equation requires mechanical properties as well as initial and boundary conditions that are poorly known. In fact, most of the studies used a simplified, uncoupled approach in which the deformation of the porous medium is only vertical (Bense & Person 2008; Lemieux et al. 2008a; Cohen et al. 2010; Normani & Sykes 2012; Siegel et al. 2014; Neuzil & provost 2014). With this method, any increment of ice-sheet thickness produces an increment of hydraulic head. Other than assuming elastic deformation, this approach supposes that the deformation is linear. Linearity requires that the stresses are small and that the variations of compressibility and permeability can be neglected. According to Neuzil (2012), linear elasticity is an acceptable assumption if the porous medium has experienced preconsolidation during previous glaciations. Linear elasticity could be unfit for describing the deformation of fractured media.
3.2.3 Isostasy
Isostasy refers to the gravitational equilibrium between the lithosphere and the underlying mantle. The current isostatic uplift following the Last Glacial Maximum is generally well documented by paleoshorelines. However, evidences of isostatic depletion during and prior to the Last Glacial Maximum are sparse. Past topographic elevations estimated by inverse models can be used, if available (Lemieux et al. 2008a; Khader & Novakowski 2014). Otherwise, isostatic depletion and rebound can be assumed to be proportional to the ice-sheet thickness (Bense & Person 2008; Cohen et al. 2010; Siegel et al. 2014). Considering several kilometers thick ice-sheets, the change in surface elevation could reach several hundreds of meters in places. This change being spatially heterogeneous, the regional hydraulic gradients are expected to be considerably modified (Lemieux et al. 2008a)
3.2.4 Permafrost
Permafrost is a soil whose temperature remains below 0°C for at least 2 consecutive years. With some exceptions, it means that at least a fraction of the water content is frozen. The presence of frozen water decreases the effective porosity of the medium and its permeability (Horiguchi & Miller 1980; Kleinberg & Griffin 2005). Numerical simulations having considered permafrost have shown that it may behave as a confining unit and promote subpermafrost overpressure development in the vicinity of the front of the
ice-29
sheet (e.g., Boulton et al. 1995; van Weert et al. 1997; Breemer et al. 2002; Vidstrand et
al. 2013). For this reason, permafrost has been considered in several studies (e.g., Bense
& Person 2008; Lemieux et al. 2008a; Normani & Sykes 2012; Provost et al. 2012; Vidstrand et al. 2014).
3.2.5 Surface Drainage
Large bodies of surface water (rivers, seas, and lake) are of importance in any groundwater flow system. In the context of glaciations, they can be particularly relevant for at least two other reasons. First, in permafrost areas, the bed of sufficiently thick water bodies can be preserved from freezing and promote talik development, ensuring a pathway for recharging or discharging groundwater (Boulton et al. 1996; van Weert et al. 1997). Secondly, during ice-sheet melting, large proglacial water bodies are usual because large volumes of meltwater are released that fill in the isostatic depression. During the period following the retreat of the ice-sheet, the level of these proglacial water bodies generally decreases in relation to the postglacial isostatic uplift. Since the rate of uplift varies spatially, the history of shorelines displacement varies from one location to another (e.g., Harff & Meyer 2011). In places, this history is further complicated by the rapid drainage of lakes or by marine transgressions. Examples can be found, for instance, in Björck (1995) for the Baltic Sea history or in Clarke et al. (2004) for the final stage of the Agassiz Lake in North America. It results that the base level of groundwater flow constantly changes, both spatially and temporally. In North America, several models have demonstrated the role of subglacial recharge and sea-level changes in the emplacement of glacial freshwater offshore on the Atlantic Continental Shelf, USA (Person et al. 2003; Cohen et al. 2010; Siegel et al. 2014). Similar simulations have also been applied to Greenland (DeFoor et al. 2011). In the present study, the relevance of base level changes in relation to postglacial uplift is considered.
3.2.6 Variable Density and Viscosity
Many authors have simulated the variation of density and viscosity, because meltwater can be driven to great depth in sedimentary basins where brines are present (Bense & Person 2008; Lemieux et al. 2008a; McIntosh et al. 2011; Normani & Sykes 2012; Provost
30
et al. 2003; Cohen et al. 2010; DeFoor et al. 2011; Siegel et al. 2014). It was showed that
more saline water restrains the emplacement of fresh meltwater into the deeper part of sedimentary basins and into coastal aquifers. In the present study, effects of density-driven flow are assessed. Variations of viscosity however are not considered, for simplicity.
3.3 Methods
The selected glacial processes were implemented in a transient groundwater flow and solute transport numerical model, representing a generic sedimentary basin. This model is intended to portray subglacial groundwater flow dynamics at the regional scale, where subglacial recharge is the dominant process. It is thus not representative of periglacial regions, where other processes such as permafrost or lithospheric flexure could be more significant. Reactive transport is not considered, as it was already studied by Bea et al. (2016).
To assess the respective impact of the selected glacial processes on groundwater flow dynamics, the following procedure was followed. First, a reference case was simulated, considering only subglacial recharge. Then, the other glacial processes were added individually to the reference simulation. The results of each simulation were compared to the reference simulation in order to determine the relative impact of each individual glacial process. Table 1 summarizes all the simulations that were performed in this study.