HAL Id: hal-01007511
https://hal.archives-ouvertes.fr/hal-01007511
Submitted on 8 Sep 2018
HAL is a multi-disciplinary open access
archive for the deposit and dissemination of
sci-entific research documents, whether they are
pub-lished or not. The documents may come from
teaching and research institutions in France or
abroad, or from public or private research centers.
L’archive ouverte pluridisciplinaire HAL, est
destinée au dépôt et à la diffusion de documents
scientifiques de niveau recherche, publiés ou non,
émanant des établissements d’enseignement et de
recherche français ou étrangers, des laboratoires
publics ou privés.
A specific triaxial device for the study of internal
erosion on cohesive soils
Didier Marot, Alain Alexis, Fateh Bendahmane
To cite this version:
Didier Marot, Alain Alexis, Fateh Bendahmane. A specific triaxial device for the study of internal
erosion on cohesive soils. Internal erosion of dams and their foundations, pp.159-165, 2007.
�hal-01007511�
A specific triaxial device for the study of internal erosion in cohesive soils
D. Marot, A. Alexis & F. Bendahmane
Institut GeM, I.U.T. de Saint-Nazaire, Saint-Nazaire Cedex, France
ABSTRACT: The understanding of the mechanisms responsible for internal erosion of soils is in the early stages of evolution and it is apparent they depend on different parameters. Faced with such complexity, internal erosion initiation and development criteria found in the literature are directly dependent on the structure studied and are therefore diverse. Laboratory recreations of the processes are necessary to identify specific mechanisms for the initiation of the migration of particles. With this intention a parametric study on sand/clay samples was developed using an experimental device consists of three modified triaxial cells which allow controlling the sample confinement, preventing any flow around the sides of the sample and allow deformations of samples. The detection of erosion of particles is performed by an optical sensor. The first tests carried out show good repeatability and the validity of the experimental procedure. Different aspects of the initiation of internal erosion are clarified: the critical hydraulic gradient at which internal erosion initiates is shown to depend on the clay content and the filter pore opening size. If the clay content is low, the erosion of sand particles is induced and finally the skeleton of the sample is broken down.
1 INTRODUCTION
The presence of water in earth structures such as dams and dykes may cause damage by three different mech-anisms; sliding, overtopping and internal erosion. Internal erosion appears to be one of the main causes of failures of dams. Among the 11,192 dams surveyed by Foster et al (2000), 136 had failed or experienced some damage. These are divided up as 5.5% for sliding, 46% for internal erosion and 48% for overtopping.
Internal erosion is due to the transport and migra-tion under the acmigra-tion of flow, of some particles constituting the structure. Improvements in the under-standing of internal erosion mechanisms are hindered by their complexity and detection difficulties. When internal erosion occurs the hydraulic and mechanical characteristics of the soil are altered. The material per-meability, for instance may undergo sharp changes which may cause loss of water tightness or lead to increases in pore pressure. The migration of particles may also be prejudicial to the stability of the structure. Internal erosion mechanisms are complex and involve many parameters some of which are coupled. Laboratory testing to identify specific mechanisms are easier to carry out than monitoring full scale struc-tures and allow for differences in interpretation within a same test campaign (Monnet, 1998; Skempton & Brogan, 1994). The two main phenomena responsible for migration of particles in soils which are not cracked are backwards erosion and suffusion. In backwards erosion particles are detached from the downstream
surface by the seepage forces in the soil. In suffusion the process is similar but the coarse particles form a matrix and erosion is only of the finer particles in the pore space between the larger particles.
Different criteria to assess initiation and develop-ment of internal erosion are proposed in the literature. The different approaches mostly rest on the mate-rial particle size analysis or on the estimation of the erosion critical hydraulic gradient. These are mostly determined for cohesionless soils.
On the assumption that bigger grains can hinder the erosion of smaller grains in the internal erosion pro-cess, Kenney and Lau (1985) have developed a method based on the shape of the coarse or fine low-content grading curve which has been validated for both up and down flows in sand-gravel soils. Porosity and soil confinement, however, are not considered in the gran-ulometric approach and the method does not apply to clay soils.
In order to characterize internal erosion initiation, many authors have developed some expressions of the critical hydraulic gradient. Some of them are strongly dependent on the specific configuration stud-ied and therefore, cannot be applstud-ied generally. Regard-ing cohesive soils, Khilar et al (1985) propose an expression of the erosion critical gradient as a func-tion of the hydraulic shear stress (τc), of the intrinsic
permeability and of the porosity. The difficulty lies in the determination of τc which is dependent upon
both clay mineralogy and interstitial fluid properties (Arulanandan & Perry, 1983). For example, Reddi et al
(2000) have developed an expression of the shear stress τ(generated by flows within the soil porous system) for cohesive soils:
with
P/ L: pressure gradient (kN/m3),
K: intrinsic permeability (m2),
n: porosity.
The criteria for initiation of internal erosion do not consider adequately the hydraulics/mechanics cou-pling and the simultaneous influence and interactions of the main parameters (porosity, grain size, confin-ing pressure, hydraulic gradient). The great number of parameters affecting the different phenomena shows the importance of taking experimental precautions.
Because of difficulties in testing and to save time most authors have conducted tests using rigid cell per-meameters (Lafleur, 1999; Tomlinson & Vaid, 2000; Reddi et al 2000). Drawbacks come from the con-finement characteristics which are uniaxial and from the existence of potential leakage flows between the sample and the cell. In order to reduce such flows, a rubber like diaphragm has been introduced between the rigid cell and the sample compacted within the cell (Kenney & Lau, 1985). It follows from this that the cell should preferably consists of a supple wall to prevent leakage and erosion of the sides of the sample on the one hand, and to control the sample confine-ment which affects soil structure, on the other hand. Some authors (Tomlinson & Vaid, 2000; Hameiri & Fannin, 2002) have tested samples consisting of glass spheres for ease of satisfying test repeatability. They, however, cannot account for cohesive soils and grain angularities. Yet, their employment capabilities make it possible to anticipate satisfactory results as to their use for phenomenological tests.
The use of naturally heterogeneous and specific samples confronts us with the problem of the gener-alization of the results and test repeatability. Conse-quently, using reconstituted samples (Reddi & Bonala, 1997) appears to be a satisfactory way to represent natural cohesive soils while satisfying sample prepa-ration repeatability (homogenization is achieved by mixing before consolidation). So as to prevent lique-faction (zero effective stress condition) and identify the actions of both suffusion and backwards erosion more efficiently, samples must be subjected to down-flows. Grain entrainment is increased when both the flowrate and the external stress grow (Papamichos et al. 2001). Moreover, Tomlinson & Vaid (2000) have underlined that the influence of the pressure gradient increases velocity. The size of the opening of the filter used to support the sample and its thickness influence the erosion of particles in the soil and must be consid-ered in designing the tests (Lafleur, 1999). Therefore,
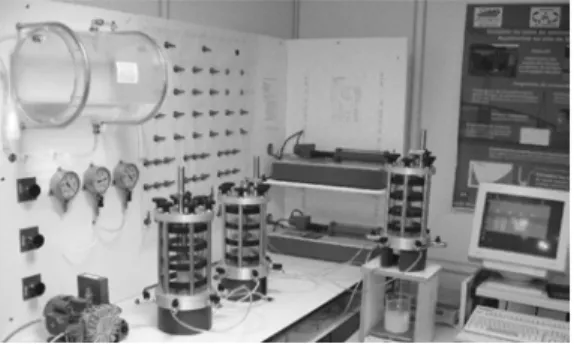
Figure 1. Photograph of the experimental device.
testing different filter equivalent opening sizes and thicknesses is essential. Considering the duration of the tests, automation is advisable.
2 EXPERIMENTAL DEVICE 2.1 Description
A parametric study started in GeM (Saint-Nazaire, France) to provide a new data on the effect on internal erosion is being undertaken with a new experimental device.
The device consists of modified triaxial cells cou-pled to two pressure/volume controllers (GDS), placed in a temperature-controlled chamber (20◦C). Three tri-axial cells can be used simultaneously for the best possible management of the test duration. The satura-tion, consolidasatura-tion, the hydraulic and the mechanical tests are carried out inside the same cell without removing the confining pressure to avoid disturbances on the samples (Figure 1).
Triaxial cells have been modified to permit the flow in the samples while limiting head losses and to discharge fine particles washed away by the process without clogging the drainage system.
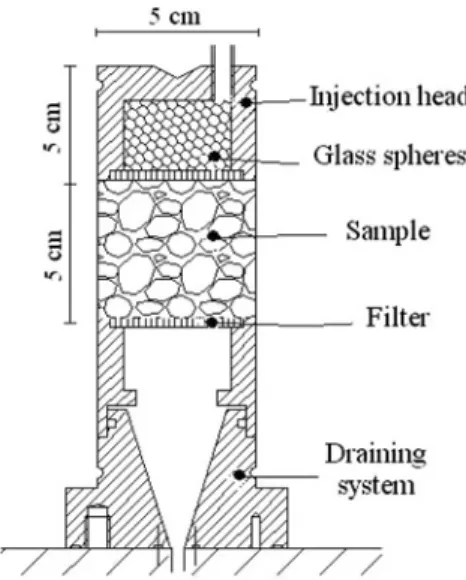
The injection head at the top of the sample consists of a 22 mm glass sphere layer to diffuse the fluid on the sample uniformly. At the bottom of the sample, the funnel-shaped draining system is specially designed to avoid clogging or the formation of a layer of particles within the system. This draining system makes it pos-sible to use different filters, which can be either rigid or geotextile with openings ranging between 0.001 mm to 8 mm and a maximum thickness of 17 mm (Figure 2). The hydraulic system consists of different elements generating pressures and suctions, which can operate on the three triaxial cells simultaneously. The GDS is used to inject up to 200 cm3of statically or
dynami-cally pressurized fluid with a resolution of 1 kPa and 1 mm3. Three pressure regulators for the triaxial cells are connected to air/water interface cylinders. These pressure regulators are used to generate and maintain
Figure 2. The injection head and the draining system.
Figure 3. Triaxial cell and the effluent tank.
constant pressures. The maximum pressure is 600 kPa with a maximum flow-rate of 74 mm3/s.
In order to detect the initiation of internal erosion point and real-time measurements are carried out using an optical sensor. Placed on the transparent pipe con-necting the triaxial cell to the effluent tank, it measures the transparency of the fluid coming through the pipe. Thanks to a preliminary calibration, it possible to find a relationship between transparency and the effluent solid contents (Figure 3).
Table 1. Loire sand characteristics.
Grain size Frequency
(mm) (% finer) 1 100 0.5 60 0.4 45 0.2 25 0.1 4 0.08 0 Uniformity coefficient 3.125 Volumic weight of grains (kN/m3) 26
Table 2. Kaolinite characteristics.
Grain size Frequency
(mm) (% finer) 0.060 100 0.010 94 0.005 80 0.002 47 0.001 18 Liquid limit. wl (%) 55 Plastic limit. wp (%) 22 Volumic weight of grains (kN/m3) 27
Table 3. Bentonite characteristics.
Grain size Frequency
(mm) (% finer) 0.010 98 0.005 89 0.001 76 0.0002 60 Liquid limit. wl (%) 440 Plastic limit. wp (%) 60 Volumic weight of grains (kN/m3) 27.6
The data acquisition is performed automatically by a computer.
2.2 Test procedure
The cohesive soil samples are reconstituted using washed Loire sand (Table 1) and two different types of clay: kaolinite (Table 2) and bentonite (Table 3).
The preparation of cohesive samples is divided into three steps:
– First, preparation and installation: The repeatability of the preparation is determined by the following procedure. The sand is first mixed for 3 minutes at a water content of 8%. While mixing contin-ues, dry powder clay is progressively added and
mixing is then carried on during 10 minutes. This method has been validated through confirmation of the size distribution homogeneity achieved after mixing (Bendahmane, 2002).
The installation of the sample inside the cell requires preliminary forming using a 50 mm diam-eter and 50 mm high mould under the action of two pistons until required dry density is reached. – Second, saturation: This phase begins when a
light confinement pressure is applied to prevent any leakage and erosion between the sample and the membrane. Saturation with distilled water is then slowly completed (24 hours) to prevent small particles from migrating.
– Third, consolidation: The sample is consolidated at 200 kPa for 24 hours or longer depending on clay percentage and properties of sample.
3 TESTS AND ANALYSIS 3.1 Comparison and validation tests
The validation of tests is carried out by reproducing an experiment described by Kenney et al (1992). The test chosen consists in testing samples made of sand and bentonite with a bentonite/sand weight ratio of 8%. The device used by Kenney is a rigid cell permeameter with an axial consolidation of 70 kPa, a hydraulic gra-dient of 15 m/m and distilled water as fluid. The sample dimensions are 50 mm2for the section and 25 to 30 mm
for the height. The hydraulic permeability measured ranges between 2.1× 10⁻¹⁰ to 2.2× 10⁻¹⁰m/s. The samples used for the validation have been reconstituted in the same sand/bentonite proportions and with an identical sand size distribution. The permeability mea-sured on three different samples with the new device is near to 2.37× 10⁻¹⁰m/s which gives good agreement between the results obtained by tests in the modified triaxial cell and Kenney et al (1992).
3.2 Results and discussion
The tests were performed on sand kaolinite samples with between 10% and 30% of kaolinite. The mould-ing water content of 8% was used, which corresponds to a compacted dry unit weight of 17 kN/m3. The
con-finement pressure is fixed at 200 kPa, that represents a soil sample a 10 m depth. The water pressure is applied with a constant hydraulic gradient. Two filter opening sizes were used: 4 mm to study the migration of all par-ticles (sand and kaolinite), and 0.08 mm to analyze the behavior of clay particles only. The parametric study is summarized in Table 4.
3.2.1 Test for 10% of kaolinite
For 0.08 mm filter opening size and 4 m/m applied hydraulic gradient (sample 23) no internal erosion
Table 4. Performed tests.
kaolinite Filter i n0 Sample (%) (mm) (m/m) (·) 23 10 0.08 4 0.33 31A 10 0.08 27 0.33 29B 10 4 2 0.33 27 10 4 4 0.33 47 10 4 8 0.33 36A 10 4 27 0.33 20 30 0.08 32 0.30 19 30 0.08 110 0.30 14 30 4 44 0.30 17 30 4 48 0.30 16 30 4 92 0.30 21 30 4 168 0.30 0.00 0.10 0.20 0.30 0.40 0.50 0.60 0 100 200 300 400 Time (s)
Sample 31A, i=27 m/m Sample 23, i=4 m/m
Concentration (mg/cm
3)
Figure 4. Evolution of instantaneous concentration of effluent.
appears. With a 27 m/m hydraulic gradient (sample 31A), migration of clay particles appears. These evolve to give high instantaneous solid concentrations of the effluent (figure 4). These data can be analyzed to obtain a significant parameter which is the erosion rate qs(t) (eroded mass per second or solid flow rate).
with :
C(t): Concentration ; qwi(t): Fluid flow rate.
For a 4 mm filter opening size, a hydraulic gradient of i= 2 m/m results in no particles migration observed for sample 29B whereas, a gradient of i= 4 m/m induces a little migration of clay particles (figure 6a, sample 27). A gradient of i= 8 m/m generates a strong clay migration (sample 47).
An important migration of particles under a high hydraulic gradient (i= 27 m/m) induces a drastic ero-sion rate (Figure 6b), the optical sensor reaches thus the maximum of signal (corresponding to 6 mg/s). This important erosion is accompanied by a struc-tural modification on the sample base (migration of
0 0.05 0.1 0.15 0.2 0.25 0.3 0 100 200 300 400 Time (s) Sample 31A, i = 27 m/m Sample 23, i = 4 m/m Erosion rate (mg/s)
Figure 5. Erosion rate with 0.08 mm filter and 10% kaoli-nite (samples 31 A, 23). 0 0.005 0.01 0.015 0.02 0.025 0.03 0.035 0.04 0.045 0.05 0 50 100 150 200 250 300 350 400 Time (s) Sample 27, i = 4 m/m Sample 29B, i = 2 m/m Erosion rate (mg/s) (a)
Figure 6a. Erosion rate with 4 mm filter and 10% kaolinite (low gradient, samples 27, 29B).
0 1 2 3 4 5 6 7 0 50 100 150 200 250 300 350 400 Time (s) Sample 36A, i = 27m/m Sample 47, i = 8m/m Erosion rate (mg/s) (b)
Figure 6b. Erosion rate with 4 mm filter and 10% kaolinite (high gradient, samples 36 A, 47).
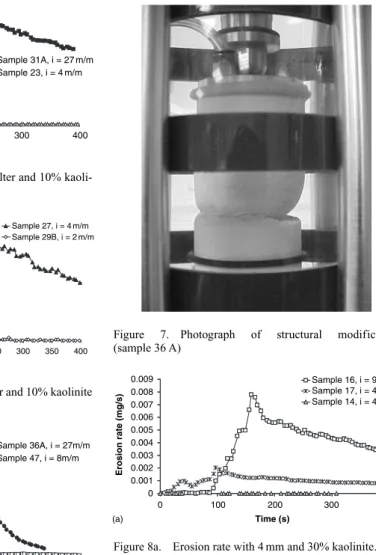
sand and clay particles) and finally generates collapses (Figure 7).
3.2.2 Test for 30% of kaolinite
The same influence of the hydraulic gradient and the filter on internal erosion is observed on the samples with 30% of kaolinite. No erosion with a 0.08 mm filter opening size is observed with a hydraulic gradient up to 110 (samples 19, 20). Moreover, with a 4 mm filter opening size, a very small rate (figure 8a) of erosion is observed up to 92 m/m hydraulic gradient, whereas a very high hydraulic gradient (168 m/m) generates significant clay erosion (figure 8b).
Figure 7. Photograph of structural modification (sample 36 A) 0 0.001 0.002 0.003 0.004 0.005 0.006 0.007 0.008 0.009 0 100 200 300 400 Time (s) Sample 16, i = 92 m/m Sample 17, i = 48 m/m Sample 14, i = 44 m/m Erosion rate (mg/s) (a)
Figure 8a. Erosion rate with 4 mm and 30% kaolinite.
0 0.5 1 1.5 2 2.5 3 3.5 4 4.5 5 0 100 200 300 400 Time (s) Sample 21, i = 168 m/m Erosion rate (mg/s) (b)
Figure 8b. Erosion rate with 4 mm and 30% kaolinite (very high gradient).
3.2.3 Synthesis of tests results
The results of tests performed underline very different magnitudes of erosion rate, with some tests showing no erosion (qs<1µg/s) and some other tests
0 2 4 6 8 10 12 0 0,5 1 1,5 2 τ(N/m2)
Maximum solid content
(mg/cm
3)
30% of Kaolinite 10% of Kaolinite figure 10
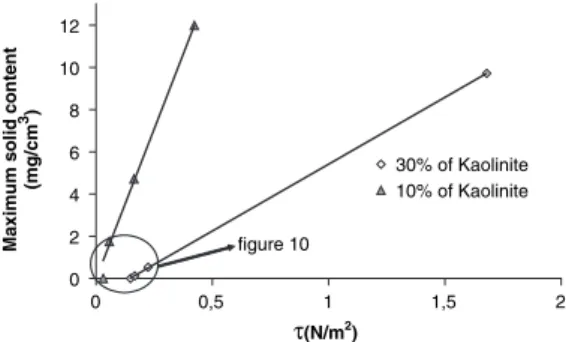
Figure 9. Maximum solid content versus hydraulic shear stress.
Figure 10. Maximum solid content versus hydraulic shear stress (detail).
tests show moderate rates of erosion. The clay fraction appears as a strong influence for soil erodibility. The performed tests tend to underline that for 10% kaolin-ite samples the erosion rate is about two times higher than for 30% kaolinite samples. Erosion rate increases with hydraulic gradient from moderate erosion (above a certain gradient value, strongly depending on gran-ulometry and filter) to high erosion. With 4 mm filter opening size this critical gradient is about 3 m/m for 10% of kaolinite and 45 m/m for 30% of kaolinite. With 0.08 mm filter this critical gradient seems to reach 2 or 3 times the precedent values. Consequently the filter opening size is an important parameter to qualify erosion rate, in complement with the hydraulic gradient.
From the different samples tested with 4 mm filter opening size and with a hydraulic gradient between 2 to 168 m/m, it is possible to represent the maximum solid content versus the hydraulic shear stress, calcu-lated with equation (1). This representation is a linear function (Figure. 9). The intersection between this line and the abscissa axe shows a critical hydraulic shear stress τcr, respectively equal to 0.03 and 0.15 N/m2for
10% and 30% of kaolinite (Figure. 10).
The experimental data are fairly fitted (4 points, correlation coefficient R2= 0.99) by linear function.
The equations 3 and 4 are respectively obtained for 10% and 30% of kaolinite content:
These formulas deduced from parametric study on sand/clay samples allow determining the maximum solid content from the hydraulic shear stress, but addi-tional investigation is required to confirm the relation between the solid content and hydraulic shear stress.
With the equation proposed by Lane (Ojha et al., 2003):
we obtain, a good agreement for 10% of kaolinite (τcr= 0.037 N/m2). However, for 30% of kaolinite the
result is completely different (τcr= 0.023 N/m2).
These results underline the necessity of a more complete study of the kaolinite percentage influence.
4 CONCLUSIONS
Internal erosion can be considered as one of the main cause of hydraulic earth structure instabilities. Internal erosion mechanisms are complex and require labora-tory testing to be characterized. The objective of this paper is to present the prototype and the methodology developed by the GeM Institute for the behavior study of sand-clay samples subjected to internal erosion mechanisms.
The experimental device can be used to saturate and consolidate reconstituted sand/clay samples. The tri-axial cells used for this parametric study have been modified to let the flow comes through up to the sample.
The first tests completed allow comparison between the tests carried out with the modified triaxial cells and results obtain by Kenney et al (1992) on sand/bentonite. This comparison demonstrates the good repeatability of the tests and validates the exper-imental procedure. On the other hand, we have studied the mechanisms which induce the internal erosion for a sand/kaolinite sample.
All tests are performed with sand/clay sample with 10 and 30% and kaolinite for a hydraulic gradient between 2 and 168 m/m.
The results of the tests so far show that erosion of clay-sand soils begins at high seepage gradients, much higher than are present in earthfill dams and dykes. For erosion to initiate in such soils there needs to be a crack, or erosion may be possible if the soils are very poorly compacted laving large interstitial pores between the clay particles.
The internal erosion begins by a migration of fine particles to the downstream side of sample. If the quantity of eroded fine particles is important, the sam-ple structure is modified and then the transport of sand particles occurs. Finally the skeleton of sam-ple is unstable and causes the breaking down. Sand erosion can’t be characterized by the present configu-ration of our device. Further developments are needed by the mean of a mass balance included in the chain of measurements.
To extend this study, we have to carry out some com-plementary tests with different sand/clay ratio, with other sand and filter opening sizes. We intend to use the capacity of our device to take into account the effect of confining pressure on the internal erosion kinetics.
REFERENCES
Arulanandan K. & Perry E.B. 1983. Erosion in relation to fil-ter design crifil-teria in earth dams. Journal of Geotechnical
Engineering, 109(5):682–696.
Bendehmane, F. 2002. Influence de l’écoulement sur la
résis-tance des sols: étude expérimentale préliminaire. Master
report, Université de Nantes.
Foster, M. Fell, R & Spannagle, M. 2000. The statistics of embankment dam failures and accidents. Canadian
Geotechnical Journal, Vol. 37: 1000–1024.
Hameiri, A. & Fannin, R.J. 2002. A cyclic gradient ratio test device. Geotechnical Testing Journal, 25(3):266–276. Kenney, T.C & Lau, D. 1985. Internal stability of granular
filters. Canadian Geotechnical Journal, 22:215–225.
Kenney, T.C. Van Ween, W.A. Swallow, M.A & Sungaila, M.A. 1992. Hydraulic conductivity of compacted-sand mixtures. Canadian Geotechnical Journal, Vol. 29: 364–374.
Khilar, K.C., Fogler H.S., & Gray, D.H. 1985. “Model for piping-plugging in earthen structures”, Journal of
Geotechnical Engineering, 111(7):833–846.
Lafleur J. 1999. Selection of géotextiles to filter broadly graded cohesionless soils. Geotextiles and
Geomem-branes; 17:299–312.
MONNET, A. 1998. Boulance, érosion interne, renard. Les instabilités sous écoulement. Revue Française de
Géotechnique; 82:3–10.
Ojha, C.S.P., Singh, V.P. & Adrian, D.D. 2003. Determina-tion of critical head in soil piping. Journal of Hydraulic
Engineering; 129:511–518.
Papamichos, E., Vardolarkous, I., Tronvoll, J. & Skjaerstein, A. 2001.Volumetric sand production model and experiment. International Journal for Numerical and
Analytical Methods in Geomechanis; 25:789–808.
Reddi, L.N. & Bonala, M.V.S. 1997 Critical shear stress and its relationship with cohesion for sand-Kaolinite mixtures.
Canadian Geotechnical Journal; 34:26–33.
Reddi, L.N., Lee, I. & Bonala, M.V.S. 2000.Comparison of internal and surface erosion using flow pump test on a sand-kaolinite mixture. Geotechnical Testing Journal; 23(1):116–122.
Skempton, A.W. & Brogan, J.M. 1994. Experiments on piping in sandy gravels. Géotechnique; 44.(3):440–460. Tomlinson, S.S. & Vaid, Y.P. 2000. Seepage forces and
confining pressure effects on piping erosion. Canadian