HAL Id: hal-02369886
https://hal.univ-lorraine.fr/hal-02369886
Submitted on 19 Nov 2019
HAL is a multi-disciplinary open access
archive for the deposit and dissemination of
sci-entific research documents, whether they are
pub-lished or not. The documents may come from
teaching and research institutions in France or
abroad, or from public or private research centers.
L’archive ouverte pluridisciplinaire HAL, est
destinée au dépôt et à la diffusion de documents
scientifiques de niveau recherche, publiés ou non,
émanant des établissements d’enseignement et de
recherche français ou étrangers, des laboratoires
publics ou privés.
Christian France-Lanord, Volkhard Spiess, Adam Klauss, R.R. Adhikari, S.K.
Adhikari, J.-J. Bahk, A.T. Baxter, J.W. Cruz, S.K. Das, P. Dekens, et al.
To cite this version:
Christian France-Lanord, Volkhard Spiess, Adam Klauss, R.R. Adhikari, S.K. Adhikari, et al.. Site
U1452. Proceedings of the International Ocean Discovery Program, International Ocean Discovery
Program, 2016, �10.14379/iodp.proc.354.106.2016�. �hal-02369886�
doi:10.14379/iodp.proc.354.106.2016
Site U1452
1C. France-Lanord, V. Spiess, A. Klaus, R.R. Adhikari, S.K. Adhikari, J.-J. Bahk, A.T. Baxter, J.W. Cruz, S.K. Das, P. Dekens, W. Duleba, L.R. Fox, A. Galy, V. Galy, J. Ge, J.D. Gleason, B.R. Gyawali, P. Huyghe, G. Jia, H. Lantzsch, M.C. Manoj, Y. Martos Martin, L. Meynadier, Y.M.R. Najman, A. Nakajima, C. Ponton, B.T. Reilly, K.G. Rogers, J.F. Savian, T. Schwenk, P.A. Selkin, M.E. Weber, T. Williams, and K. Yoshida2
Keywords: International Ocean Discovery Program, IODP, Expedition 354, JOIDES Resolution, Site U1452, Bengal Fan
1France-Lanord, C., Spiess, V., Klaus, A., Adhikari, R.R., Adhikari, S.K., Bahk, J.-J., Baxter, A.T., Cruz, J.W., Das, S.K., Dekens, P., Duleba, W., Fox, L.R., Galy, A., Galy, V., Ge, J., Gleason, J.D.,
Gyawali, B.R., Huyghe, P., Jia, G., Lantzsch, H., Manoj, M.C., Martos Martin, Y., Meynadier, L., Najman, Y.M.R., Nakajima, A., Ponton, C., Reilly, B.T., Rogers, K.G., Savian, J.F., Schwenk, T., Selkin, P.A., Weber, M.E., Williams, T., and Yoshida, K., 2016. Site U1452. In France-Lanord, C., Spiess, V., Klaus, A., Schwenk, T., and the Expedition 354 Scientists, Bengal Fan.
Proceed-Contents 1 Site summary
2 Background and objectives 4 Operations
6 Lithostratigraphy 13 Biostratigraphy 14 Paleomagnetism
17 Geochemistry and microbiology 21 Physical properties
24 Downhole measurements 24 Stratigraphic synthesis 27 References
Site summary
Site U1452 (proposed Site MBF-5A) is in the center of our seven-site transect. It is located in a relatively flat environment with a smooth morphology. Topographic expressions of channels are ab-sent in the vicinity of the site. The seismic profile at this site reveals a prominent, >20 km wide, and up to 40 m thick levee; the top is only at ~5 m below the seafloor.
At this site, we focused on coring the upper levee to provide a detailed record of this type of depositional system. Two holes were cored through this levee to allow high-resolution sedimentological, geophysical, geochemical, and micropaleontological investigations. A single mudline core from Hole U1452A was devoted to detailed study of the hemipelagic deposition during the last glacial cycle and to the Toba ash. Hole U1452B was cored to 217.7 m drilling depth below seafloor (DSF) for the study of the Upper Pleistocene section. Finally, Hole U1452C was cored to 41.3 m DSF to provide a more complete record of the levee and to allow more extensive sampling.
Principal results
Coring at Site U1452 contributed to the Pleistocene transect of seven sites, which was one of the primary Expedition 354 objec-tives. The levee sequence recovered will allow detailed integrated sedimentological and geochemical investigations. On such rapidly accumulated sediments, δ18O measurements on planktonic
fora-minifers are expected to provide the high-resolution biostratigraphy and paleoclimate conditions (i.e., glacial to interglacial) necessary to constrain potential evolution of erosion and transport processes. This record is also essential for the understanding of channel and levee formation. Site U1452 cored a fine-grained levee, such as the one cored deeper in Site U1449, but also penetrated the coarser basal unit. Physical properties seem to indicate progradation and the transition from sand deposition, through erosion, to levee con-struction.
The successful interpretation of seismic facies types with re-spect to grain size allowed coring strategies to target specific hori-zons. Hemipelagic layers, after being identified in several previous sites, were used to establish a preliminary Pleistocene seismic stra-tigraphy. Also, coring that targeted these layers was successful and provided an improved chronology even when half-length advanced piston corer (HLAPC) coring alternated with short 4.8 m advances without coring.
A hemipelagic unit deposited from ~0.8 to ~1.2 Ma between 166 and 190 m DSF marks a period when turbiditic deposition was diverted to other parts of the fan and only clays were supplied to this area; this history was also observed at other sites to the east (Sites U1449–U1451). Fan sedimentation intensified between 800 and 300 ka, as represented by sheeted sands and the levee. These sheeted sands and the levee grew by 100 m in 500 ky, equivalent to an aver-age sedimentation rate of 20 cm/ky. The end of this intense period of fan sedimentation at 300 ka is constrained by the basal age of the surficial hemipelagic unit.
Operations
In Hole U1452A, a single advanced piston corer (APC) mudline core (1H) recovered 8 m of sediments, including the mudline.
In Hole U1452B, we completed oriented APC coring to 41.4 m DSF and continued coring with the HLAPC system. From 71.1 to 142.4 m DSF, we alternated 4.7 m long HLAPC cores with 4.8 m in-tervals drilled without coring. In this interval, seven HLAPC cores (14F–26F) penetrated 32.9 m and recovered 21.41 m of core (65%). The eight 4.8 m advances without coring penetrated 38.4 m, with nearly continuous HLAPC coring to 217.7 m DSF. Nine 4.8 m ad-vances without coring were intercalated with cores in units pre-dicted to be sandy. Overall recovery was 79% for Hole U1452B.
Hole U1452C was continuously cored from the seafloor to 41.3 m DSF to obtain a more complete record of the uppermost levee Proceedings of the International Ocean Discovery Program Volume 354
sequence to the sand layer at the base of the levee. All APC cores were oriented, and core recovery in this hole was 81%.
Lithostratigraphy
Drilling at Site U1452 targeted a Pleistocene-aged levee identi-fied in the pre-expedition seismic data. The lithology and structures of recovered sediments indicate the initiation and cessation of an entire levee sequence (8–40 m DSF) was captured, as well as under-lying prelevee sand sheets (40–167 m DSF) and calcareous clays (>167 m DSF). The prelevee sand sheets mark the initiation of tur-biditic deposition at this location prior to the building of the levee. These turbiditic sand sheets are dominated by mica- and quartz-rich sand characteristic of sediments found in Himalayan rivers. The sand was likely deposited as interlevee sheet flows originating from a nearby channel. The hemipelagic calcareous clay unit ex-tends to 190 m DSF and overlies older interlevee sand-rich turbi-dites.
Sediments at this site document the channel system shifting across the fan. Initially, proximal channel sand deposition was re-duced and succeeded by increased deposition of hemipelagic nannofossil-rich calcareous clays. Overlying this calcareous inter-val, a very thick (~160 m) section of levee deposits (i.e., sand and mud turbidites) reflects activation of a nearby channel and the asso-ciated levee building that forms the top of the section. The levee is overlain by a relatively thin unit of bioturbated calcareous clay, rep-resenting the end of proximal channel activity and in turn a de-crease in detrital input. This surficial calcareous clay unit at the top of the levee contains a glassy volcanic ash layer likely from the Toba eruption that occurred at ~75 ka.
Biostratigraphy
Biostratigraphic control at Site U1452 is limited, but four tie points were observed that help constrain levee development during the Pleistocene. Although the foraminiferal biomarker Globorotalia tosaensis (0.61 Ma) was found in Holes U1452B and U1452C (at 8.97 and 23.29 m core depth below seafloor [CSF-A], respectively), its first occurrence (FO) is at a shallower depth than the nannofossil biomarkers Emiliania huxleyi (0.29 Ma) and Pseudoemiliania la-cunosa (0.44 Ma), indicating that this foraminifer was either re-worked or has a longer range in the Indian Ocean. Cores 345-U1452B-33F through 37F are dominated by hemipelagic calcareous clay, are abundant in nannofossils, and contain abundant to barren foraminifers. Interestingly, fragmentation of planktonic foramini-fers was higher in the hemipelagic sediments than in the turbiditic sediments. The nannofossil biomarkers agree well with the mag-netic polarity reversals found at Site U1452.
Paleomagnetism
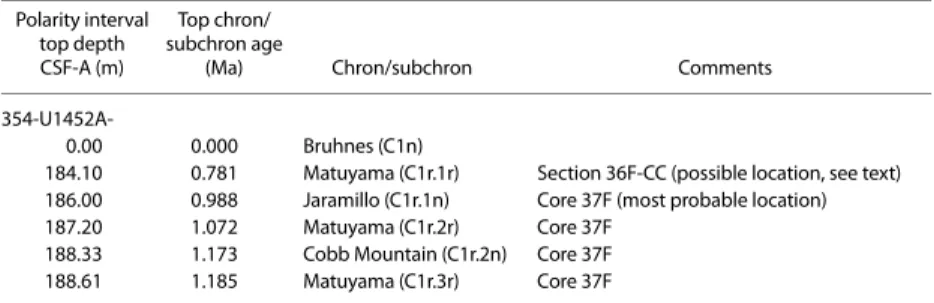
As observed in the upper parts of Sites U1449–U1451, Site U1452 sediments record the Brunhes/Matuyama boundary (184.10 m CSF-A) and both boundaries of the Jaramillo and Cobb Mountain Subchrons (186.00–187.20 and 188.33–188.61 m CSF-A, respec-tively). Relative to the seafloor, these are the deepest instances of these polarity transitions identified on our transect to date. Also similar to Sites U1449–U1451, the Jaramillo and Cobb Mountain Subchrons occur at Site U1452 within an interval of hemipelagic sedimentation. The Brunhes/Matuyama boundary is associated with an ash layer, believed to be from Toba. Microtektites, likely from the Australasian Microtektite Event dated at 790 ka, were found deeper than the Brunhes/Matuyama boundary, further sup-porting the identification of this polarity transition.
Physical properties
Physical property data were acquired on all cores from Holes U1452A and U1452B, including density, magnetic susceptibility, P-wave velocity, natural gamma radiation (NGR), and thermal con-ductivity. Physical property data are mostly of good quality and re-flect lithologic variations. Using the principal lithologic name from the core description to assign five lithologies (sand = ~46 m, silt = ~27 m, clay = ~33 m, calcareous clay = ~26 m, and volcanic ash), we calculated their minimum, maximum, and average physical proper-ties. Average wet bulk densities are rather uniform for terrigenous sediment (sand, silt, and clay), ranging from 1.89 to 2.03 g/cm3,
cal-careous clay has lower average densities (1.72 g/cm3), and volcanic
ash has substantially lower wet bulk densities (1.54 g/cm3). Average
P-wave velocities are highest in sand (1697 m/s) and lowest in clay and in calcareous clay (~1525 m/s). Average magnetic susceptibili-ties are also highest in sand (107 × 10–5 SI), followed by silt (80 ×
10−5 SI) and clay (58 × 10–5 SI). The lowest values occur in
calcare-ous clay (22 × 10–5 SI). Average NGR is high throughout the
terri-genous components sand, silt, and clay (around 65 counts/s) and lower in calcareous clay (45 counts/s). Average thermal conductivity is highest in silt (1.63 W/[m·K]) and lowest in calcareous clay (1.18 W/[m·K]).
Geochemistry
Detailed pore water measurements distinguish two hydrologic units based on sulfate, phosphate, silica, magnesium, potassium, calcium, and alkalinity content. Carbonate contents of turbiditic sediments vary from 0.6 to 7.4 wt% CaCO3. Similar carbonate
con-tents were measured in Pliocene and Pleistocene turbiditic sedi-ments recovered at Sites U1449–U1451. A 4.6 m thick hemipelagic interval at 184 m CSF-A was analyzed at high resolution with X-ray fluorescence (XRF) scanning. It reveals that carbonate content var-ies between 18 and 60 wt% with an average of ~40 wt%. Sr/Ca ratio and carbonate content variations suggest a single binary mixing be-tween marine biogenic carbonate and a silicate end-member.
Background and objectives
Site U1452 (see Figures F3, F4, and F8 in the Expedition 354 summary chapter [France-Lanord et al., 2016d]) is located in the center of the seven-site transect drilled during Expedition 354 to study Pleistocene fan architecture and evolution of the Middle Ben-gal Fan at 8°N. In combination, these sites will provide a complete inventory of Pleistocene fan architecture and evolution in the 300 km long central segment of the Bengal Fan. Seismic data along the transect reveal characteristic structures and patterns of fan depo-sition related to channel-levee systems (Schwenk and Spiess, 2009). The objectives of this site were to provide characteristics of lithologies building the structural and depositional elements of the fan and to estimate accumulation rates related to different depo-sitional processes. Combined with other transect sites, this site should document depocenter migration and quantify overall sedi-ment delivery to 8°N since the Pliocene.
Site U1452 is located in a relatively flat environment with a smooth morphology. Topographic expressions of channels are ab-sent in the vicinity (FigureF1), but an abandoned channel crosses the seismic profile ~50 km west near Site U1453. This channel strikes northeast–southwest and reaches as close as 20 km to Site U1452; thus, spillover material from this channel may have reached the site and formed distal levee deposits.
The most striking feature of the seismic profile across Site U1452 (Figure F2) is a prominent levee >20 km wide at a shallow
Figure F1. Bathymetric and track chart, Site U1452. Projection is UTM Zone 45N. Multibeam bathymetry was acquired during R/V Sonne Cruises SO125 and SO188. Blue line = seismic Line SO125-GeoB97-027 with common depth point annotation. Contour interval is 20 m. A portion of the seismic profile is shown in Figure F2 (red line, 22 km).
N Site U1452 Site U1453 3500 3540 3580 3620 3660 3700 3740 3780 3820 W ater depth (m) 4 0 0 0 5 0 0 0 6 0 0 0 7 0 0 0 8 0 0 0 9 0 0 0 1 0 0 0 0 1 10 0 0 3 7 480000 490000 500000 510000 520000 530000 540000 550000 560000 0 0 0 8°15' N 8°0' 7°45' 0 0 37 86°45'E 87°0' 87°15' 87°30' X/Y: Meters 855000 865000 875000 885000 895000 905000 (m) 25000 0 5000 10000 15000 20000
Figure F2. Seismic Line SO125-GeoB97-027 across Site U1452. Total depth is 217.7 m DSF, assuming an average velocity of 1640 m/s.
5000 0 10000 15000 20000 4.850 4.900 4.950 5.000 5.050 5.100 5.150 5.200 5.250 Site U1452 Offset (m): Tw o-w ay tr av eltime (s)
subbottom depth. At the site, positioned just west of the buried channel axis, the levee is 40 ms two-way traveltime (TWT) thick. A succession of mostly subparallel sedimentary units below the levee were observed, some of which represent levee facies and geometry. Other units of higher amplitude may represent coarser formations, in particular those with irregular reflector morphology. At the base of the hole, several stacked levee units were expected.
At this site, we focused on coring the upper levee to provide a detailed record of this type of depositional system. Two holes were cored through this levee to allow high-resolution sedimentological, geochemical, and micropaleontological investigations. In addition, sediments collected at Site U1452 will be used to document Pleisto-cene erosion rates and processes, as well as links between erosion and climate.
Operations
Three holes were cored at Site U1452. Hole U1452A recovered a single mudline core for high-resolution studies around the Toba ash layer. Hole U1452B penetrated a total of 217.7 m; 174.5 m of this interval was cored, and 140.33 m of core was recovered (64%). Hole U1452C was continuously cored from the seafloor to 41.3 m DSF to obtain a more complete sampling of the uppermost levee sequence. All cores, penetration depths, core recovery, and time recovered on deck are presented in Table T1.
Hole U1452A
After a 29 nmi transit, we arrived at Site U1452 at 1700 h on 11 March 2015, prepared an APC/extended core barrel (XCB) bottom-hole assembly (BHA), and lowered it to the seafloor. After lowering the drill string to the seafloor, we attempted to take the mudline APC core in Hole U1452A at 0315 h on 12 March, but the system would not fire (shear pins did not fail). After recovering the APC
core barrel and diagnosing/fixing the problem, we redeployed the APC core barrel and started coring Hole U1452A at 0540 h on 12 March. Core 1H penetrated 8 m. This core is dedicated to high-res-olution studies around the Toba ash layer, so it was only run through the whole-round logging systems and then stored for postexpedi-tion splitting and sampling. Nonmagnetic hardware (drill collar and core barrels) was used for all APC and HLAPC cores at Site U1452.
Hole U1452B
We then offset the ship 20 m east and started coring Hole U1452B at 0700 h on 12 March 2015. Cores 1H–5H penetrated to 41.4 m DSF and recovered 33.51 m of sediment (80%). All of these cores were oriented. Core 5H was a partial stroke and was inferred to have only penetrated ~4.7 m based on the amount of competent material recovered in the top of the core. We then switched to the HLAPC system. Cores 6F–12F penetrated from 41.4 to 71.1 m DSF (29.7 m) and recovered 23.32 m of core (79%). Based on evidence on the outside of the core barrel (rusty steel scrubbed clean by the for-mation), Core 6F only penetrated 1.5 m into the formation, so it was advanced this amount; all other cores were advanced 4.7 m. From 71.1 to 142.4 m DSF, we started alternating 4.7 m long HLAPC cores with 4.8 m intervals drilled without coring. In this interval, seven HLAPC cores (14F–26F) penetrated 32.9 m and recovered 21.41 m of core (65%). The eight 4.8 m advances without coring penetrated 38.4 m. Nearly continuous HLAPC coring (Cores 28F–43F, except for a single 4.8 m advance without coring) penetrated from 142.4 to 217.7 m DSF and recovered 62.49 m of core (89%). Although we had originally planned to core to 300 mbsf, we decided our primary cor-ing objectives at this site had been achieved. We pulled out of Hole U1452B, and the bit cleared the seafloor at 0030 h on 14 March. Hole U1452B penetrated a total of 217.7 m; 174.5 m of this interval was cored, and 140.33 m of core was recovered (64%). The majority of cores were partial strokes.
Table T1. Site U1452 coring summary. * = cores when sepiolite mud was circulated. † = APC cores with full stroke; all others were partial strokes. DRF = drilling depth below rig floor, mbsl = meters below sea level, DSF = drilling depth below seafloor. H = advanced piston corer, F = half-length APC, X = extended core barrel. (Continued on next page.) Download table in .csv format.
Hole U1452A Hole U1452B
Latitude: 8°0.4196′N Latitude: 8°0.4191′N
Longitude: 87°10.9001′E Longitude: 87°10.9128′E
Time on hole (days): 0.6 (13.25 h) Time on hole (days): 1.8 (42.25 h)
Seafloor (drill pipe measurement below rig floor, m DRF): 3681.5 Seafloor (drill pipe measurement below rig floor, m DRF): 3681.3 Distance between rig floor and sea level (m): 11.0 Distance between rig floor and sea level (m): 11
Water depth (drill pipe measurement from sea level, mbsl): 3670.5 Water depth (drill pipe measurement from sea level, mbsl): 3670.3 Total penetration (drilling depth below seafloor, m DSF): 8.0 Total penetration (drilling depth below seafloor, m DSF): 217.7 Total depth (drill pipe measurement from rig floor, m DRF): 3689.5 Total depth (drill pipe measurement from rig floor, m DRF): 3899 Total length of cored section (m): 8 Total length of cored section (m): 174.5
Total core recovered (m): 8.03 Total core recovered (m): 138.21
Core recovery (%): 100 Core recovery (%): 79
Drilled interval (m): 0 Drilled interval (m): 43.2
Total number of cores: 1 Total number of cores: 34
Hole U1452C
Latitude: 8°0.4088′N Longitude: 87°10.9116′E Time on hole (days): 0.8 (18.50 h)
Seafloor (drill pipe measurement below rig floor, m DRF): 3682.5 Distance between rig floor and sea level (m): 11
Water depth (drill pipe measurement from sea level, mbsl): 3671.5 Total penetration (drilling depth below seafloor, m DSF): 41.3 Total depth (drill pipe measurement from rig floor, m DRF): 3723.8 Total length of cored section (m): 41.3
Total core recovered (m): 33.43 Core recovery (%): 81 Drilled interval (m): 0 Total number of cores: 6
Core Top of cored inter-val DSF (m) Bottom of cored inter-val DSF (m) Interval cored (m) Interval ad-vanced with-out coring (m) Core recovered length (m) Curated length (m) Recovery (%) Date on deck (mm/dd/yy), time on deck UTC (h) Date on deck (mm/dd/yy), time on deck UTC + 6 (h) (ship local time) 354-U1452A-1H† 0 8.0 8.0 — 8.03 8.03 100 03/12/15 0015 03/12/15 0615 Totals: 8.0 — 8.03 100 354-U1452B-1H† 0.0 8.2 8.2 8.21 8.21 100 03/12/15 0140 03/12/15 0740 2H† 8.2 17.7 9.5 1.53 1.53 16 03/12/15 0300 03/12/15 0900 3H† 17.7 27.2 9.5 7.44 7.44 78 03/12/15 0445 03/12/15 1045 4H† 27.2 36.7 9.5 9.35 9.35 98 03/12/15 0550 03/12/15 1150 5H 36.7 41.4 4.7 6.62 6.62 141 03/12/15 0700 03/12/15 1300 6F 41.4 42.9 1.5 2.55 2.55 170 03/12/15 0820 03/12/15 1420 7F 42.9 47.6 4.7 0.06 0.06 1 03/12/15 0920 03/12/15 1520 8F 47.6 52.3 4.7 4.15 4.15 88 03/12/15 1020 03/12/15 1620 9F 52.3 57.0 4.7 2.55 2.55 54 03/12/15 1120 03/12/15 1720 10F 57.0 61.7 4.7 4.88 4.88 104 03/12/15 1225 03/12/15 1825 11F 61.7 66.4 4.7 4.86 4.86 103 03/12/15 1420 03/12/15 2020 12F 66.4 71.1 4.7 3.69 3.69 79 03/12/15 1530 03/12/15 2130 131 71.1 75.9 4.8 *****Drilled interval***** 03/12/15 1550 03/12/15 2150 14F 75.9 80.6 4.7 1.77 1.77 38 03/12/15 1640 03/12/15 2240 151 80.6 85.4 4.8 *****Drilled interval***** 03/12/15 1650 03/12/15 2250 16F 85.4 90.1 4.7 5.02 5.02 107 03/12/15 1750 03/12/15 2350 171 90.1 94.9 4.8 *****Drilled interval***** 03/12/15 1800 03/13/15 0000 18F 94.9 99.6 4.7 4.23 4.23 90 03/12/15 1855 03/13/15 0055 191 99.6 104.4 4.8 *****Drilled interval***** 03/12/15 1905 03/13/15 0105 20F 104.4 109.1 4.7 4.14 4.14 88 03/12/15 2005 03/13/15 0205 211 109.1 113.9 4.8 *****Drilled interval***** 03/12/15 2015 03/13/15 0215 22F 113.9 118.6 4.7 1.12 1.12 24 03/12/15 2115 03/13/15 0315 231 118.6 123.4 4.8 *****Drilled interval***** 03/12/15 2130 03/13/15 0330 24F 123.4 128.1 4.7 0.96 0.96 20 03/12/15 2225 03/13/15 0425 251 128.1 132.9 4.8 *****Drilled interval***** 03/12/15 2255 03/13/15 0455 26F 132.9 137.6 4.7 3.38 3.38 72 03/12/15 2345 03/13/15 0545 271 137.6 142.4 4.8 *****Drilled interval***** 03/12/15 0000 03/13/15 0600 28F 142.4 147.1 4.7 4.52 4.52 96 03/13/15 0100 03/13/15 0700 29F 147.1 151.8 4.7 4.96 4.96 106 03/13/15 0220 03/13/15 0820 30F 151.8 156.5 4.7 2.61 2.61 56 03/13/15 0335 03/13/15 0935 31F 156.5 161.2 4.7 4.24 4.24 90 03/13/15 0440 03/13/15 1040 32F 161.2 165.9 4.7 1.05 1.05 22 03/13/15 0540 03/13/15 1140 33F 165.9 170.6 4.7 5.14 5.14 109 03/13/15 0645 03/13/15 1245 34F 170.6 175.3 4.7 4.68 4.68 100 03/13/15 0805 03/13/15 1405 35F 175.3 180.0 4.7 5.03 5.03 107 03/13/15 0910 03/13/15 1510 36F 180.0 184.7 4.7 4.52 4.52 96 03/13/15 1030 03/13/15 1630 37F 184.7 189.4 4.7 4.96 4.96 106 03/13/15 1135 03/13/15 1735 38F 189.4 194.1 4.7 4.24 4.24 90 03/13/15 1235 03/13/15 1835 39F 194.1 198.8 4.7 3.49 3.49 74 03/13/15 1340 03/13/15 1940 401 198.8 203.6 4.8 *****Drilled interval***** 03/13/15 1400 03/13/15 2000 41F 203.6 208.3 4.7 4.30 4.30 91 03/13/15 1445 03/13/15 2045 42F 208.3 213.0 4.7 5.17 5.10 109 03/13/15 1550 03/13/15 2150 43F 213.0 217.7 4.7 2.79 2.79 59 03/13/15 1650 03/13/15 2250 Totals: 174.5 43.2 138.21 79 354-U1452C-1H† 0.0 7.0 7.0 7.08 7.08 101 03/13/15 2115 03/14/15 0315 2X 7.0 11.0 4.0 0.00 0.00 0 03/13/15 2235 03/14/15 0435 3H† 11.0 20.5 9.5 8.78 8.78 92 03/13/15 2350 03/14/15 0550 4H† 20.5 30.0 9.5 6.30 6.30 66 03/14/15 0115 03/14/15 0715 5H 30.0 38.5 8.5 8.48 8.48 100 03/14/15 0300 03/14/15 0900 6H 38.5 41.3 2.8 2.79 2.79 100 03/14/15 0430 03/14/15 1030 Totals: 41.3 0.0 33.43 81 Table T1 (continued).
Hole U1452C
After the ship was offset 20 m south of Hole U1452B, Hole U1452C was continuously cored from the seafloor to 41.3 m DSF to obtain a more complete sampling of the uppermost levee sequence. APC coring in Hole U1452C started at 0245 h on 14 March 2015. After a successful mudline core (1H), we used the XCB system to
core from 7.0 to 11.0 m DSF; in Hole U1452B, this interval had poor recovery and appeared to be a hard layer. Unfortunately, this core came back empty. APC coring resumed, and Cores 3H–6H ex-tended from 11.0 to 41.3 m DSF (30.3 m) and recovered 30.3 m of core (87%). All APC cores were oriented. When the last core recov-ered sand, our objective for this hole was reached (we had passed
below the targeted levee section), so we pulled out of the hole and recovered the drill string. After the bit was back on board, we se-cured the rig floor, raised the thrusters, and departed for Site U1453 at 1900 h on 14 March.
Lithostratigraphy
At Site U1452, three holes (U1452A, U1452B, and U1452C) were drilled. Hole U1452A penetrated to a maximum subbottom depth of 8.0 m DSF (cored interval: 8.0 m with 100% recovery). Hole U1452B penetrated to 217.7 m DSF (cored interval: 174.5 m with 79% recovery). Hole U1452C penetrated to 41.3 m DSF (cored inter-val: 41.3 m with 81% recovery). Hole U1452B lithostratigraphic units overlap with those in Hole U1452C from 0 to 41.3 m CSF-A. The overall dominant lithology for Site U1452 (95% of total recov-ered material) is fine sand with silt and clay, some with fining-up-ward sequences (i.e., turbidites). Two units of mottled and bioturbated calcareous clay comprise the overall minor lithology (5% of total recovered material). Additionally, Site U1452 contains two volcanic ash layers. Recovered sediments from Site U1451 are divided into five lithostratigraphic units based on lithologic and paleontological characteristics obtained through macroscopic and smear slide analyses and physical property measurements (Figures F3, F4).
Unit summaries
Summaries of individual units are presented here and in Table T2, with more detailed descriptions in the following sections.
Unit I is dominated by bioturbated and mottled nannofossil-rich calcareous clay and contains a single medium–thick bed containing silt turbidite sequences. This unit also contains a volcanic ash layer composed of fine-grained glass particles that presumably corre-sponds to the Toba volcanic eruption at 75.0 ka ± 0.9 ky that pro-duced widespread tephra deposits across the Bay of Bengal (e.g., Mark et al., 2014).
Unit II is composed of successions of mud turbidites inter-bedded with clay and silt layers of varying thicknesses that fre-quently display laminations, cross-bedding, and sharp basal layers. The stratigraphic depth of this unit corresponds to a levee identified in seismic Profile GeoB97-020/027 collected on the Bengal Fan during the R/V Sonne SO125 cruise (Schwenk and Spiess, 2009).
Unit III is dominated by fine- and coarse-grained sand; some of the sand is interbedded with thin clay beds and bioturbated nanno-fossil-rich clay.
Unit IV lithologies range from silt and clay to calcareous clay with nannofossils and foraminifers. Also present is a 6 cm thick white volcanic ash layer. Underneath, a calcareous clay layer con-taining microtektites was identified.
Unit V is divided into three parts. The upper, most dominant part consists of dark gray fine sand and clayey sand. These sands overlie a 1.8 m interval of calcareous clays with mottling. The lower part consists of silty clays and homogeneous fine sands.
Lithostratigraphic summary
Lithologic differences between siliciclastic units and variations in grain size and bed thickness reflect cycles of proximal turbidity current channel activity, including activation, flow-stripping, avul-sion, and abandonment. Sand units at the base of Hole U1452B may reflect interlevee sheet flow deposition (e.g., Curray et al., 2003) fol-lowed by cessation of proximal channel activity as represented by
increased deposition of nannofossil-rich calcareous clay. The over-lying thick interval of sand and silty sands, some with fining-upward textures, overlain by a 31.5 m interval of fine-grained turbidites cor-responds to a levee feature identified in seismic Profile GeoB97-020/027 collected on the Bengal Fan during the R/V Sonne SO125 cruise (Schwenk and Spiess, 2009). These turbidite deposits are cov-ered with a relatively thin (8.0 m) unit of dominantly calcareous clay representing a time of regional channel inactivity and reduced silici-clastic input. The uppermost calcareous clay–dominant unit con-tains a 23 cm thick bed of volcanic ash, presumably from the Toba volcanic eruption at 75.0 ka ± 0.9 ky that produced widespread tephra deposits across the Bay of Bengal (e.g., Mark et al., 2014).
Overall, siliciclastic units (silt, clay, and sand) at Site U1452 are compositionally classified as mica rich (muscovite and biotite) and quartz rich. Sands occur mostly in fine to medium grain sizes, with the rare occurrence of coarse-sized particles. Feldspar and heavy minerals (e.g., tourmaline, apatite, zircon, amphibole, garnet, sphene, rutile, chrome spinel, zoisite, glauconite, and opaque min-erals) are common in silt- and sand-rich layers, and metamorphic minerals (sillimanite and chloritoid) and lithic fragments (e.g., quartzite, gneiss, cataclastic granite, and garnet-bearing schist) oc-casionally appear in sand.
The nomenclature for lithologic descriptions of sediments con-taining carbonate consists of a principal name and a modifier based on the composition estimated from visual description of the cores and from smear slide observations. The principal name of sediment that appears to contain >75% carbonate is calcareous ooze. The principal name of sediment that appears to contain <10% carbonate is clay. If sediment contains a mixture of clay-sized siliciclastic par-ticles and calcareous components (i.e., carbonate contents between 10% and 75%), the principal name is calcareous clay (see Figure F4 in the Expedition 354 methods chapter [France-Lanord et al., 2016a]). This nomenclature was adopted to describe the continuum of sediments recovered from almost pure clay to almost pure calcar-eous ooze. In most cases, lithologic names assigned using this pro-tocol match well with measured carbonate content and accurately reflect the continuum of sediments recovered at this site (Figure F5).
Drilling disturbances at this site vary in intensity from slight to severe and include flow-in, fractures, up-arching, “soupy” texture, and drilling biscuits. Flow-in is the most common drilling distur-bance in fine-grained intervals, whereas sand may have a homoge-neous (or soupy) texture. Core sections containing soupy sands were vertically settled on the catwalk and then normally curated. As a result, they may have grading structures not described here (Table T3). For a more detailed description and graphic examples of drill-ing disturbance types, see Figure F6 in the Expedition 354 methods chapter (France-Lanord et al., 2016a).
Unit I
Intervals: Hole U1452A = no visual core description, core was cut into sections but not split during the expedition; 354-U1452B-1H-1, 0 cm, to 1H-6, 60 cm; 354-U1452C-1H-1, 0 cm, to 1H-5, 50 cm
Depths: Hole U1452B = 0–8.10 m CSF-A; Hole U1452C = 0– 6.00 m CSF-A
Age: Late Pleistocene–recent
Lithology: nannofossil-rich calcareous clay (major); clay, silt, volcanic ash (minor)
Description
Unit I is dominated by dark gray and greenish white nanno-fossil-rich calcareous clay with abundant burrows and mottling (Figure F6A). Light brown coloration of the uppermost 24 cm indi-cates oxidation close to the seafloor. A light brown volcanic ash layer occurs at 354-U1452B-1H-2, 14–37 cm (Figure F6B). The lower 10 cm of this layer is possibly displaced by coring. Another feature that might indicate coring disturbance is a blob-shaped ash bed at 1H-2, 79–84 cm. Between 1H-4, 88 cm, and 1H-5, 130 cm, a series of silt beds fining upward into clay was observed (succession of silt-dominated turbidites). Hole U1452C shows a comparable succession of lithologies; however, a significant difference is the blob-shaped ash bed at a deeper position (1H-4, 88–96 cm).
Composition from smear slides
See Figure F8 for representative smear slide images. Nannofossil-rich calcareous clay with foraminifers
Calcareous nannofossils make up a significant proportion of to-tal grains (up to 95%–99%). Minor proportions (up to 5%) of fora-minifer fragments were observed. Minor amounts (2%–5%) of radiolarians, diatoms, and clay minerals (354-U1452B-1H-1, 126 cm; 2.76 m CSF) were also found.
Volcanic ash
Smear slides from the ash layers mainly consist of volcanic glass shards 0.01–0.60 mm in diameter and very minor amounts of
Figure F3. Lithostratigraphic summary, Hole U1452B. For legend, see Figure F5 in the Expedition 354 methods chapter (France-Lanord et al., 2016a).
210 200 190 180 170 160 150 140 130 120 110 100 90 80 70 60 50 40 30 20 10 0 1H 2H 3H 4H 5H 6F 7F 8F 9F 10F 11F 12F 131 14F 151 16F 171 18F 191 20F 211 22F 231 24F 251 26F 271 28F 29F 30F 31F 32F 33F 34F 35F 36F 37F 38F 39F 401 41F 42F 43F I II III IV V P-wave velocity (m/s) 1800 1600 1400 Graphic lithology Core recovery GRA (g/cm3) 2.2 2 1.8 1.6 1.4 1.2
U1452B Hole summary
Magnetic susceptibility Loop Point (SI) 300 200 100 0 -18 -10 -2 6 30 22 14 6 -2 Reflectance L*a*b* 60 40 20 0 Natural gamma radiation (cps) 90 50 10 Lith. unit Drilling dist ur ba nc e Lith olo gica l acc ess orie s De pth CS F-A (m )
Figure F4. Lithostratigraphic summary, Hole U1452C. For legend, see Figure F5 in the Expedition 354 methods chapter (France-Lanord et al., 2016a). 40 30 20 10 0 1H 2X 3H 4H 5H 6H I II III P-wave velocity (m/s) 1800 1600 1400 Graphic lithology Core recovery GRA (g/cm3) 2 1.5 1
U1452C Hole summary
Magnetic susceptibility Loop Point (SI) 400 200 0 -7 -5-3-1 1 3 2.2 1.4 0.6 -0.2 Reflectance L*a*b* 45 35 25 15 Natural gamma radiation (cps) 115 95 75 55 35 15 Lith.
unit Drilling distur
ba nc e Lith olo gica l acc ess orie s De pth CS F-A (m )
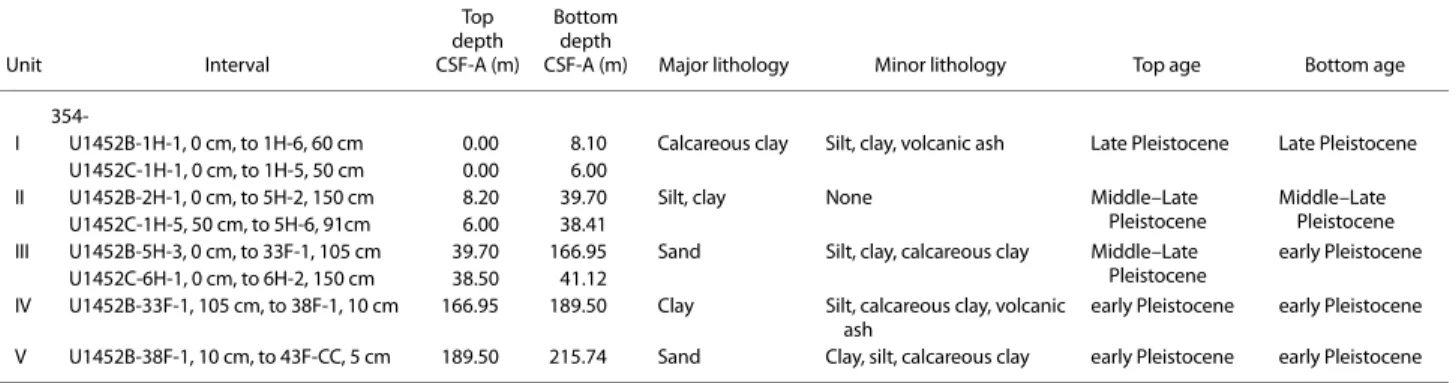
Table T2. Intervals, depths, major and minor lithologies, and ages of units, Site U1452. Download table in .csv format.
Unit Interval Top depth CSF-A (m) Bottom depth
CSF-A (m) Major lithology Minor lithology Top age Bottom age
354-I U1452B-1H-1, 0 cm, to 1H-6, 60 cm 0.00 8.10 Calcareous clay Silt, clay, volcanic ash Late Pleistocene Late Pleistocene U1452C-1H-1, 0 cm, to 1H-5, 50 cm 0.00 6.00
II U1452B-2H-1, 0 cm, to 5H-2, 150 cm 8.20 39.70 Silt, clay None Middle–Late
Pleistocene Middle–Late Pleistocene U1452C-1H-5, 50 cm, to 5H-6, 91cm 6.00 38.41
III U1452B-5H-3, 0 cm, to 33F-1, 105 cm 39.70 166.95 Sand Silt, clay, calcareous clay Middle–Late
Pleistocene early Pleistocene U1452C-6H-1, 0 cm, to 6H-2, 150 cm 38.50 41.12
IV U1452B-33F-1, 105 cm, to 38F-1, 10 cm 166.95 189.50 Clay Silt, calcareous clay, volcanic
ash early Pleistocene early Pleistocene
quartz, feldspar, biotite, and hornblende. Volcanic glass appears as clear plates, flakes, and strands with a relatively low refractive index (1H-2, 22 cm; 1.72 m CSF). The typical range for the volcanic glass proportion is up to 90% of total grains.
Sand with silt
Sand with silt consists primarily of quartz, feldspar, lithic frag-ments, mica, and heavy minerals (1H-4, 120 cm; 5.7 m CSF). Most grains are angular to subangular except mica minerals. The heavy minerals consist of amphibole, tourmaline, zoisite, pyroxene, clino-zoisite, garnet, epidote, zircon, sphene, allanite, apatite, rutile, chloritoid, sillimanite, staurolite, and opaque minerals. Some sam-ples contain organic matter such as plant debris. The maximum grain size is 0.65 mm in diameter (1H-4, 120 cm; 5.7 m CSF-A)
Unit II
Intervals: Hole U1452A not recovered; 354-U1452B-2H-1, 0 cm, to 5H-2, 150 cm; 354-U1452C-1H-5, 50 cm, to 5H-6, 91 cm Depths: Hole U1452B = 8.20–39.70 m CSF-A; Hole U1452C =
6.00–38.41 m CSF-A Age: Middle–Late Pleistocene Lithology: silt, clay
Description
Unit II mostly consists of a repeated sequence of dark gray silt fining upward into gray clay (i.e., mud turbidites). Both clay and silt beds frequently display parallel laminations. Cross-bedding and sharp basal contacts are restricted to silt beds. The thickness of silt and clay beds varies considerably from medium (10–30 cm) to very thin (1–3 cm) (Figure F6). Sedimentary logging of every silt and clay
bed thicker than 1 cm revealed that the silt beds are mainly very thin to thin-bedded, and medium-bedded silt beds show at least two cycles of thickening- to thinning-upward trends in the compos-ite section of Holes U1452B and U1452C (Figure F7). Such thicken-ing- to thinnthicken-ing-upward trends of silt beds are also well represented by variations of P-wave velocity and magnetic susceptibility.
Composition from smear slides
See Figure F8 for representative smear slide images. Sandy silt
Sandy silt consists primarily of quartz, feldspar, lithic fragments, mica, heavy minerals, and carbonate minerals.
Silty sand
This lithology consists primarily of quartz, feldspar, lithic frag-ments, mica, and heavy minerals. Most grains are angular to suban-gular except altered mica. Heavy minerals amphibole, tourmaline, zoisite, pyroxene, clinozoisite, garnet, rutile, epidote, zircon, chlor-itoid, sillimanite, staurolite, and opaque minerals are found. Amphi-bole-bearing schist fragments and fibrolithic sillimanite fragments also occur.
The maximum grain size is 0.42 mm in diameter (354-U1452B-4H-1, 138 cm; 28.58 m CSF-A).
Figure F5. Core image, lithology, CaCO3 content from handheld XRF scan-ning, calcium and strontium values, and reflectance, Core 354-U1452B-37R.
XRF Ca (ppm) 20000 0 XRF Ca as CaCO3 % eq 60 40 20 0 Core image Lithology 189.6 189.2 188.8 188.4 188.0 187.6 187.2 186.8 186.4 186.0 185.6 185.2 184.8 184.4 Depth CSF-A (m) U1452B-37F Sr (ppm) 800 600 400 200 0 Reflectance L* 80 60 40 20
Calcareous clay Clay Sand
Table T3. Core sections containing sand that were vertically settled on the core receiving platform, Site U1452. Download table in .csv format.
Core Section Top depth CSF-A (m) Bottom depth CSF-A (m) 354-U1452B-5H 3 39.70 40.74 5H 4 40.74 41.58 6F 1 41.40 42.24 5H 5 41.58 42.36 5H 6 42.36 43.12 8F 3 50.00 51.50 9F 1 52.30 53.08 9F 2 53.08 54.65 12F 3 68.53 69.33 12F 4 69.33 69.94 14F 1 75.90 76.29 14F 2 76.29 77.59 18F 2 96.25 97.35 18F 3 97.35 98.35 18F 4 98.35 99.03 20F 2 105.85 107.21 20F 3 107.21 108.44 22F 1 113.90 114.94 24F 1 123.40 124.26 26F 3 135.18 136.18 30F 2 153.16 154.36 31F 1 156.50 158.06 31F 2 158.06 159.38 31F 3 159.38 160.61 32F 1 161.20 162.20 38F 1 189.40 190.62 38F 2 190.62 192.02 38F 3 192.02 192.96 38F 4 192.96 193.56 39F 1 194.10 195.10 39F 2 195.10 196.35 39F 3 196.35 197.44 43F 1 213.00 214.13 43F 2 214.13 215.13 43F 3 215.13 215.69 354-U1452C-6H 1 38.50 39.62
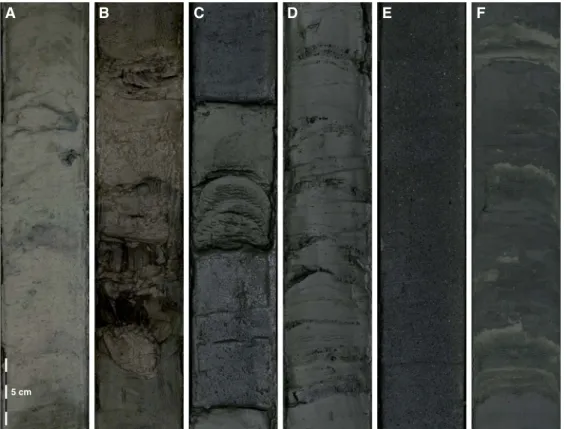
Figure F6. Representative examples of major lithologies recovered in Hole U1451B. A. Nannofossil-rich calcareous clay (1H-2, 79–101 cm). B. Volcanic ash (1H-2, 10–42 cm). C. Silt-dominated turbidites (5H-2, 36–68 cm). D. Succession of clay-dominated turbidites (2H-1, 22–54 cm). E. Homogeneous fine sand (5H-3, 33– 65 cm). F. Greenish gray nannofossil-rich clay with thin interbeds of light gray silt (33F-2, 101–133 cm).
A
B
C
D
E
F
5 cm
Figure F7. A. Silt turbidite (Tb) bed thickness in Unit II, Holes U1452B and U1452C. Arrows indicate thickening to thinning upward trend. Blue dotted line = correlation based on trends of bed thickness variation. Red box = logging interval of B. B. Variations of lithology, P-wave velocity, and magnetic susceptibility (MS_L = whole-round measurements, MS_P = point measurements) from 31.6 to 36 m CSF-A, Hole U1452C. VF = very fine, F = fine, M = medium, C = coarse.
De pth CSF -A ( m ) Co re 0 (cm) 50 0 (cm) 50 Co re Re co ve ry Re co ve ry 10 12 14 16 18 20 22 24 26 28 30 32 34 36 38 40 2H 3H 4H 5H 2X 3H 4H 5H 6H De pth CSF -A ( m ) PWL 1400 1800 Lithology Co re Re co ve ry C lay Silt VF s an d F s an d M sa n d C sa n d MS_L 0 250 MS_P 0 250 31.6 32.0 32.4 32.8 33.2 33.6 34.0 34.4 34.8 35.2 5H
B
A
(m/s) (10-5 SI) (10-5 SI) Hole U1452C Hole U1452C Hole U1452BUnit III
Intervals: Hole U1452A not recovered; 354-U1452B-5H-3, 0 cm, to 33F-1, 105 cm; 354-U1452C-6H-1, 0 cm, to 6H-2, 150 cm Depths: Hole U1452B = 39.70–166.95 m CSF-A; Hole U1452C =
38.50–41.12 m CSF-A
Age: early to Middle–Late Pleistocene
Lithology: sand (major); clay, silt, nannofossil-rich calcareous clay (minor)
Description
Sand and silty sand predominate, particularly in the upper part of the unit (Figure F6E). Sand departs from its usual fine-grained texture at 354-U1452B-12F-4, 0–61 cm, where it is coarse grained, and in Section 12F-1, where it is interbedded with thin beds of clay. In the lower part of the unit, from Core 30F downhole, silty sand is micaceous. Fining-upward texture (normal grading) infrequently occurs. The fine-grained clastic lithologies and their variants (clay, nannofossil-rich clay, silty clay, clayey silt, and silt) are more preva-lent in the lower part of the unit. These lithologies are frequently interbedded with each other on a thin-bedded, very thin bedded, and laminated scale. Mottling is common in the clays, which are parallel laminated in Sections 18F-1 and 26F-3. Silts and sandy silts sometimes have fining-upward texture (normal grading) and are micaceous in some intervals. Nannofossil-rich clay (26F-2) contains foraminifers. Nannofossil-rich calcareous clay (12F-1 and 12F-2) is often burrowed. Finer grained lithologies suffer from up-arching and, more rarely, flow-in. Sands are homogeneous and soupy. Dis-turbance is therefore difficult to identify, but such textures may be interpreted as the result of drilling. In Hole U1452C, only the upper 2.62 m of Unit III was recovered, and the sediments consist of ho-mogeneous dark gray sands with two thin interbeds of dark gray clay.
Composition from smear slides
See Figure F8 for representative smear slide images. Nannofossil-rich clay
Nannofossil-rich clay mainly contains detrital grains and high amounts of calcareous nannofossils (up to 40%; 354-U1452B-12F-1, 77 cm; 67.17 m CSF-A). Occasionally, foraminifers and plant frag-ments are recorded (26F-2, 20 cm; 134.4 m CSF-A).
Clay
Clay mainly contains detrital grains and clay minerals with small amounts of calcareous nannofossils. Occasionally, euhedral carbon-ate minerals are found.
Silt
Silt consists primarily of quartz, feldspar, lithic fragments, mica, heavy minerals, and carbonate minerals.
Silty sand
Silty sand layers intercalated in the upper part of this unit con-sist of quartz, feldspar, mica, and lithic fragments. Heavy minerals mainly comprise amphibole, clinozoisite, zoisite, pyroxene, tourma-line, rutile, zircon, apatite, allanite, sillimanite, and opaque miner-als. Occasionally, euhedral carbonate minerals are found.
Sample 33F-1, 104 cm (166.94 m CSF-A), contains mainly me-dium to fine sand grains such as subrounded quartz and feldspar and has a very low concentration of heavy minerals. This sample also contains a high concentration (20%) of fine carbonate grains smaller than 0.02 mm in diameter.
Micaceous sands, which include a large amount of micas up to 15% of total grains (20F-1, 81 cm; 105.21 m CSF-A), are occasionally found.
The maximum grain size is 0.92 mm in diameter (33F-1, 104 cm; 166.94 m CSF-A).
Unit IV
Interval: Hole U1452A not recovered; 354-U1452B-33F-1, 105 cm, to 38F-1, 10 cm; Hole U1452C not recovered
Depth: 166.95–189.50 m CSF-A Age: early Pleistocene
Lithology: clay (major); nannofossil-rich calcareous clay, silt, volcanic ash (minor)
Description
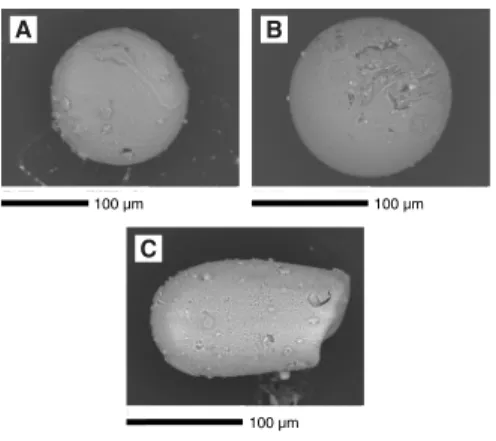
Unit IV comprises 23.65 m of gray to dark gray clay, light to dark gray nannofossil-rich calcareous clay, and dark gray silt. The upper portion (33F-1, 105 cm, to 36F-1, 85 cm) consists of thin-bedded, greenish gray to gray, mottled, nannofossil-rich calcareous clay with foraminifers and thin-bedded dark gray clay with foraminifers inter-bedded with very thinly inter-bedded gray silt. The lower portion (36-1, 85 cm, to 38F-1, 10 cm) consists of light gray bioturbated nanno-fossil-rich calcareous clay and light gray parallel-laminated silt. A white volcanic ash layer is observed at 36F-CC, 29–35 cm. Under-neath this ash layer, a 5 cm thick foraminifer-rich calcareous clay layer containing microtektites was identified (36F-CC, 35.5-40.5 cm; 184.52–179.52 m CSF-A). Hundreds of microtektite grains were observed on the 125–250 and >250 µm size fractions. These fractions are dominated by planktonic foraminifers with a minor amount of glass shards. Most microtektites are from 50 to 250 µm in diameter and are entirely glassy with dark gray and dark brown color. Some grains are transparent and colorless. Twenty-three grains of these microtektites were hand-picked and imaged by scan-ning electron microscopy (Hitachi TM 3000). They display a variety of forms, such as spherical, flat, ellipsoid, dumbbell, and tear-drop-let. Some grains contain bubble cavities. Surface structures vary from smooth and glassy to pitted and corroded. Flow lines and frac-tures are visible on the surface. Broken fragments show conchoidal fracture (Figure F9).
Composition from smear slides
See Figure F8 for representative smear slide images. Nannofossil-rich calcareous clay
Calcareous nannofossils make up the major proportion (70%– 90%) of this lithology, and aggregates of clay minerals and silt grains
Figure F8. Representative examples of lithologies in smear slides, Hole U1452B. A. Volcanic ash (36F-CC, 34 cm; 184.46 m CSF-A). B. Mica-rich silty sand (20F-1, 81 cm; 105.21 m CSF-A). C. Well-sorted silt (20F-3, 90 cm; 108.11 m CSF-A).
0.1 mm 1 mm 0.1 mm
comprise the minor proportion. The smear slide of 36F-1, 123 cm (181.23 m CSF-A), shows a minor amount of foraminifers (up to 10%) along with clay minerals.
Nannofossil-rich clay
Nannofossil-rich clay mainly contains detrital grains, clay min-erals, and calcareous nannofossils. Occasionally, radiolarians and foraminifers are recorded. Some intervals contain a high percentage of clay minerals, up to 80% (35F-2, 10 cm; 176.50 m CSF-A). Volcanic ash
The ash layer mainly consists of slightly corroded volcanic glass shards 0.01–0.3 mm in diameter, minor amounts of quartz, plagio-clase, biotite, and opaque minerals, and very few hornblende and pyroxene grains. Volcanic glass shows mainly clear plates with sub-ordinate flakes and strands with a relatively low refractive index. The typical range for the volcanic glass proportion is 90%–96% (36F-CC, 34 cm; 184.46 m CSF-A) of the total grains.
Sandy silt
Sandy silt consists primarily of quartz, feldspar, lithic fragments, mica, heavy minerals, and carbonate minerals. Heavy minerals such as amphibole, tourmaline, zoisite, and opaque minerals are found. Silty sand
Silty sand consists primarily of quartz, feldspar, lithic fragments, mica, and heavy minerals. Most grains are angular except mica. The heavy mineral proportion is less than that of the overlying units and contains amphibole, tourmaline, pyroxene, zoisite, clinozoisite, zir-con, and opaque minerals. Occasionally, amphibole-bearing schist fragments and fibrolithic sillimanite fragments occur.
The maximum grain size is 0.43 mm in diameter (34F-3, 145 cm; 175.05 m CSF).
Unit V
Interval: Hole U1452A not recovered; 354-U1452B-38F-1, 10 cm, to 43F-CC, 5 cm; Hole U1452C not recovered
Depth: 189.50–215.74 m CSF-A Age: early Pleistocene
Lithology: fine sand (major); clayey sand, silty clay, silt, calcare-ous clay (minor)
Description
Unit V comprises 26.24 m of dark gray fine sand, dark gray clayey sand, gray silty clay, and gray calcareous clay. This unit is di-vided into three subunits. The upper part, Subunit Va (38F-1, 10 cm, to 41F-CC, 22 cm), is 18.40 m thick and consists of dark gray fine sand and dark gray clayey sand. The middle part, Subunit Vb (42F-1, 0 cm, to 43F-1, 55 cm), is 5.25 m thick and consists of gray nannofossil-rich clay with mottling (Figure F6F), gray parallel-lami-nated silty clay, and gray silt. The lower part, Subunit Vc (43F-1, 55 cm, to 43F-CC, 5 cm), is 2.19 m thick and consists of dark gray fine sand. The fine sands are soupy and lack internal structures, and the clayey sands show flow-in that might be related to drilling distur-bance (see the Expedition 354 methods chapter [France-Lanord et al., 2016a]).
Composition from smear slides
See Figure F8 for representative smear slide images. Sandy silt
Sandy silt consists primarily of quartz, feldspar, lithic fragments, mica, heavy minerals, and carbonate minerals. Heavy minerals am-phibole, tourmaline, zircon, and opaque minerals are found. Silty clay
Silty clay mainly contains detrital grains. Occasionally this litho-logy contains very fine sand–sized grains up to 0.11 mm in diameter (43F-1, 95 cm; 213.95 m CSF-A).
Sandy silt
Sandy silt consists primarily of detrital grains, such as quartz, feldspar, lithic fragments, micas, and heavy minerals. Most grains are angular except mica. The heavy mineral assemblage is relatively simple and consists of amphibole, zircon, zoisite, and opaque min-erals. Occasionally, euhedral carbonate minerals and carbonate ag-gregate grains are found.
The maximum grain size is 0.13 mm in diameter (42F-4, 70 cm; 213.06 m CSF-A).
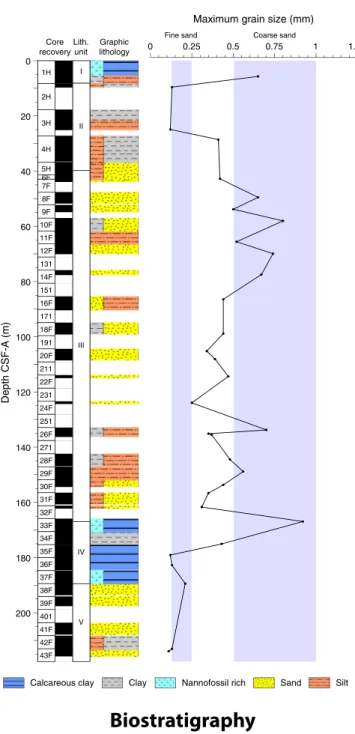
Maximum grain size
Maximum grain size was determined at approximately 7 m in-tervals at Site U1452 (Figure F10). In each core, the coarsest and/or thickest lithology (generally from the base of the coarsest turbidite) was chosen for smear slide analysis, and the largest five equant de-trital grains (quartz and feldspar) were measured. Maximum grain size ranges from 0.11 to 0.92 mm (very fine to coarse sand) and cor-responds to a clayey silt layer at the base of Unit III at 33F-1, 104 cm. However, background values throughout the sequence show that fine sand–sized material reached the fan setting at Site U1452 via turbidity currents since at least the early Pleistocene.
Figure F9. Scanning electron microscope images of microtektite grains from Section 354-U1452B-36F-CC, 35.5–40.5 cm (184.52–179.52 m CSF-A).
100 µm 100 µm
100 µm
A B
Biostratigraphy
Calcareous nannofossils and planktonic foraminifers provide biostratigraphic constraints at Site U1452 (Tables T4, T5). Four bio-markers were identified at this site; they are listed in Table T6 and integrated into the figures in Stratigraphic synthesis.
Calcareous nannofossils
The distribution of calcareous nannofossils at Site U1452 is shown in Table T4. Calcareous nannofossil assemblages were ob-served in 41 samples from Holes U1452A–U1452C. The sediments at Site U1452 extend in age to the early Pleistocene. Hole U1452B is differentiated into three calcareous nannofossil zones based on the FO of Emiliania huxleyi in Sample 2H-CC and the last occurrence (LO) of Pseudoemiliania lacunosa in Sample 8F-CC. The presence of Helicosphaera sellii in Sample 36H-CC suggests that the base of Hole U1452B is early Pleistocene. Hole U1452C is divided into two calcareous nannofossil zones (NN21 and NN20) using the FO of E. huxleyi in Sample 4H-CC.
Planktonic foraminifers
At Site U1452, planktonic foraminiferal assemblages are charac-teristic of tropical–subtropical environments. The planktonic fora-minifer biostratigraphy for Site U1452 is generated primarily by analysis of core catcher samples from Hole U1452B. Supplementary samples were taken from core sections when time permitted or when no foraminifers were found in the core catcher. Five samples were examined from Hole U1452C to constrain species ranges in in-tervals that were not recovered in Hole U1452B. The sedimentary succession at this site ranges from Subzone PT1b (Middle–Late Pleistocene) to Zone PT1a (early Pleistocene) and agrees with the nannofossil biostratigraphy. A barren interval is present in Hole U1452B between Samples 5F-CC (43.27 m CSF-A) and 11F-2F, 71– 76 cm (63.91 m CSF-A), and is associated with the recovery of turbi-dite sands in the core catcher.
The group and species abundances of planktonic foraminifers are shown in Table T5. Foraminiferal preservation ranges from poor to good in samples where foraminifers occur. Fragmentation of planktonic foraminifers ranges from light to severe and is particu-larly apparent in carbonate oozes. Assemblages are dominated by Neogloboquadrina dutertrei, Globigerinoides ruber, Globorotalia tu-mida, and Pulleniatina obliquiloculata, with rare Globigerina bulloides and Orbulina universa. No major faunal turnovers occur during this narrow interval, and benthic foraminifers remain rare throughout. The LO of Globorotalia tosaensis is in Samples 354-U1452B-2H-CC and 354-U1452C-4H-CC. Although this species usually marks the Zone PT1b/PT1a boundary, it occurs at this site before the LO of a younger nannofossil biomarker (Table T6). This occurrence could indicate that G. tosaensis is reworked at this site. Or, because this pattern is observed at other Expedition 354 sites, it is possible that the extinction of this species occurs at a younger age in the Indian Ocean.
Figure F10. Maximum grain size, Hole U1452B.
200 180 160 140 120 100 80 60 40 20 0 1H 2H 3H 4H 5H 6F 7F 8F 9F 10F 11F 12F 131 14F 151 16F 171 18F 191 20F 211 22F 231 24F 251 26F 271 28F 29F 30F 31F 32F 33F 34F 35F 36F 37F 38F 39F 401 41F 42F 43F I II III IV V Graphic lithology Core
recoveryLith.unit 0 0.25 0.5 0.75 1 1.25
Dep th C S F -A (m)
Maximum grain size (mm)
Coarse sand Fine sand
Calcareous clay Clay Nannofossil rich Sand Silt
Table T4. Calcareous nannofossils, Site U1452. Download table in .csv for-mat.
Table T5. Planktonic foraminifer group and species abundance, Site U1452.
Paleomagnetism
Paleomagnetic analyses at Site U1452 focused mainly on identi-fying magnetic polarity reversals and linking them to the geomag-netic polarity timescale (Gradstein et al., 2012), as well as on identifying intervals suitable for shore-based paleomagnetic work. Hole U1452A recovered a single mudline core intended mainly for detailed paleomagnetic and rock magnetic study of the effects of the Toba ash and for studies aimed at improving age control for the time interval since the Toba ash deposition at ~75 ka. Core 1H was there-fore neither split on board nor measured, but it will be the focus of postexpedition study. All cores were collected with nonmagnetic APC or HLAPC barrels. Cores 354-U1452A-1H, 354-U1452B-1H through 5H, and 354-U1452C-1H, 3H, and 4H–6H were oriented using the Icefield MI-5 tool.
Archive section halves from 22 cores from Hole U1452B and 3 cores from Hole U1452C were measured using the shipboard super-conducting rock magnetometer (SRM). The remanent magnetiza-tion of all secmagnetiza-tion halves was measured after 0, 15, and 20 mT alternating field (AF) demagnetization at 2.5 cm intervals. Archive section halves with a substantial amount of hemipelagic or calcare-ous clay sediments were subjected to an additional 10 mT AF step and measurement. Cores 354-U1452B-1H and 354-U1452C-1H through 5H were not demagnetized to preserve them for possible shore-based paleomagnetic work. Remanent magnetization mea-surements made after the highest peak field AF treatment are used here for polarity determination. Sections where the sediment was sandy, watery, or heavily disturbed by the coring process were not measured. As at other sites, tops of cores and edges of sections likely to be affected by edge effects were not interpreted (see Paleomag-netism in the Expedition 354 methods chapter [France-Lanord et al., 2016a]).
Five discrete samples were collected to supplement archive sec-tion half data. Sample locasec-tions were chosen in fine-grained inter-vals where drilling deformation was minimal or not visible. No samples were taken from calcareous clay intervals to preserve the possibility of further U-channel sampling. Discrete samples were measured on the JR-6A spinner magnetometer after 0, 10, 15, 20, 25, 30, 35, 40, 50, 60, and 80 mT AF treatments.
Results
Paleomagnetic results from both section-half and discrete mea-surements are presented in Figures F11 and F12 and Tables T7 and T8. Similar to Sites U1449–U1451, both positive and negative incli-nations are present in Hole U1452A. A vertical overprint, likely im-parted by the drilling process, is in most cases demagnetized by AF demagnetization in peak fields of 10 mT. Many NRM inclinations from discrete samples and section halves are close to zero after 20 mT demagnetization (mode of section-half measurements = 2.5°), although the median inclination is still close to that expected from a geocentric axial dipole (GAD; median observed = 17°, expected = 15.7°) given the site’s present-day location. Several discrete samples acquired either a gyroremanent magnetization (GRM) or an anhys-teretic remanent magnetization (ARM) in peak AF treatments above 60 mT.
Calcareous clay, which occurs in relatively high abundances in Cores 354-U1452B-1H, 12F, 30F, and 33F–37F, is associated with low NRM intensities in section halves (lithologic terms here refer to lithology descriptions; see Lithostratigraphy), following the pat-tern observed at other sites. Median NRM intensities in calcareous clay are 1.8 × 10⁻² A/m, compared to 7.2 × 10⁻² A/m for lithologies
other than calcareous ooze, calcareous clay, or sand (principally clay and silt). NRM intensities of the limited number of sand intervals that we measured are slightly higher (median 7.9 × 10⁻² A/m).
Cal-careous clay from Hole U1452B loses a larger fraction of its NRM after 20 mT AF demagnetization (95%) than does sand (74%) or other lithologies (68%). We interpret these differences to reflect a variable concentration of a low-coercivity magnetic phase that ac-quires a strong drilling overprint. The low-coercivity component is present at higher concentrations in calcareous clay than in sand or other lithologies. Based on AF demagnetization of discrete samples, coercivities are consistent with magnetite and/or titanomagnetite as the principal NRM carrier. The specific magnetic mineralogy will be assessed during postexpedition work.
Magnetostratigraphy
Sediments from oriented Cores 354-U1452B-3H and 4H that pass our quality criteria (see Paleomagnetism in the Expedition
Table T6. Biostratigraphic age datums and midpoint calculations, Site U1452. FO = first occurrence, LO = last occurrence. Download table in .csv format. Top core,
section Bottom core, sec-tion Zone Marker event GTS2012 age (Ma) Top depth CSF-A (m) Bottom depth CSF-A (m) Midpoint depth CSF-A (m) Depth CSF-A (m) ± Planktonic foraminifer datums (Wade et al., 2011):
354-U1452B-
354-U1452B-1H-CC 2H-CC PT1a LO Globorotalia tosaensis 0.61 8.21 9.73 8.97 0.76
354-U1452C-
354-U1452C-3H-CC 4H-CC PT1a LO Globorotalia tosaensis 0.61 19.78 26.80 23.29 3.51
Calcareous nannofossil datums (Gradstein et al., 2012): 354-U1452B- 354-U1452B-2H-CC 3H-CC NN21 FO Emiliania huxleyi 0.29 9.71 25.09 17.40 7.69 NN20 Gap zone 7F-CC 8F-CC NN19 LO Pseudoemiliania lacunosa 0.44 42.90 51.70 47.30 4.40 35F-CC 36F-CC LO Helicosphaera sellii 1.26 180.27 184.47 182.37 2.10 354-U1542C- 354-U1542C-4H-CC 5H-CC NN21 FO Emiliania huxleyi 0.29 26.72 38.41 32.57 5.84
Figure F11. NRM decay (left) and AF demagnetization vector (right) diagrams of discrete samples, Site U1452. Points on demagnetization vector diagrams = projected endpoints of remanent magnetization vector measured for each sample in core coordinates (azimuth not oriented). A. Sample with positive princi-pal component inclination, interpreted as normal polarity. Deviation of remanence vector toward Y-direction indicates acquisition of remanence (likely GRM) during AF treatment. B, C. Samples with anomalous horizontal ChRM vector, polarity undetermined. Note strong drilling overprint. D. Sample with steeply inclined ChRM vector in the vertical direction, interpreted as normal. E. Sample with distributed AF demagnetization spectrum and relatively small drilling overprint. Zigzag vector endpoints in the vertical plane indicate ARM acquisition during AF demagnetization.
Horizontal Vertical E W Unit = 10.4 × 10⁻³ A/m N, Up S, Down 0 10 20 30 40 50 60 0 0.2 0.4 0.6 0.8 1 U1452B-10F-3, 65-67 cm 60.64 m CSF-A
A
Mmax = 63.6 × 10⁻³ A/m M /M ma x Field (mT) E W Unit = 4.36 × 10⁻³ A/m N, Up S, Down 0 10 20 30 40 50 60 0 0.2 0.4 0.6 0.8 1 Field (mT) U1452B-26F-1, 115-117 cm 134.05 m CSF-AB
M /M ma x Mmax = 34.9 × 10⁻³ A/m E W Unit = 3.93 × 10⁻³ A/m N, Up S, Down 0 10 20 30 40 50 60 0 0.2 0.4 0.6 0.8 1 144.14 m CSF-A U1452B-28F-2, 24-26 cm Field (mT)D
M /M ma x Mmax = 25.2 × 10⁻³ A/m E W Unit = 3.92 × 10⁻³ A/m N, Up S, Down 148.14 m CSF-A U1452B-29F-1, 101-103 cm 0 10 20 30 40 50 60 0 0.2 0.4 0.6 0.8 1 Field (mT)E
M /M ma x Mmax = 25.4 × 10⁻³ A/m E W Unit = 2.42 × 10⁻³ A/m N, Up S, Down 0 10 20 30 40 50 60 70 80 90 100 0 0.2 0.4 0.6 0.8 1 U1452B-26F-2, 67-69 cm 134.87 m CSF-AC
M /M ma x Field (mT) Mmax = 18.2 × 10⁻³ A/m354 methods chapter [France-Lanord et al., 2016a]) have remanent magnetization directions with positive inclinations and declinations close to present-day magnetic north (Fisher [1953] mean declina-tion of Core 3H = 320° after 20 mT demagnetizadeclina-tion; Core 4H = 342°). Oriented Core 5H has a mean declination of 125° (after 20 mT demagnetization), which we believe is due to an error in the Icefield orientation measurement for this individual core. Corresponding Core 354-U1452C-5H was also oriented but was not demagnetized and has a mean NRM declination of 345°.
Core 354-U1452B-37F contains mixed polarity and can be cor-related with the calcareous clay interval observed at roughly the same depth in Core 354-U1450A-36F and at somewhat shallower
depths in Cores 354-U1449A-18F and 354-U1451A-13F. Three po-larity reversals are identified in Core 354-U1452B-37F on the basis of changes in declination (Figure F13; Table T9). We identify the bottom two as the upper and lower boundaries of the Cobb Moun-tain Subchron (C1r.2n; 1.173–1.185 Ma; Gradstein et al., 2012). There is considerable high-frequency variability in the declination in the top two sections of Core 37F, but a reversed to normal transi-tion can be identified using the Cobb Mountain Subchron as a refer-ence for normal polarity. We identify this transition as the lower boundary of the Jaramillo Subchron (C1r.1n; 1.072 Ma). Although we regard the magnetic record of core catchers with caution, a large change in declination is observed between Sections 36F-CC and
Figure F12. NRM of archive section halves and discrete samples before and after 20 mT AF demagnetization, Hole U1452B. Gray dots = before demagnetiza-tion. Black dots = intervals that do not meet quality criteria (see Paleomagnetism in the Expedition 354 methods chapter [France-Lanord et al., 2016a]). Red dots = calcareous clay, blue dots = other lithology. Inclination and declination: dark green dots = principal component directions from discrete samples. Incli-nation: gray lines either side of 0° = expected inclinations from GAD. DecliIncli-nation: yellow = oriented cores. Declinations are in a geographic reference frame only where orientation data are available. Intensity: intensity of magnetization before and after demagnetization. Large light green dots = before demagneti-zation, dark green dots = after demagnetization. Magnetic susceptibility (MS) = point measurements on archive section halves.
0 20 40 60 80 100 120 140 160 180 200 220 -90 0 90 0 180 10-5 10-3 10-1 100 101 102 103 Depth CSF-A (m) Recovery Inclination (°) Declination (°) Intensity (A/m) MS (10-5 SI)
Table T8. Orientation data, Site U1452. Download table in .csv format.
Hole Core Core type
Azimuthal ori-entation (°) Fisher mean declina-tion (°) Mean oriented decli-nation (°) Comments
A 1 H 348.9 Core not split during expedition
B 1 H 244.9 205.5 90.4 Directions from 0 mT step after removing section edges and disturbed intervals
B 2 H 317.5 No declination because of high drilling disturbance
B 3 H 316.5 4.3 –39.2 Directions from 20 mT step after removing section edges and disturbed intervals B 4 H 176.5 166.4 –17.1 Directions from 20 mT step after removing section edges and disturbed intervals B 5 H 80.6 48.6 129.2 Directions from 20 mT step after removing section edges and disturbed intervals
C 1 H 137.8 Core not run on SRM
C 3 H 60.1 274.3 –25.6 Directions from 0 mT step after removing section edges and disturbed intervals C 4 H 206.0 128.0 –26.0 Directions from 0 mT step after removing section edges and disturbed intervals C 5 H 115.1 193.9 –51.0 Directions from 0 mT step after removing section edges and disturbed intervals
C 6 H 152.0 Core not run because of high drilling disturbance
Table T7. ChRM of discrete samples, Site U1452. Download table in .csv format.
36F-3. This change in declination may represent a change in mag-netic polarity. As observed at Sites U1449 and U1451, the polarity change is associated with an ash layer (Section 36F-CC). We inter-pret this ash as Ash D of Dehn et al. (1991) and the polarity reversal as the Brunhes/Matuyama boundary (C1n-C1r; 0.781 Ma). Several
microtektites, likely associated with the Brunhes-Matuyama boundary–age Australasian Microtektite Event (Smit et al., 1991) are found in Section 16F-CC (see Lithostratigraphy), further con-firming our age interpretation of this polarity event.
Geochemistry and microbiology
Hydrocarbon gas sampling and analysis
Headspace gas samples were taken at a frequency of one sample per core in Holes U1452A and U1452B as part of the routine safety monitoring program (Table T10). Methane concentrations were low (2 ppmv) in Hole U1452A (one sample at 4 m CSF-A). In Hole 1452B, methane concentrations were low (1 ppmv) between 4 and 32 m CSF-A; concentrations increased below 32 m CSF-A and ranged from 75 to 33,761 ppmv (mean 6,695 ppmv; N = 30) between 32 m CSF-A and the bottom of Hole U1452B. The highest methane concentration (33,761 ppmv) was observed at 191 m CSF-A in Hole U1452B. Quantifiable levels (1 ppmv) of ethane were found at 191, 211, and 213 m CSF-A in Hole U1452B. The methane/ethane ratio varied within the 22,000 to 47,000 range in these samples. Ethene, propane, and propene were below the quantification limit in all samples.
Interstitial water sampling and chemistry
Nine samples from Hole U1452B were analyzed for interstitial water chemistry (Table T11). Two samples were obtained by Rhizon sampling when sediments were soft enough, one sample corre-sponds to free-flowing water flowing out the core liner when the liner was cut from a liquidized level of sand sandwiched between two more cohesive lithologies, and the remaining samples were ob-tained by squeezing whole-round cores generally 5 cm long. Based on the rate of change of cation and anion content with depth and changes in their covariation, two hydrologic units can be
distin-Figure F13. Polarity interpretation, Core 354-U1452B-37F. Gray dots = measurements that do not pass quality control criteria (see Paleomagnetism in the Expedition 354 methods chapter [France-Lanord et al., 2016a]). Red dots = calcareous clay, blue dots = other lithology. Declination is rotated and illustrates magnetostratigraphic interpretation. A single vertical axis rotation was applied to the entire core so that points interpreted as normal polarity plot near the 0° line. Intensity = intensity of magnetization after 20 mT AF demagnetization. Magnetic susceptibility (MS) = point measurements on archive-half sections. Polarity: black = normal, white = reversed, gray = uncertain. Geomagnetic polarity timescale (GPTS) of Gradstein et al. (2012).
-90 0 90 184 185 186 187 188 189 190 0 180 10-510-4 10-310-2 101 102 0.78 0.99 1.07 1.17 1.19 C1n C1r .1n Br unhes Matuy ama J CM Inclination
(°) Declination (°) Intensity (A/m)
C1r .1r C1r .2r MS (10-5 SI) C1r .3r Depth CSF-A (m) GPTS 2012 Chron Polarity
Table T9. Magnetostratigraphy, Hole U1452A. Download table in .csv format. Polarity interval
top depth CSF-A (m)
Top chron/ subchron age
(Ma) Chron/subchron Comments
354-U1452A-0.00 0.000 Bruhnes (C1n)
184.10 0.781 Matuyama (C1r.1r) Section 36F-CC (possible location, see text) 186.00 0.988 Jaramillo (C1r.1n) Core 37F (most probable location)
187.20 1.072 Matuyama (C1r.2r) Core 37F
188.33 1.173 Cobb Mountain (C1r.2n) Core 37F
188.61 1.185 Matuyama (C1r.3r) Core 37F
Table T10. Methane concentrations, Holes U1452A and U1452B. Download table in .csv format.
Table T11. Interstitial water geochemical data, Site U1452. Download table in .csv format.