HAL Id: hal-00717509
https://hal.archives-ouvertes.fr/hal-00717509
Submitted on 13 Jul 2012HAL is a multi-disciplinary open access
archive for the deposit and dissemination of sci-entific research documents, whether they are pub-lished or not. The documents may come from teaching and research institutions in France or abroad, or from public or private research centers.
L’archive ouverte pluridisciplinaire HAL, est destinée au dépôt et à la diffusion de documents scientifiques de niveau recherche, publiés ou non, émanant des établissements d’enseignement et de recherche français ou étrangers, des laboratoires publics ou privés.
SVGMapping: an R package to map omic data sets onto
pathways templates
Raphaël Champeimont, Christophe Leplat, Franck Chauvat, Jean-Christophe
Aude
To cite this version:
Raphaël Champeimont, Christophe Leplat, Franck Chauvat, Jean-Christophe Aude. SVGMapping: an R package to map omic data sets onto pathways templates. 1ères Rencontres R, Jul 2012, Bordeaux, France. �hal-00717509�
SVGMapping: an R package to map omic data sets onto pathways templates R Champeimonta
,b, C Leplata, F Chauvata and JC Audea a
Integrative Biology and Molecular Genetics Department CEA, Institute of Biology and Technology Saclay
F-91191 Gif sur Yvette, France [email protected]
[email protected] [email protected] b
Génomique des Microorganismes UMR 7238 CNRS-UPMC
15 Rue de l’Ecole de Médecine, 75006 Paris, France [email protected]
Mots clefs : Vizualisation, Biology, Pathways, Microarrays, High throughput assays.
High-throughput omic technologies are now commonly used in large-scale experimental biology. The main characteristic of these omic approaches is that they usually produce large amounts of data. Results obtained through these analyses are mostly interpreted or assessed in terms of given hypotheses. In most cases, huge amount of results need to be transformed (eg using classification methods), integrated with other biological knowledge (eg pathways), and explored using mainstream or dedicated visualisation tools. Then, they can be meaningfully interpreted by biologists. Visualisation is crucial for an optimal understanding of the results emerging from the concerted analysis of shared material between experimental and computational researchers. Directed visualisation methods [1] use prior knowledge in their process. In biology this knowl-edge is often depicted by networks. For example, Momin & al. [2] designed a method that combines a visualisation method and a prediction process to map transcriptomic data with pre-dicted metabolite pools into pathways. Here we report SVGMapping [3], an R package to map omic experimental data onto custom-made templates which can be used to depict metabolic pathways, cellular structures or biological processes. SVGMapping allows the modification of color, opacity or shape of given graphical elements. It can be applied several times on the same template to combine various omic data types (eg protein and metabolite concentrations). This package has been designed to integrate the wealth of data generated by various strains (eg mutants vs wild-type), growth conditions (eg before vs after stress) or kinetic experiments. Templates: In the SVGMapping framework, a template is an SVG file where shapes are specif-ically labeled. Labels are specified as attributes assigned to any kind of shape. These labels are used to pinpoint all attribute modifications (ie colors or opacity) to apply on the template. We have selected the SVG format for its versatility as a web-based and portable standard that can be rendered in many other graphics formats (eg PNG or PDF). Furthermore, javascript code can be embedded into SVG files to provide an interactive experience to the user when viewed within a compatible browser.
Omic data mapping: experimental data are provided as a numeric matrix M with as many columns as conditions. Each row is labeled with a unique identifier (eg gene, protein or
metabo-lite). This identifier will be used to track the template shapes to modify.
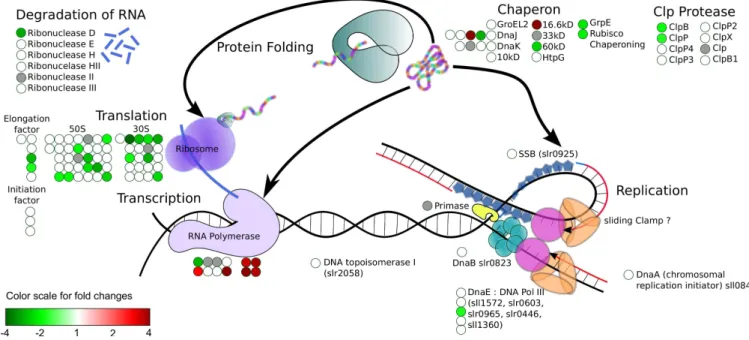
For single condition experiments, M values can be uniformly bound to a set of colors or a color gradient to modify the filling or stroke colors of shapes (see figure 1). For experiments with multiple conditions, one can use pie charts or colored stripes. In both cases, the filling color of each slice/stripe is set according to the M value of the related shape identifiers (ie rows) and conditions (ie columns).
Besides this common usage, one can use M values to alter the opacity or the stroke width of shapes. Another specific use is to simulate the filling of Erlenmeyers. In this case, M values should be given as a proportion of the complete filling. This mode is of particular interest to simulate the relative concentrations of metabolites. Finally, since SVG is a web centric format, we have implemented a mechanism to add tooltips and hyperlinks (as URLs) to each shape.
Figure 1: This figure represents DNA metabolic processes in Synechocystis sp. PCC 6803 and illustrates a possible use of the SVGMapping package. Red (resp. green) circles depict induced (resp. repressed) genes involved in each biological mechanism corresponding to a microarray experiment in which cells where exposed to 3mM H2O2 for 30 minutes [4]. Matches between expression fold-changes and color levels can be obtained using the scale on the lower left of the figure. Circles filled in grey are related to probes that were not hybridized on the microarrays. Notice that many genes involved in protein translation were repressed while genes of RNA polymerase transcription were induced.
References
[2] Keim, D. A. & al. (2006).Challenges in Visual Data Analysis. Tenth International Confer-ence on Information Visualisation (IV’06).
[2] Momin, A. & al. (2011).A method for visualization of "omic" datasets for sphingolipid metabolism to predict potentially interesting differences. The Journal of Lipid Research, 52(6), 1073-83
[3]http://svgmapping.r-forge.r-project.org/
[4] Houot, L. & al. (2007).Cadmium triggers an integrated reprogramming of the metabolism of Synechocystis PCC6803, under the control of the Slr1738 regulator. BMC Genomics, 8, 350