Doctoral thesis: Suzanne Shaw Page 1 présentée à
UNIVERSITE PARIS-DAUPHINE ECOLE DOCTORALE DE DAUPHINE Pour obtenir le grade de : Docteur en Economie
Par
SHAW, Suzanne
Titre de la thèse:
Abatement and evolution in the European electric power sector in
reaction to the EU ETS carbon price signal
Thèse dirigée par Christian DE PERTHUIS, Université Paris-Dauphine
Jury de thèse :
Christian DE PERTHUIS, directeur de thèse, professeur, Université Paris-Dauphine
Pierre-André JOUVET, rapporteur, professeur, département des sciences économiques, Université Paris-Ouest
Robertus DELLINK, rapporteur, économiste, OECD Direction Environnement Renaud CRASSOUS, examinateur, direction de la stratégie, EdF, Paris
Patrice GEOFFRON, examinateur, CGEMP, Université Paris-Dauphine Paris.
Doctoral thesis: Suzanne Shaw Page 2
Réduction d’émissions et évolution du secteur européen électrique
face à un signal prix de carbone provenant du système européen
d’échange de quotas
Doctoral thesis: Suzanne Shaw Page 3
ACKNOWLEDGEMENTS
This PhD dissertation is the result of a three-year research process. Its completion would not have been possible without valuable inputs I received from people that I worked with and came into contact with along the way.
First of all, I would like to thank my supervisor, Christian de Perthuis, for his valuable insight and advice throughout the course of this thesis. His capacity to identify issues of salient research interest was indispensable. Moreover, his enthusiasm for this field of research fuelled my motivation for this work.
I am also grateful to Pierre-André Jouvet, who followed my work during the last year and a half and provided valuable intellectual input. I would also like to thank my two external examiners Renaud Crassous and Patrice Geoffron for having accepted to judge the academic quality of my work.
I am indebted to the Climate Economics Chair which has provided financial support for conducting this thesis, without which this thesis would not have been possible.
I am also grateful CDC Climat Recherche (the research team of CDC Climat) and CDC Climat itself, for providing me with office facilities and a convivial working environment throughout the duration of my PhD.
I would like to express my sincere gratitude to the colleagues at the Climate Economics Chair and at CDC Climat Recherche with whom I have had various discussions, which have contributed to the outcome of my work, and who have also been a source of moral support throughout these three years.
Finally, I cannot sufficiently express my appreciation for the support, friendship and laughter I received from my family, friends, and office mates during this period, which has helped me to keep my head up, and remain motivated, with my eye on the prize. In no particular order: Mum, Dad, Nats, Francesca, Mariana, Alexis, Andrés, Dorothee, Ian, Oliver, Jessica, Cristina, you all know who you are...
Doctoral thesis: Suzanne Shaw Page 4 role in EU ETS emissions and emissions reductions. As such, understanding the reaction of the sector to EUA1 or carbon permit prices, both in the short-term (production) and in the long-term (investment) is important to analyse the potential impact of EU ETS policy and implications for achieving policy objectives.
Analysis of the electricity sector for Phase II of the EU ETS confirms the general market expectation of switching from coal-based to gas-based, but also biomass-based, technologies with increasing EUA prices. Moreover, the emissions results of the model for the short-term corroborate market estimations of a long Phase II, but indicate that abatement occurs in spite of this, as actors are guided by longer term anticipations of stricter targets and hedge against uncertainty. However, the abatement potential of the power sector in the short-term is limited by the inertia of the park technology mix. Analysis of the sector over the longer term, to 2030, shows that the EUA price can play a role in changing the technology mix of the park towards less emissions-intensive one – even facilitating the emergence of CCS (carbon capture and storage) – and thus increase the potential for achievable emissions reductions compared to a situation where no consideration is given to EUA prices in investment.
Key words: Electricity sector, EU ETS, climate change, technology mix, emissions
Doctoral thesis: Suzanne Shaw Page 5 quotas), aura un rôle déterminant dans les réductions d’émissions relevant du SCEQE. Une compréhension de la réaction de ce secteur face aux prix du quota européen de carbone (ou EUA pour European Union Allowance), à court terme au niveau de la production d’électricité, et à long terme au niveau des investissements du secteur, est essentielle pour appréhender l'impact potentiel du SCEQE en tant qu'instrument de réduction d’émissions. Elle permettra également une analyse du rôle de ce secteur dans la réalisation des objectifs du SCEQE. L’analyse du secteur électrique dans la phase II du SCEQE confirme les prénotions du marché d’un basculement de la production d’électricité à partir du charbon vers une production basée plus sur le gaz et la biomasse, pour un champ de prix de l’EUA donné. En outre, les estimations en termes des émissions au niveau européen corroborent celles des acteurs du marché d'une phase II longue. Toutefois, guidé par une anticipation de long terme et face à des incertitudes, le secteur effectue des réductions d’émissions durant cette Phase. Le potentiel de réduction d’émissions du secteur électrique dans le court terme est limité par l'inertie de la composition du parc électrique. L’analyse du secteur à long terme, d'ici à 2030, montre que le prix des EUA peut jouer un rôle dans l'évolution du mix technologique du parc pour atteindre un parc globalement moins intense en émissions – le prix de l’EUA faciliterait même l'émergence de la CSC (capture et stockage du carbone). Ainsi l’intégration du prix du carbone dans les décisions d’investissement pourrait avoir un rôle significatif dans la décarbonisation du secteur à long-terme.
Mots clés : secteur électrique, EU ETS, SCEQE, changement climatique, mixe technologique, émissions
Doctoral thesis: Suzanne Shaw Page 6 Acknowledgements 3 Abstract 4 Résumé 5 TABLE OF CONTENTS 6 TABLE OF FIGURES 10 TABLE OF TABLES 12 TABLE OF BOXES 13
SYNTHESE EN FRANÇAIS / EXTENDED FRENCH SUMMARY 14
I. INTRODUCTION 20
1 General Context 20
2 Research Questions 21
3 Methodology 22
4 Research scope, limitations, and links with other research activities 23
5 This work compared to previous work in the field 24
6 Main results 25
7 Structure of the document 27
II. LITERATURE REVIEW 29
1 Context 29
1.1 Background to the EU ETS 29
1.2 The case of the electricity sector 31
2 Review of emission permit system models 34
2.1 Econometric models 34
Doctoral thesis: Suzanne Shaw Page 7
3 Review of relevant energy system models 44
4 What does the Zephyr model contribute? 47
4.1 Similarities and differences of Zephyr to existing models 47
5 References for chapter II 50
III. DESCRIPTION OF THE ZEPHYR MODEL 53
1 A model of demand and supply 53
1.1 Zephyr’s perspective on demand, supply and compliance 53
2 Technical description of the model 54
2.1 Permit supply 54
2.2 Permit demand of non-electricity sectors 55
2.3 Permit demand of the electricity sector 57
2.4 Compliance 76
2.5 Uncertainty 79
3 Data sources and assumptions 79
4 Model Validation 83
5 Results 85
5.1 Results under certainty 85
5.2 Sensitivity analyses 87
6 Summary and conclusions to chapter III 92
7 Next Steps 93
8 References for chapter III 94
Annexes to chapter III 96
A. The mechanism of banking and borrowing in the European Union Emissions Trading Scheme (EU
ETS) 96
B. Construction of the EU electric power park of the model from various databases 97
IV. ANALYSIS OF EU ETS-ELECTRICITY SECTOR INTERACTIONS IN PHASE II
100
1 Introduction 100
2 Model approach 101
2.1 Review of emissions-price dynamics modelling approach and the role of uncertainty 101 2.2 Model setup in terms of modelled technologies and park mix 102
Doctoral thesis: Suzanne Shaw Page 8
4 Model scenarios 107
5 Results and discussion 108
5.1 Base case results 108
5.2 An analysis of the German nuclear withdrawal decision 115
5.3 Implications of higher electricity demand 118
5.4 Implications of higher electricity demand and growth in non-electricity sector emissions 121
5.5 Sensitivity Analysis 123
6 Summary and conclusions to chapter IV 128
7 References for chapter IV 131
V. ANALYSIS OF EU ETS IMPACTS ON INVESTMENTS: AN OUTLOOK TO 2030
132
1 Introduction 132
1.1 An ageing European power park and a gateway for the EU ETS to mobilise evolution 132
2 Modelling Approach 135
2.1 Review of approach for modelling the investment decision 135 2.2 National technology-specific policies’ impact on new investment 136 2.3 Time horizon of analysis and interpretation of time of investment 137
2.4 Technologies modelled in the investment decision 138
2.5 Techno-economic assumptions and data used in the model 139
3 Model set up and scenarios 142
4 Results 144
4.1 Impact of carbon price on electricity demand 144
4.2 Expected capacity retirement and new capacity investment 144 4.3 Long term production mix and emissions abatement curve 153 4.4 Impact of lower-than projected renewable penetration on emissions reductions and attainment of
EU targets 158
4.5 Costs 162
5 Summary and conclusions to chapter V 167
6 References for chapter V 169
Annexes to chapter V 171
A. Technologies in Zephyr and their relevance for the investment decision 171
B. Carbon Capture and Storage Technology 181
C. Learning or experience curves and their use in technology cost estimation 182
Doctoral thesis: Suzanne Shaw Page 10
Figure 1: Theory behind the EU ETS cap and trade market for a given compliance period ... 30
Figure 2: Total allocations per sector for the period 2008-10 ... 32
Figure 3: Total emissions by sector for the period 2008-10 ... 32
Figure 4: Typical electricity load curve for a single weekday (20/03/2008) ... 63
Figure 5: Filling of the load curve by merit order ... 64
Figure 6: Exogenous and endogenous variables of the model ... 77
Figure 7: Comparison of the European electricity generation mix for Zephyr vs. EC data (2007 & 2008 ... 86
Figure 8: Comparison of modelled emissions from electricity generation to calculations from data .. 87
Figure 9: Sensitivity testing results – Change in coal production and electricity sector emissions relative to change in CCGT conversion efficiency (Year 2008) ... 88
Figure 10: Sensitivity testing results – Change in coal production and electricity sector emissions relative to change in gas price (Year 2008) ... 90
Figure 11: Sensitivity testing results – Change in total electricity sector emissions relative to change in electricity demand (Period 2005-8) ... 90
Figure 12: Sensitivity testing results – Change in total electricity sector emissions (vs. reference case) as a function of EUA price (Year 2008) ... 91
Figure 13: Median EU27 electricity price as a function of EUA price ... 109
Figure 14: Change in 2012 electricity demand as a result of increased electricity prices resulting from carbon-price pass-through ... 110
Figure 15: Technology mix in production in 2012 at various EUA prices ... 111
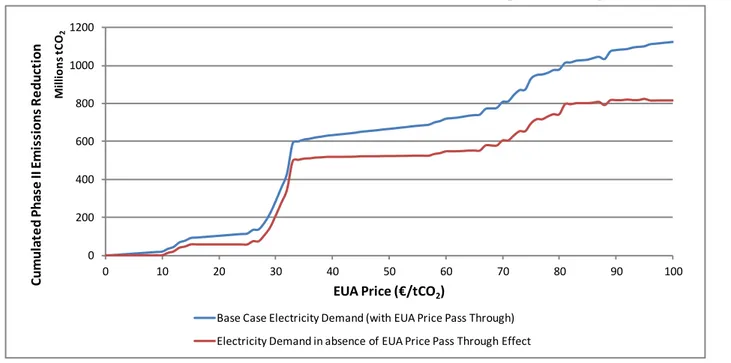
Figure 16: Electricity sector emissions reduction over Phase II – base case, exogenous EUA prices, 0 to 100 €/tCO2 ... 113
Figure 17: Technology mix in production in 2012 with & without German nuclear withdrawal ... 116
Figure 18: EU27 and regional-level Phase II emissions pre- and post- the June 2011 German nuclear withdrawal ... 117
Figure 19: EU27 and regional-level Phase II emissions-price dynamic, pre- and post- the June 2011 German nuclear withdrawal ... 118
Doctoral thesis: Suzanne Shaw Page 11 Figure 21: Technology shares in production for the electricity sector at various EUA prices and for
different demand scenarios ... 120
Figure 22: Impact of increased electricity demand in terms of absolute electricity production per technology (illustration at EUA price of 20 €/tCO2) ... 121
Figure 23: Relationship between EUA pass-through rate and electricity price, demand and emissions ... 123
Figure 24: Reduction in Phase II emissions as a result of reduced electricity demand at various EUA-price pass-through rates ... 124
Figure 25: Coal-substituted production & emissions reductions for Phase II – lower gas prices ... 125
Figure 26: Phase II emissions at lower gas prices compared to the base case ... 126
Figure 27: Sensitivity of Phase II sector emissions to changes in electricity demand ... 127
Figure 28: Phase II emissions according to electricity demand growth rate assumption ... 128
Figure 29: EU27 fossil fuel power park capacity mix ... 133
Figure 30: Electricity demand evolution according to EUA price ... 144
Figure 31: Cumulative investment per technology for the period 2008-30 as a function of carbon price (only for technologies modelled in the investment decision)... 145
Figure 32: New capacity requirements according to load type ... 149
Figure 33: New capacity requirements for each region according to load segment ... 151
Figure 34: Cumulative investment per technology, as a function of carbon price, for each region for the period 2008-30 ... 152
Figure 35: Park capacity mix in 2008 and as projected for 2030 under a least-cost EUA-price dependent investment strategy ... 153
Figure 36: Snapshot of technology mix of production for 2020 (upper graph) & 2030 (lower graph) with least-cost EUA-price dependent investment ... 154
Figure 37: Cumulative (2008-30) electricity sector emissions & reductions with EUA-price dependent investment compared to a static park configuration ... 155
Figure 38: Park capacity mix for 2008 and as projected for 2030 for the static park and under a least-cost EUA price-dependent strategy ... 156
Doctoral thesis: Suzanne Shaw Page 12 Figure 40: Park technology mix in 2030 for the normal model configuration compared to a scenario
where there is 50% less RES capacity; EUA prices of 0 & 80 €/tCO2 ... 159
Figure 41: EUA prices in line with target emissions reductions for the electricity sector for 2030 .... 161
Figure 42: 2030 technology mix in production for the normal model configuration compared to a scenario where there is 50% less RES capacity; EUA prices of 0 & 80 €/tCO2 ... 162
Figure 43: Total production cost in 2030 at various EUA prices, for park mixes based on EUA-price dependent investment effected for various anticipated EUA prices ... 163
Figure 44: EUA price information 2008-12 ... 166
TABLE OF TABLES
Table 1: Technologies of the electricity sector... 62Table 2: Data sources for exogenously defined variables ... 81
Table 3: Characteristics of technologies of the model ... 103
Table 4: Base case model parameters and exogenous variables ... 106
Table 5: Model scenarios ... 107
Table 6: Emissions allowances supply demand balance for electricity sector and overall market .... 113
Table 7: EU ETS Emissions (MtCO2) and market position estimates from various sources ... 114
Table 8: Comparison of emissions and EU ETS position – Base Case vs. Scenario 3 ... 122
Table 9: Illustration of the value of 2008 constant-value EUA prices in future years at a 5% discount rate ... 136
Table 10: Techno-economic parameters used in the model for the analysed technologies – reference year 2008 Sources: (IEA, 2010a); (ECF, 2010); (McKinsey, 2008); (NREL, 2010) ... 141
Table 11: Model parameters for the base case analysis ... 143
Table 12: Merit order of base load technologies with EUA price, for various time horizons ... 147
Table 13: Merit order of intermediate load technologies as a function of EUA price, at various time horizons ... 147
Doctoral thesis: Suzanne Shaw Page 13 Table 15: Basic statistics related to production costs for various EUA-price dependent investment
profiles (in billions of Euros) ... 165 Table 16: Planned nuclear capacity investment (MW) for the model time horizon Sources: (IAEA,
2011), (WNA, 2011), (Capros, 2010) ... 174 Table 17: Projected new renewable energy capacity investment (MW) for the model time horizon 180
TABLE OF BOXES
Box 1: Determining technology mix in power production using the duration load curve ... 66 Box 2: Banking and borrowing in the EU ETS ... 96 Box 3: Experience Curves & Technology Cost Reductions (based on (IEA, 2000)) ... 182
Doctoral thesis: Suzanne Shaw Page 14
SYNTHESE EN FRANÇAIS /
EXTENDED FRENCH SUMMARY
Le système européen d’échange de quotas (SCEQE pour système communautaire d’échange de quotas d’émissions ou, en anglais, EU ETS pour European Union Emissions Trading Scheme) est le principal outil de l’Union européenne (UE) pour réduire les émissions de CO2
des sources stationnaires. Sont couvertes par cette réglementation environ 11,000 installations soit 40% des émissions totales de l’UE (50% des émissions de CO2). L’EU ETS devrait
contribuer à plus de la moitié de l’effort de réduction de l’UE en 2020.
L’EU ETS est un système d’échange de quotas de type « cap and trade ». Le « cap » ou plafond d’émissions, imposé par l’autorité centrale, représente l’objectif environnemental soit la quantité d’émissions globales permises pour toutes les installations couvertes par le système et établit le nombre total de quotas disponible correspondant pour les installations durant une période donnée. Ces quotas peuvent être échangés entre les opérateurs d’installations. Les installations ayant un moindre coût de réduction d’émissions seront donc incitées à réduire plus leurs émissions par rapport aux installations ayant un coût de réduction plus élevé; ces derniers achèteraient les quotas (« European Union Allowances » (EUA)) excédentaires des premiers.
Le prix du quota résulte de la confrontation de l’offre et de la demande provenant des installations couvertes par le système, compte tenu des différents coûts marginaux d’abattement. Ce prix du quota représente le moindre coût nécessaire pour atteindre les objectifs de réduction d’émissions ; puisque les acteurs peuvent échanger leurs quotas, les réductions d’émissions seront réalisées là où le coût est moindre, peu importe l’allocation initiale des quotas. Ainsi, l’EU ETS permettrait d’atteindre les réductions d’émissions à moindre coût.
Le secteur électrique est le secteur le plus dominant dans l'EU ETS, couvrant 39% des allocations de l'EU ETS et 48% des émissions à ce jour dans la phase II. Les objectifs de réduction d’émissions (EC, 2011) au niveau sectoriel sont de -54% à -68% d'ici 2030 (par rapport aux niveaux de 1990) pour le secteur électrique à lui seul, comparativement à une réduction de -34% à -40% demandée pour l'ensemble de l'industrie (pour tous secteurs, EU
Doctoral thesis: Suzanne Shaw Page 15 ETS et non-EU ETS confondus). Le secteur électrique aura sans aucun doute un rôle déterminant sur les niveaux d’émissions, ainsi que les réductions relevant de l'EU ETS, et donc un rôle décisif dans la réalisation des objectifs. En tant que tel, il est important d'être en mesure de comprendre la réaction de ce secteur face au prix de l'EUA, à la fois à court terme et à long terme (investissement). A court terme, les émissions (réductions) du secteur dépendent des coûts (marginaux) de production. Le signal-prix du carbone de l'EU ETS représente un coût de production marginal supplémentaire pour les technologies carbonées, et peut modifier l'ordre du mérite dans le parc existant, en faveur des technologies moins émettrices en carbone. A long terme, le prix du carbone de l'EU ETS représente un coût (variable) de production supplémentaire, qui peut changer le classement des technologies en termes de coût total de l’investissement (et donc le choix d’investissement), en faveur de celles qui ont une moindre intensité en carbone. Ceci aurait comme effet de changer le mix technologique du parc existant vers un mix moins émetteur.
Nous sommes donc confrontés à deux points d'intérêt, qui viendront compléter les travaux existants dans le domaine : la réaction ou dynamique des émissions à court terme du secteur électrique face à un prix de carbone, en fonction d’un parc de production (mix technologique) fixe ; et la réaction ou dynamique des émissions du secteur à long terme, face à un prix de carbone, où les choix d'investissement peuvent changer la composition du parc.
Dans cette optique, cette thèse traite plusieurs questions de recherche. La première question est: quelles sont les dynamiques à court terme dans le secteur électrique en réaction à un signal-prix du carbone de l'UE ETS? Et, ainsi, que pouvons-nous attendre en termes d'émissions (et en termes de réductions d’émissions) à court terme et quelles sont les implications en ce qui concerne la conformité pour la Phase II. Ici, l'analyse se concentre sur la phase II en cours de l’EU ETS, où le parc technologique est largement « statique ». Le secteur, en fonction du prix du carbone, décide de son mix technologique de production, ce qui détermine en conséquence ses émissions. Le prix du carbone viendrait inciter des basculements entre technologies d’intensité en émissions différente. Dans le cadre d’une perspective à court terme on s’intéressera également à la question suivante : quel est l'impact des décisions soudaines qui ont pour effet de changer la configuration du parc à court terme, à savoir l'impact de la décision de l'Allemagne, d'un jour à l'autre, de retirer 8 GW de capacité nucléaire de son parc de production électrique?
Doctoral thesis: Suzanne Shaw Page 16 La deuxième question est: quelles sont les dynamiques à long terme dans le secteur électrique en réaction à un signal-prix du carbone de l'UE ETS? Et, par conséquent, quelle est l'efficacité potentielle de l’EU ETS en tant qu'instrument de réduction des émissions pour ce secteur. Ici, l'analyse se concentre sur la période à l'horizon 2030, et enquête sur les choix d'investissement qui se dégagent en fonction du signal-prix du carbone. Ceci permet ensuite d’étudier les changements dans le mix technologique du parc, qui déterminera en fin de compte le mix de production du secteur et donc ses émissions (abattements) au fil du temps.
Les questions ci-dessus sont traitées à travers l'utilisation d'un modèle. Ce modèle a été développé pour représenter les choix technologiques dans la production et dans l'investissement dans le secteur électrique en fonction de son anticipation et sa réaction de minimisation du coût face à un prix de carbone; les émissions (abattements) sont le résultat direct de ces choix technologiques.
Le modèle contient une représentation technico-économique du secteur électrique, classé en fonction de 30 technologies, dont 11 sont considérées indépendantes du prix de l’EUA (technologies nucléaires, renouvelables et de cogénération, en raison de la forte influence des politiques nationales et des subventions sur les coûts de ces technologies) lors de la modélisation des choix de production et d'investissement ; les 19 autres dépendent du prix de l’EUA. En outre, le secteur électrique est représenté géographiquement par quatre régions. A court terme, les émissions (abattements) sont calquées sur le principe de minimisation des coûts marginaux de production ; le prix de l’EUA inciterait des basculements entre des technologies d'intensités en émissions différentes (ces technologies étant déjà dans le parc qui reste statique). A long terme, les émissions (abattements) sont modélisées, également sur la base d’une minimisation des coûts de production, mais cette fois en tenant compte de l'évolution du parc qui résulte des choix d'investissement au fil du temps. Les choix d'investissement sont aussi basés sur le principe de minimisation des coûts, mais en prenant le coût total (et non marginal) lié à l’investissement sur la durée de vie de chaque technologie, en utilisant l'analyse des flux de trésorerie et en tenant compte du prix de carbone. Par ce biais, on verra potentiellement l'émergence de nouvelles technologies bas-carbones, tel que la CSC (capture et séquestration de carbone), face à un prix du carbone, et donc un changement dans le paysage de production d'électricité.
Doctoral thesis: Suzanne Shaw Page 17 Les résultats de ce travail sont des courbes d’émissions en fonction du prix du carbone i.e. des courbes de coût marginal d’abattement. Ces courbes sont à la base des analyses d’émissions du secteur, en réaction à différentes hypothèses de prix du carbone, et la possibilité que le secteur atteigne les objectifs de réduction d’émissions visés.
En ce qui concerne les résultats du travail, le modèle calibré a produit des résultats raisonnables par rapport aux données vérifiées pour 2007 et 2008, bien que les résultats se montrent sensibles à la demande d'électricité, et, dans le court-terme, aux prix relatifs du charbon et du gaz.
L'application du modèle à court terme (Phase II de l’EU ETS) montre que deux facteurs principaux sont à l'œuvre dans la dynamique émissions-prix: 1) la baisse de la demande en électricité (et donc des émissions), conséquence de l’augmentation du prix de l’électricité due à la transmission du prix de l'EUA dans le prix de l’électricité et 2) le changement dans l’ordre de mérite en faveur des technologies moins émettrices en carbone (gaz, mais aussi biomasse) avec l’augmentation du prix de l’EUA. L'impact le plus significatif en termes de basculements entre technologies est celui du charbon vers le gaz, un basculement qui se fait progressivement sur une bande de prix (d’une ampleur de 10 €/tCO2) et non à un prix unique
comme souvent perçu par les acteurs du marché. En outre, les résultats du modèle corroborent les estimations générales du marché d'une phase II longue en quotas (l’allocation en quotas excédant les émissions vérifiées des acteurs). Cependant, malgré l’excédent de quotas alloués sur la phase, les résultats du modèle indiquent que les abattements dans le secteur électrique sont guidés par des anticipations à long terme, où l'objectif de réduction sera certainement plus strict, et par l'incertitude quant aux coûts de réduction des émissions futures. Ce potentiel d’abattement pourrait aller jusqu’à 100 Mt de CO2 avec un prix du carbone autour de 10
€/tCO2 et jusqu’à 500 Mt de CO2 pourrait s’ajouter puisque le gaz devient plus compétitif
que le charbon (plus émetteur) aux alentours de la barre des 20 €/ tCO2.
La dynamique de court terme des émissions du secteur électrique a été clairement affectée par la récente décision allemande de retirer 8 GW de capacité nucléaire du parc de production. La situation a abouti à une augmentation de la production à partir des énergies fossiles et en conséquence à une baisse à court terme (Phase II) de la courbe d’abattement. Ainsi, avec le retrait de ces 8 GW de capacité nucléaire, il faudrait un prix d’EUA plus élevé pour atteindre n'importe quel niveau de réduction d’émissions, par rapport à la situation antérieure.
Doctoral thesis: Suzanne Shaw Page 18 Le potentiel de réduction du secteur électrique à court terme est cependant limité par la nature quasi-statique du parc (en termes de mix technologique). Atteindre de plus importantes réductions d’émissions à plus long terme, en ligne avec les objectifs de l'UE, exigerait d'apporter des modifications dans le parc, qui ne peuvent être réalisées que grâce à l'investissement.
L'application du modèle à long terme (jusqu'en 2030) montre les technologies qui émergent pour différentes anticipations du prix de l’EUA et comment le mix globale du parc, le mix de production, et le profil des émissions du secteur évoluent au fil du temps. Les résultats montrent que, indépendamment du prix des quotas, le CCG (cycle combiné à gaz) est la technologie dominante pour l'investissement dans de nouvelles capacités d'ici à 2030. Les circonstances régionales jouent un rôle dans le résultat global : les besoins en nouvelles capacités de l'Europe occidentale (Allemagne, France et Italie en particulier) dominent l’investissement global au niveau de l'UE. Parallèlement, les résultats montrent que le prix des EUA jouent un rôle en rendant plus attractif à l’investissement les technologies moins émettrices en carbone (par rapport aux turbines à base de charbon qui est la technologie la moins cher sans prix de carbone), telles que le CCG et la turbine à base de la biomasse. Un prix de carbone facilite également l'émergence de la CSC. L'impact est également évident dans le mix de production, où les investissements dans le CCG, la production à base de la biomasse et la CSC, se manifestent dans le mix de production à moindre coût. L'effet net du prix du carbone est un décalage vers le bas de la courbe d’émissions de long terme du secteur (soit un déplacement vers le haut de la courbe de réduction des émissions) par rapport à la situation à court terme où le mix technologique du parc ne change pas. Ainsi, dans le long terme, pour n'importe quel prix d’EUA donné, des niveaux plus élevés de réduction peuvent être obtenus avec une stratégie d'investissement qui tient compte du prix de l’EUA versus une stratégie où le mix technologique du parc actuel est maintenu.
Une limitation importante des analyses réside dans les hypothèses formulées au sujet des politiques en matière d'énergies renouvelables. Ces politiques favorisent l'investissement dans les moyens de production d’électricité à partir des sources d'énergies renouvelables (SER) et donc se chevauchent, ou « assistent » la politique de l’EU ETS dans l’atteinte des réductions d’émissions du secteur électrique. En fait, les résultats montrent que l'investissement dans les SER prévu à l'horizon 2030 (introduit de manière exogène dans le modèle) joue un rôle important dans les réductions d'émissions réalisables au cours de cette période. Toutefois, il
Doctoral thesis: Suzanne Shaw Page 19 n'est pas certain que les politiques actuelles pour la promotion des SER continueront à exister indéfiniment ; en effet une modélisation endogène de l'investissement dans les énergies renouvelables, en fonction du prix de l’EUA, serait éventuellement une approche plus pertinente à l'avenir.
Enfin, en termes de conséquences de l'incertitude des prix futurs de l’EUA sur le risque perçu par le secteur électrique, les résultats montrent que le coût de l'erreur associée à l'adoption d'une stratégie d'investissement basée sur un prix d’EUA élevé serait très élevé si les prix des quotas observés jusqu’à présent pour la phase II perdurent à long terme. Pourtant, une stratégie d'investissement basée sur un prix d’EUA relativement faible ne serait pas compatible avec la réalisation des objectifs de réduction d’émissions du secteur, et comporte également un risque car la crise économique, en large partie responsable pour les prix faibles observés jusqu’à ce jour, ne durera pas indéfiniment.
Doctoral thesis: Suzanne Shaw Page 20
I. INTRODUCTION
1 GENERAL CONTEXTThe European Union Emissions Trading Scheme (EU ETS) is the EU’s major tool for achieving emissions reductions from point sources – it covers 11,000 installations representing 40% of EU’s total greenhouse gas (GHG) emissions (50% of EU CO2
emissions). The EU ETS is targeted to contribute over 50% to the region’s overall 2020 emissions reduction effort2.
The EU ETS is a typical “cap and trade” permit market. The cap, as set by the regulatory authority, represents the environmental goal for requisite global emissions of all installations covered by the permit system, and dictates the total number of permits available to installations, over a given period. These permits can be traded amongst installations. Installations with lower abatement costs are thus incited to effect greater emissions reductions compared to those with higher abatement costs, as they can sell corresponding surplus permits to the latter, who find it less costly to buy permits than abate. The resulting permit price, the European Union Allowance (EUA) price, depicts the confrontation between overall permit supply and total demand of covered installations, taking into account marginal abatement costs of each installation. This permit price represents the lowest price for achieving emissions reductions in line with the envisaged environmental target: since actors have the ability to trade permits, economics indicate that reductions will take place where they cost the least, irrespective of initial permit allocation. The EU ETS, in that respect, is intended as an instrument for achieving required emissions reductions (compliance) at least cost.
The crux of the EU ETS is to incite permanent emissions reductions – with the emphasis being on emissions reductions “at home” – coherent with a defined reduction target, in an economically efficient manner, through the creation of a price for greenhouse gas emissions.
2 The EU has a greenhouse gas emissions (GHG) reduction objective of 20% reduction in 2020 compared to
1990 levels. With total EU27 GHG emissions in 1990 at 5,572 Mt ((EEA, 2008) Table 8A), this means a target GHG emission reduction of 1,114 Mt is required. An (in-house) estimated 624 Mt in emissions reductions is to be achieved by the EU ETS, which represents roughly 56% of the total reduction objective.
Doctoral thesis: Suzanne Shaw Page 21 Achieving the reduction objective3 will require the implementation of significant abatement measures by operators within the sectors concerned.
The electricity sector is the single most important EU ETS sector as far as achieving emissions reductions are concerned. It is the most dominant sector in the EU ETS, covering 39% of EU ETS allocations and 48% of emissions so far in Phase II. Policy targets (EC, 2011) indicate a sectoral reduction objective of 54%-68% by 2030 (compared to 1990 levels) for the electric power sector alone compared to 34%-40% reductions for all of industry (including ETS and non-ETS industrial sectors). The electricity sector will clearly have determinant role in EU ETS emissions and emissions reductions, and thus a decisive role in the attainment of targets. As such, it is important to be able to understand the reaction of the sector to EUA or carbon permit prices, both in the short-term and in the long-term (investment). In the short-term, emissions (reductions) of the sector are dependent on production economics or marginal costs of production. The EU ETS carbon price signal represents an additional marginal production cost, and can change the merit order of technologies in the existing park, in favour of lower-emitting technologies. In the long-term, the EU ETS carbon price represents an additional lifetime production cost which impacts the economics of investment, and which can act so as to change the technology mix of the existing park in favour of less carbon-intensive technologies. We are therefore faced with two focal points of interest, which will supplement existing work in the field: the sector’s reaction to an EU ETS price in the short-term, based on a relatively fixed park configuration, and resulting emissions dynamics; and the sector’s reaction to an EU ETS price in the long-term, where investment choices can change the park landscape, and resulting emissions dynamics.
2 RESEARCH QUESTIONS
The questions sought to be answered by this doctoral thesis are multi-faceted.
The first question is: what are the short-term dynamics at work in the electricity sector in reaction to an EU ETS carbon price signal? And, thus, what can we expect in terms of emissions (abatement) options in the short-term and implications for compliance for Phase II. Here, the analysis focuses on the current Phase II of the EU ETS, which effectively operates with a “static” park, and which decides on its technology mix in production, and consequently
3
The objective of the EU ETS is to achieve a 21% reduction in emissions of covered installations in 2020, compared to 2005
Doctoral thesis: Suzanne Shaw Page 22 its emissions, as a function of carbon price (amongst other things) which produce switching between technologies of varying emissions intensities. Related to the short-term perspective is: what is the impact of sudden decisions which impact the short-term park configuration, namely the impact of Germany’s decision, from one day to the next, to withdraw 8 GW of nuclear capacity from its power production park?
The second question is: what are the long-term dynamics at work in the electricity sector in reaction to an EU ETS carbon price signal? And, consequently, what is the potential effectiveness and efficiency of the EU ETS as an emissions reduction instrument for this sector. Here, the analysis focuses on the period to 2030, investigating the investment choices which emerge as a function of the carbon price signal, and thus the changes in park configuration, which ultimately determines the sector’s production mix and emissions (abatement) profile over time.
3 METHODOLOGY
The questions above are analysed through the use of a model. A model has been developed to represent technology choices in production and investment in the electricity sector according to its anticipation of and least-cost reaction to an EU ETS carbon price; emissions (abatement) are a direct result of these technology choices.
The model contains a techno-economic representation of the electricity sector, categorised according to 30 technologies, 11 of which are considered EU ETS price-independent (nuclear, renewable and CHP technologies, due to the heavy influence of national policies and subsidies) when modelling production and investment choices, the remaining 19 being EU ETS-price dependent. In addition, the electricity sector is geographically categorised according to four regions.
In the short-term, emissions (abatement) is modelled on the principle of minimisation of production costs, which will produce switching between technologies (already in place in the park), of varying emissions intensities, in reaction to carbon prices (which are made to vary). In the long-term, emissions (abatement) is modelled, also on the basis of least-cost production, but this time taking into account an evolving park which results from investment over time. Investment – also based on the principle of minimisation but of lifetime costs (investment and production) costs, using discounted cash flow analysis – will potentially see
Doctoral thesis: Suzanne Shaw Page 23 the emergence of lower-emitting technologies, such as CCS, in reaction to a carbon price, and thus a change in the electricity production landscape.
The result is therefore short- and long- term emissions curves, as function of carbon price. These emissions curves are the basis for studying the sector’s emissions in reaction to various hypotheses on EU ETS carbon prices, and the likelihood of attaining compliance and/or emissions reductions targets.
4 RESEARCH SCOPE, LIMITATIONS, AND LINKS WITH OTHER RESEARCH ACTIVITIES
The Climate Economics Chair is developing a new model (called Zephyr), to model carbon emissions permit demand and supply in the EU ETS. The work of this thesis has been, in the first instance, the development of the overall approach of the Zephyr EU ETS supply-demand model and the specific representation and implementation of the electricity sector module to simulate the relationship between this sector’s emissions and EU ETS carbon prices. In the second instance, the work of this thesis has been the application of the electricity module to conduct short- and long- term analyses of electricity sector emissions reductions, in light of prevailing policy circumstances and EU goals.
As the focus is on electricity sector, investment/production decisions and emissions (abatement) of the non-electricity sectors are not explicitly modelled or analysed, rather, when necessary (for example for a global analysis covering all EU ETS sectors vs. electric power sector only), they are entered into the model exogenously. Clearly non-electricity sectors’ actions will also impact EU ETS dynamics, but the objective is to isolate those dynamics and interactions which relate solely to the electricity sector actions. Representation of the emissions of non-electricity sectors is an ongoing activity of the Chair, which is being developed in a dedicated non-electricity sector module, and it is envisaged to link these modules in future modelling exercises.
In terms of its analysis of EU ETS-based decisions in the electricity sector, the interest of this work lies in analysing the strategic decisions made by way of abatement, that is: the production decision (which embodies short-term abatement); and the investment decision (which embodies long-term abatement). This means that hedging strategies related to banking, borrowing and use of Kyoto credits are not explicitly modelled in this work,
Doctoral thesis: Suzanne Shaw Page 24 however, a module called Zephyr-FLEX is being developed at the Chair to look at these issues and will be linked in the future.
As we are interested in actions at the level of the electricity sector as a whole, not the individual installations which comprise it, production and investment strategies at the level of the individual installation or plant are not analysed. The electricity sector is treated as a single agent at the micro-economic level.
In addition, we analyse the EU ETS market from the point of view of compliance or attainment of sector-specific targets at least-cost, not financial opportunity; strategies related to speculation and financial arbitration are therefore not part of the study. Moreover, compliance is defined according to the current EU ETS legislation and scope, as such, no consideration is given to hypothetical linking of the EU ETS with other international permit systems (beyond that which occurs de facto as a result of Kyoto credits’ use), nor to alternative modalities for the EU ETS, such as sectoral targets.
The strategies and resultant emissions of the electricity sector feedback to the EU ETS system, via the permit demand, and therefore influence EU ETS carbon prices. This feedback system is not modelled in the scope of this work, however the emission (abatement) results/curves, and technology choices for new investment provide input to an EUA price determination module being developed within the Zephyr-FLEX4 module previously mentioned. It is envisaged to link these two modules in the future.
5 THIS WORK COMPARED TO PREVIOUS WORK IN THE FIELD
The analyses covered by this research pertain to two distinct, albeit linked, systems: the EU ETS permit market and the electricity sector market.
A large body of work exists on the dynamics of EU ETS systems, from both the point of view of financial returns (not treated here) as well as that of underlying supply-demand (compliance) fundamentals, as we are concerned with here. This body of work relies on econometrics, and includes work by Mansanet-Bataller et al (2007) and Alberola et al (2008), which model pure price dynamics, as well as that by authors, such as Fehr and Hinz (2006) and Siefert et al (2008) which also model emissions in an intermediary step. The focus of this
4 Dynamic (annual) market price resolution of the model will be effected in the Zephyr-FLEX module; the
market price is the modelled the result of balancing overall permit supply with demand, using the derived emissions (abatement) curves for the various sectors, while taking into account the impact of flexible mechanisms on both demand and supply sides at each annual time step.
Doctoral thesis: Suzanne Shaw Page 25 thesis differs from the first set of work mentioned as it is on the emissions-carbon price dynamics, with equilibrium prices modelled in a separate step (via the previously mentioned Zephyr-FLEX module). It also differs from the second body of work in that the approach used to model emissions is an endogenous techno-economic one rather than an exogenous long-term emission function, which in the case of Fehr and Hinz (2006) is coupled with short-long-term fuel switching. These models therefore lack the level of technological detail required for developing short- and long- term reaction curves for the electricity sector.
Equally, a large body of work exists on the modelling of electricity (and, more generally, energy) systems, including optimisation models and energy system models. However, these models have a different (larger) scope which embraces larger macro-economic aspects and interactions with international markets. This work, on the other hand, isolates the interactions between EU ETS prices and electricity sector production and investment decisions. Moreover, this is done specifically for the short- and medium- (20-year) time horizon versus the long term time horizons (30-50 years of more) typically treated in optimisation and energy system models.
6 MAIN RESULTS
The calibrated model produced reasonable results compared to verified data for 2007 and 2008, although the results are shown to be sensitive to electricity demand, and, in the case of the short-term, relative coal and gas fuel prices.
Application of the model to the short-term (Phase II of the EU ETS) show that two main factors are at work in terms of emissions-price dynamics: the downward push on demand (and thus emissions) from the pass-through of EUA prices to electricity prices; and the change in technology preference (merit order) from coal-based to lower-emitting gas-based, but also biomass-based, technologies with increasing EUA prices. The most significant impact from technology-switching on the emissions-EU ETS price dynamic is from coal-gas switching, which occurs progressively over a specific EUA price band (of width 10 €/tCO2) versus at a
single “switch price” as is often quoted by market actors. Furthermore, the emissions results of the model corroborate general market estimations of a long5 Phase II, but indicate that there is still some abatement taking place in the electricity sector, as actors are guided by longer
5
The term “long” with reference to one or more Phases or EU ETS periods indicates an oversupply of emissions permits compared to the demand for permits.
Doctoral thesis: Suzanne Shaw Page 26 term anticipations, where the emissions reduction objective are almost certain to be stricter, and by uncertainty as to future abatement costs and needs. Indications from the model results are that this abatement could easily be as much as 100 MtCO2 at carbon prices around 10
€/tCO2 and most likely more, up to an additional 500 MtCO2, since lower emitting gas-based
technologies increase in competitiveness and merit order preference , compared to coal-based technologies, at around the 20 €/tCO2 mark.
The short-term emissions-price dynamic of the electricity sector has clearly been impacted by the recent German decision to withdraw 8 GW of nuclear capacity from service. The situation has resulted in increased production from fossil-based capacity and a consequent downward shift in the short-term (Phase II) emissions abatement curve of between 50 and 80 MtCO2.
Thus, with the withdrawal of some of the German nuclear capacity, achieving any given level of abatement would require a higher EUA price.
The abatement potential of the power sector in the short-term, however, is limited by the existing technology configuration of the park. Achieving higher levels of emissions reductions over the longer term, in line with EU targets, requires making changes in the power park, which can only be realised through investment.
Application of the model to the longer term (to 2030) shows the technologies which emerge under various EUA-price anticipations, and how the overall park capacity mix, production mix, and emissions profile of the sector change over time. The results show that, irrespective of EUA prices, CCGT is the dominant technology for new capacity investment to 2030 as it is the most favourable option for intermediate load requirements, which dominate new capacity needs for the period. Regional circumstances are shown to play a role in the overall outcome: investment capacity needs of central Europe (Germany, France, and Italy in particular) dominate the overall investment mix at EU level. At the same time, the results show that EUA prices do play a role in shifting the investment technology preference away from higher-emitting technologies such as coal towards lower-higher-emitting ones, such as CCGT and biomass, and facilitates the emergence of CCS-based coal technology. The impact is also to be seen in the production mix, where the investments in CCGT, biomass and CCS-based coal all manifest themselves in the least-cost production mix. The resulting impact is a shift downwards in the overall long-term emissions-price curve of the sector (or an upward shift in the emissions abatement curve) compared to the short-term which is based on a “static” park. Thus, in the long term, for any given EUA price, greater levels of abatement can be achieved,
Doctoral thesis: Suzanne Shaw Page 27 with an EUA-price dependent investment strategy compared to the situation where park technology mix does not evolve.
An important limitation of the analyses lies in the assumptions made regarding renewable energy policies, which promote investment in renewable energy sources (RES) and thus overlap, or “assist”, in electricity sector emissions reductions. In fact, the results show that the expected (exogenously entered) investment in RES to 2030 plays a large role in the achievable emissions reductions over that time period. However, it is not certain that current RES policies will continue to exist indefinitely, and indeed endogenous EU ETS-price dependent modelling of investment in RES may be a more relevant approach in the future. Finally, in terms of the implications of uncertainty regarding future carbon prices on the risk perceived by the electricity sector, the results show that the cost of error associated with adopting an investment strategy based on a high EUA price would be very high if long-term EUA prices maintain the levels seen over the current Phase. At the same time, investment strategies based on the relatively low EUA price seen to-date would not be consistent with the attainment of EU ETS or sector reduction targets, and would open up the sector to greater cost risk in the case where the economic situation in the future differs (improves) compared to that which Europe has been experiencing since 2008.
7 STRUCTURE OF THE DOCUMENT
The work is divided into three parts, in line with the above-mentioned objectives. In the first part, a methodology is developed, and a modelling tool is implemented, to represent interactions between the two systems concerned: EU ETS and the European electricity production sector. The second part of the work involves the application of the modelling tool, for the Phase II period of the EU ETS, to analyse the short-term dynamics within the two systems. Namely, we look at the impact of EU ETS carbon prices on the least-cost technology mix of electricity production, and thus on EU ETS emissions for the sector, for a given power park configuration. Here, we are able to study the short-term6 emissions (abatement) curve that results for the electricity sector, operating with varying carbon price signals. We use the resulting EUA price-electricity sector emissions reaction curve, together with the information on the EU ETS market situation, to analyse the coherence of the electricity sector’s reaction under current circumstances, and explain possible incoherencies. We also use this as a basis to
Doctoral thesis: Suzanne Shaw Page 28 surmise the impact and adequacy of the EU ETS as a short-term price signal/policy. In the third part, the model is applied to a longer term time horizon (to 2030) to investigate the impact of EU ETS prices on electricity technology economics and the sector’s least-cost choices for new investment; in so doing, we develop the long-term emissions (abatement) curve. Here, the abatement curve captures, in addition to the short-term production choices, the effects of evolution of the park technology mix. As, such, we examine the impact and adequacy of the EU ETS as a long-term emissions reduction policy instrument, and the potential cost and risk implications for the electricity sector which must integrate a carbon price into its investment decision, but which is faced with carbon price uncertainty.
The document is composed of five chapters. The following chapter (II) contains a literature survey of existing models and their contribution to the field of EU ETS policy analysis, as well as their relevance in the context of the research being undertaken here. It also highlights the contribution of the Zephyr model, and its electricity sector module in particular, compared to other models discussed. Chapter III gives a detailed technical and mathematical description of the model developed in the context of this PhD thesis – the Zephyr model, and specifically, the electricity sector module. Chapter IV looks at the application of the electricity sector simulation module to perform a partly ex-post and partly current analysis of EU ETS-electricity sector interactions in Phase II of the EU ETS; giving a short-term perspective. Chapter V provides an outlook to the longer term, to the end of an envisaged Phase IV (2030), looking at the technologies that are likely to play a role in the evolution of the power park. These technologies analysed in Chapter VI where the electricity sector module is applied to determine electricity sector investment portfolios to the 2030 time horizon, in accordance with carbon price anticipation, and as such the potential for power sector emissions reduction under the current EU ETS framework. Finally, a concluding chapter summarizes the main scientific findings of the work and makes policy recommendations.
Doctoral Thesis: Suzanne Shaw 29
II. LITERATURE REVIEW
1 CONTEXT1.1 Background to the EU ETS
The European Union Emissions Trading Scheme (EU ETS), created in 2003 ((EC, 2003); (EC, 2009)) and implemented in 2005, is the first and largest international trading system for greenhouse gas (GHG) emissions in the world. The EU ETS is a typical permit market, based on “cap and trade”7
(refer to Figure 1). The “cap”, as set by the regulatory authority, represents the environmental goal for requisite global emissions of all sources (installations8) covered by the permit system, and dictates the total number of permits available to installations, over a given period. These permits can be traded amongst installations. Installations with lower marginal abatement costs are thus incited to effect greater emissions reductions compared to those with higher marginal abatement costs, as they can sell corresponding surplus permits to the latter, who find it less costly to buy permits than abate. The resulting permit price (in the case of the EU ETS, this is the European Union Allowance (EUA) price) depicts the confrontation between overall permit supply and total demand of covered installations, taking into account marginal abatement costs of each installation (lines A, B in Figure 1). The optimal outcome as depicted in Figure 1 assumes absence of transaction costs and no barriers to trading.
The underlying economic basis of the permit market as described by Figure 1 is that of perfect competition, which assumes that no single actor has the power to significantly influence supply-demand balance, that is, all actors are price takers. This also supposes that actors cannot collude in the market to influence demand-supply equilibrium and hence prices. With the electricity sector as a whole having the majority of permits, and the composition of the sector of reasonably large companies one may question the plausibility of such an assumption, and the choice of a competition-based representation rather than some other market structure, such as Cournot. Initial studies estimate that market power is not a feature of the EU ETS
7
Another type of permit market is “baseline and credit”, wherein a producer can only generate emissions credits for trade on the permit market if s/he reduces his emissions beyond a set baseline level of emissions.
8
“Installation” according to (EC, 2003) is a stationary technical unit where one or more activities listed in Annex I of (EC, 2009) are carried out, and any other directly associated activities which have a technical connection with the activities carried out on that site and which could have an effect on emissions and pollution
Doctoral thesis: Suzanne Shaw Page 30 ((Svendsen and Vesterdal, 2002); (Siefert et al, 2008)), and as such full competition is taken to the underlying market structure assumption.
Figure 1: Theory behind the EU ETS cap and trade market for a given compliance period
III II
EUA Allocation per Sector
Actual Emissions of A Actual Emissions of B
EUAs bought by B EUAs sold by A
Equilibrium EUA Price B’s marginal cost to
reduce emissions to his EUA allocation level A’s marginal cost to reduce emissions to his
EUA allocation level
B Marginal Abatement Costs (€/t CO2) Emissions (t CO2) A I V IV TRADE A->B
Notes: Consider that the market is composed of two installations, each allocated the same number of
initial emission permits for a given compliance period. The combined allocation of the two installations is the global emissions cap (for simplicity the use of Kyoto credits is not taken into account here). Equilibrium, assuming compliance, requires total emissions (installation A + installation B) to be equivalent to the global cap. Installation A has lower marginal abatement costs than installation B. It is advantageous for A to reduce its emissions beyond the level prescribed by its individual permit allocation, so as to sell them to B, which finds it more advantageous to buy the permits liberated from A, as long as they are at a price below its own marginal abatement cost. At equilibrium, the marginal abatement cost of the last unit of emissions reduction is the price at which EUAs are traded – the equilibrium EUA price – and the collective emissions of installations A and B is equivalent to the global cap. In terms of total costs, in the case of no trading, the total costs for A and B for compliance are given respectively by the areas beneath the slanted lines A and B (starting at I) and the vertical line at II. When trading is allowed between A and B, the total cost to B is reduced to the area between the slanted line B and the vertical line at III, plus the cost of the EUAs it buys; this means that total savings to B from being able to trade is the area given by the triangle II-III-IV. At the same time, A reduces its emissions beyond the allocated amount to the point at V, incurring a total additional cost represented by the area between section IV-V of the slanted line A and the horizontal axis, but gains in the process the revenues from selling the additional generated EUAs to B; thus a net total revenue corresponding to the area of the light grey square above section IV-V of the slanted line A. The optimal solution assumes no barriers to trade and absence of transaction costs.
Approximately 11,000 installations9 fall under the EU ETS, which currently spans the period 2008-202010. The scheme incorporates a number of flexibility mechanisms with a view to
9
Installations covered by the scheme include combustion plants, oil refineries, coke ovens, iron and steel plants, production facilities for cement, glass, lime, brick, ceramics, pulp and paper; all over a certain capacity
Doctoral thesis: Suzanne Shaw Page 31 lowering the cost of compliance for installations. These are: banking and borrowing (refer to Box 2, in Annex) 11, and the linking of the EU ETS credits with so-called Kyoto credits enabling installations to cover a limited proportion of their emissions with emission reductions achieved outside the EU (EC, 2004).
Central to the EU ETS and the system of cap and trade is the creation of a price signal for each unit of CO2 emitted to the atmosphere. By having a price attached to it, carbon dioxide
emission is treated as any other market good used in the production process, in that its cost must be taken into account production and investment decisions. The link between policies and action is thus via the carbon price: carbon prices, impact actor decisions which impact emissions (measuring attainment of the objective) which in turn impact carbon prices, and so on. The complex network of interactions and feedbacks between policies, actor decisions and prices, is best represented using a model. A model is a representation designed to show the workings of (or simulate) a system. The Climate Economics Chair is developing a model (called “Zephyr”) to represent these interactions.
1.2 The case of the electricity sector
The electricity sector has been singled out as one of the first pillars for development and analysis in the Zephyr model, due to its important role in EU ETS price formation: it is the most dominant sector in the EU ETS, covering 39% of EU ETS allocations and 48% of emissions so far in Phase II (refer to Figure 2 and Figure 3 respectively), and was by far the most active sector in cross-border EUA market trades during the first Phase (Trotignon and Delbosc, 2008).
Moreover, it is the single most important EU ETS sector as far as achieving emissions reductions is concerned: (EC, 2011) envisages sectoral reductions of 54%-68% by 2030 (compared to 1990 levels) for the electric power sector alone compared to 34%-40% reductions for all of industry (ETS and non-ETS industrial sectors together).
threshold. Annex 1 of the Directive (EC, 2009) gives a full list of the categories and types of installations
covered by the EU ETS
10 The EU ETS legislation so far defines three distinct compliance periods, or Phases: Phase I (which was a “trial”
Phase): 2005-2007, Phase II: 2008-2012 and Phase III: 2013-2020. The EU ETS is expected to be extended to at least 2030 (http://ec.europa.eu/clima/policies/ets/cap/index_en.htm ).
11
In the initial trial Phase (Phase I), banking as well as borrowing was limited to within the Phase, that is, no banking was allowed between the consecutive years covering the end of Phase I and the start of Phase II i.e. years 2007 and 2008.
Doctoral thesis: Suzanne Shaw Page 32
Figure 2: Total allocations per sector for the period 2008-10
Electricity production 39% Rest of combustion 26% Refineries 8% Coke ovens 1% Metal ore 1%
Iron and steel 9% Cement 11% Glass 1% Ceramics 1% Opt-in 1%
Paper and board 2%
Figure 3: Total emissions by sector for the period 2008-10
Electricity production 48% Rest of combustion 24% Refineries 8% Coke ovens 1% Metal ore 1%
Iron and steel
6% Cement8%
Glass 1% Ceramics
1% Opt-in1%
Paper and board 1%
The electricity sector also lends itself to analysing the effectiveness of the EU ETS as a carbon abatement policy instrument in both the short- and the long- term. Firstly, non-electricity sectors have much less short term abatement potential, and short of reducing production, emissions reduction opportunities in the short-term are extremely limited; assessing real abatement from the EU ETS, and thus its effectiveness as a policy instrument in
Doctoral thesis: Suzanne Shaw Page 33 the short-term, would not be particularly meaningful if based on these sectors. Secondly, the electricity market is primarily a regional one – for technical and economic reasons, regional electricity demand is almost fully dependent on and must be met by regional electricity production. There is thus no issue of decreased output or relocation of electricity sector production, compared to non-electricity sectors where the effect can be much more pronounced; this facilitates the analysis of the EU ETS as a policy abatement instrument, since there is no additional issue of carbon leakage to take into account. Furthermore, the electricity sector, largely as a consequence of this previous fact, which highlights the sector’s limited vulnerability to international competition, the electricity sector is the only sector in which auctioning will be the rule rather than the exception, as of 2013. Thus, for the power sector more than any other, the impact of EU ETS policy and ensuing carbon prices is a direct one applicable to all emissions (rather than simply excess emissions), making the impact that much more tangible and measurable. Finally, the characteristics of the electricity sector facilitate isolation and analysis of interactions between the EU ETS policy (prices) and actor decisions/emissions, namely: it has a single, homogenous product (something which cannot equally be said for many industry sectors, for instance the steel sector); it has a single emissions-production process (fuel combustion, compared to industry sectors which also have process emissions); the level of data available for the sector enables a study at the techno-economic level, something which is hardly possible for other sectors, yet which can be very insightful when analysing the EU ETS policy->actor decision<->carbon price cycle (indeed, to-date, industry sectors are generally analysed using econometric rather than techno-economic methods).
For these reasons, it has been decided to construct, as a first step in the Zephyr model, a module dedicated to the analyses of the influence of EU ETS policy and permit prices on the emissions (abatement)-dependent production and investment choices of the electricity sector (hereafter referred to as the electricity sector module).
The structure of the rest of this Literature Review section is as follows: Section 2 describes models which have been developed and employed specifically for the analysis of emissions permits systems in terms of their price and emissions (abatement) dynamics, and the role of emissions trading policy/architecture; Section 3 looks at energy system models whose focus is not specifically emissions permit systems, but which can be used to complement the analyses of emissions permit-specific models; finally Section 4 describes the main features of the