Publisher’s version / Version de l'éditeur:
Questions? Contact the NRC Publications Archive team at
PublicationsArchive-ArchivesPublications@nrc-cnrc.gc.ca. If you wish to email the authors directly, please see the https://publications-cnrc.canada.ca/fra/droits
L’accès à ce site Web et l’utilisation de son contenu sont assujettis aux conditions présentées dans le site LISEZ CES CONDITIONS ATTENTIVEMENT AVANT D’UTILISER CE SITE WEB.
Proceedings of 2nd RILEM Workshop on Life Prediction and Aging Management
of Concrete Structures, pp. 71-79, 2003-06-01
READ THESE TERMS AND CONDITIONS CAREFULLY BEFORE USING THIS WEBSITE. https://nrc-publications.canada.ca/eng/copyright
NRC Publications Archive Record / Notice des Archives des publications du CNRC :
https://nrc-publications.canada.ca/eng/view/object/?id=9bcc72bd-ecbb-4b87-8212-e4477429b01d https://publications-cnrc.canada.ca/fra/voir/objet/?id=9bcc72bd-ecbb-4b87-8212-e4477429b01d
NRC Publications Archive
Archives des publications du CNRC
This publication could be one of several versions: author’s original, accepted manuscript or the publisher’s version. / La version de cette publication peut être l’une des suivantes : la version prépublication de l’auteur, la version acceptée du manuscrit ou la version de l’éditeur.
Access and use of this website and the material on it are subject to the Terms and Conditions set forth at
Numerical modelling of service life of reinforced concrete structures
Numerical modelling of service life of reinforced
concrete structures
Martin-Perez, B.; Lounis, Z.
NRCC-46139
A version of this document is published in / Une version de ce document se trouve dans:
Proceedings of 2
ndInternational RILEM Workshop on Life Prediction and Aging Management
of Concrete Structures, Paris, France, May 5-6, 2003, pp. 71-79
NUMERICAL MODELLING OF SERVICE LIFE OF
REINFORCED CONCRETE STRUCTURES
B. Martín-Péreza and Z. Lounisb
aDept. of Civil Engineering, University of Ottawa, Canada
bInstitute for Research in Construction, National Research Council, Canada
Abstract
A reliable assessment of the performance of reinforced concrete structures affected by reinforcement corrosion requires a through understanding of both material deterioration and its impact on structural behaviour in order to evaluate its safety and serviceability, in addition to estimating its remaining life. This paper presents an approach for service life prediction of reinforced concrete structures exposed to chloride environments that combines a finite element modeling of the chloride transport and a reliability-based analytical model for onset of damage and its accumulation. Service life is defined as the time until damage accumulation reaches an unacceptable level or ‘limit state’. The approach used here combines analytical models of the actual physical deterioration mechanism and mechanical damage build-up with probabilistic methods to obtain a reliable quantitative estimate of the remaining life of deteriorating structures. The considerable uncertainties associated with the parameters that govern the build-up of corrosion-induced damage are modeled as random variables. By using Monte Carlo simulation, the probabilistic distributions of the chloride penetration front and corrosion initiation time are generated. The proposed approach is illustrated on a reinforced concrete bridge deck exposed to chlorides from de-icing salts.
1. Introduction
Among the major degradation mechanisms that affect reinforced concrete structures in North America, chloride-induced corrosion of the reinforcing bars is the leading cause. Highway bridges and parking garages exposed to the application of de-icing salts during the winter represent a large portion of the structures most affected by this type of damage, which is usually manifested in the form of cracking and spalling of the concrete cover due to the expansion of corrosion by-products accumulating around the reinforcement. If left unattended, this problem can reduce the strength capacity of affected structures over time due to the loss of bonding action between the reinforcement and the concrete resulting from the splitting of the concrete cover, or to the decrease of tensile capacity because of the reduction of the reinforcing bars’ cross-sectional area. As a result, the serviceability and safety of affected structures, as well as their remaining life, fall below expected values. Given that the costs associated with the maintenance and repair of reinforced concrete structures affected by reinforcement corrosion are very high, it is important from the point of view of design, construction, and maintenance
to estimate the acceptable level of deterioration beyond which repairs or replacements are needed.
Service life models enable the development of a systematic approach for the optimization of design and rehabilitation of structures in terms of cost and performance under the influence of mechanical loading and environmental conditions. They address in particular industry-related problems associated with maintenance and rehabilitation programs for aging structures, where practicing engineers need to select the optimal solution from several alternatives. A reliable assessment of the performance of reinforced concrete structures affected by reinforcement corrosion requires a through understanding of both material deterioration and its impact on structural behaviour in order to evaluate its safety and serviceability, in addition to estimating its remaining life.
Corrosion of reinforcing steel in concrete is a very complex phenomenon that involves many factors, which are not currently well understood. In addition, there are many other factors that affect the estimation of the life expectancy of a structure: type of structure and its design, structural details, materials, construction methods and quality, loads, maintenance practices, inspection routines and environmental factors, among others. All these factors have uncertainties associated with them that arise from the physical randomness of their magnitude and time of occurrence. Other uncertainties associated with the assessment of performance of deteriorating structures are statistical uncertainties, i.e., those related to limited amount of information in estimating the characteristics of a parameter, and model uncertainties, i.e., those related to the assumptions of the adopted prediction models. Because of the stochastic nature of many of the parameters that govern the performance of reinforced concrete structures, a probabilistic approach as opposed to a deterministic one is needed to generate reliable service life predictions. Modelling explicitly the various uncertainties through a probabilistic-based method leads to reliable models for the prediction of service life of reinforced concrete structures [1].
In this paper, an approach for service life prediction of reinforced concrete structures exposed to chloride environments is proposed in which finite element modelling of chloride transport in concrete is combined with a reliability-based model for chloride contamination of concrete and onset of corrosion. The approach here uses an analytical model for corrosion initiation within a probabilistic framework as well as a deterministic model for onset of cracking and spalling. The process of chloride penetration is modelled through the use of the finite element method, whereas damage accumulation is estimated by solving for the state of stress resulting from the associated mechanical problems. Uncertainties associated with all factors affecting the prediction of service life are modelled as random variables. Time-dependant chloride contamination of concrete and corrosion initiation are obtained using the Monte Carlo simulation method.
2. Service life model
Following a modified damage model first introduced by Tuutti [2], the service life of corrosion-damaged reinforced concrete structures is idealized as a two-phased process: an initiation stage, in which chlorides penetrate the concrete and reach the reinforcement in sufficient quantities to initiate corrosion, and a propagation stage, in which distinct levels of damage build-up are attained (see Figure 1). Service life is defined as the time until damage accumulation reaches an unacceptable level or ‘limit state’, i.e., it is the time when the failure probability reaches an unacceptable level (which is dependent on the type of structure and
MARTIN-PEREZ, “Numerical Modelling”, 2/9 Fax: (613) 562-5173 E-mail: bmartin@eng.uottawa.ca
failure mode). According to Figure 1, limit states considered for structures with reinforcement corrosion include corrosion initiation, concrete cracking, spalling and delamination of the concrete cover, and ultimately structural failure.
C orr os io n-i nd uce d d am ag e Onset of corrosion Cracking Spalling/ delamination Structural failure
Initiation Propagation Time Mean service life
Figure 1: Service life of reinforced concrete structures affected by corrosion. The estimate of residual life of corrosion-damaged reinforced concrete structures differs with the adopted limit states (cracking, and/or spalling, and/or collapse), depending on the element’s function within the structure, failure mode, and the cost incurred to remediate/stop the damage build-up. Therefore, there is a need to define acceptable values for minimum levels of technical performance for the different types of structural elements. The assessment of performance is not only related to the degree of material deterioration, but it is strongly dependent on structural behaviour, failure mode and consequence.
2.1. Modelling corrosion initiation
The initiation stage is the phase during which chloride ions penetrate the concrete cover and reach the reinforcing steel in sufficient quantities to depassivate it, therefore initiating the process of corrosion. Thus, the time to corrosion initiation is the time when the chloride concentration at the reinforcement level has reached the so called ‘threshold value’. The length of the corrosion initiation time is controlled by the depth and quality of the concrete cover (permeability, cracking intensity), the presence of protective systems (membrane, epoxy coating of reinforcement), the rate of chloride ingress, the chloride concentration at the surface, and the chloride threshold level. The onset of corrosion corresponds to a serviceability limit state as illustrated in Figure 1.
Transport mechanisms relevant to chloride ingress in reinforced concrete structures exposed to de-icing salts include: (1) ionic diffusion in saturated concrete; and (2) water surface absorption in partially-saturated concrete (capillary sorption or convection). While a diffusion model is applicable to concrete with a constant moisture level (diffusion zone), the transport of chloride ions due to water flow has to be considered for the outer part of the concrete cover where moisture conditions fluctuate due to cycles of wetting and drying (convection zone). The process of chloride ingress in reinforced concrete structures can thus be modelled by adding the chloride fluxes due to diffusion (governed by Fick’s 1st law) and capillary sorption, and
C D C C Dw t x x x x ∂ ∂ ∂ ∂ ∂ = + ⋅ ∂ 14243 1442443∂ ∂ ∂ ∂ diffusion sorption w (1)
where C is the chloride concentration, t is time, D is the chloride diffusivity, x is the concrete depth, Dw is the moisture diffusivity and w is the concrete moisture content. Equation (1) is
solved numerically in space as a boundary-value problem and in time as an initial-value problem by means of a finite element formulation, in which appropriate boundary conditions are enforced to simulate the seasonal variations in exposure conditions. A time-step integration procedure is applied to determine the variation in time of the chloride concentration at the level of the reinforcement.
In addition to chloride diffusion and sorption, the chloride transport model based on the finite element solution of Eq. (1) considers chloride binding and the time-dependence of material properties and boundary conditions [3]. It also couples the chloride transport process with heat and moisture transfer in the concrete cover in order to allow for the temperature and moisture dependence of material properties. Boundary conditions are specified by the amount of applied de-icing salts or chloride surface concentration Cs, and the temperature and relative humidity
of the concrete surface micro-environment.
Many of the significant material and environmental parameters involved in the solution of Eq. (1) are random, and, therefore, a statistical description of these variables is appropriate. Probability density functions for these parameters (e.g., D and Cs) can be obtained from field
measurements of chloride profiles. Probabilistic distributions of chloride concentrations at a given depth and exposure time are then generated by means of Monte Carlo simulations. Failure at this stage is defined as the onset of corrosion. Thus the probability of attaining this limit state at time t is given by:
(
)
(2)0
( ) t i( )
f i T
P t =P T ≤ =t
∫
f x dxwhere fTi(x) is the probability density function of time to corrosion initiation. The probability
density function fTi(x) is also obtained by means of Monte Carlo simulation using the
probability density functions of all the parameters involved in the solution of Eq. (1). A conservative estimate for corrosion initiation can then be defined by using appropriate α -fractiles of the distribution of corrosion initiation time depending on the type of structure and failure mode.
2.2. Modelling corrosion propagation
The propagation time is the time from corrosion initiation until a specified level of corrosion-induced damage state is attained. Depending on the type of structure, failure mode and consequence, the time to onset of different damage levels such as longitudinal cracking, spalling/delamination of the concrete cover, and a maximum acceptable damage (e.g., flexure or shear failure) can be adopted as propagation times, as illustrated in Figure 1.
To assess the mechanical damage resulting from the expansion of the corrosion products around the corroding reinforcing bars, an equivalent uniform internal pressure is applied around the steel/concrete interface, and the resulting state of stress in the surrounding concrete is evaluated by means of an elastic analysis [4, 5]. In this approach, the concrete cover is
MARTIN-PEREZ, “Numerical Modelling”, 4/9 Fax: (613) 562-5173 E-mail: bmartin@eng.uottawa.ca
treated as a thick-wall cylinder subjected to the internal pressure build-up of expansive corrosion products, as shown in Figure 2.
Crack front c
Rebar
Concrete surface
Figure 2: A thick-wall concrete cylinder subjected to accumulation of corrosion product. The times to onset of cracking and spalling are determined from the times at which the induced hoop stresses of the thick-wall cylinder exceed the resistance of the cover to cracking and spalling, respectively, as given by the models in Figure 3, where p is the internal pressure induced by the corrosion products, f’t is the concrete tensile strength, c is the concrete cover,
and d is the rebar diameter. These two times depend on the corrosion rate, fracture properties of concrete, cover-to-bar diameter ratio, bar spacing, and the level of traffic and/or environmental load (e.g., thermal stresses).
Crack initiation
Crack
propagation Crack reaching surface
( ) ( )
( ) ( )
2 ' 2 0.5 t c d c d c d c d p f + = + +( )
' 0.5 1.665 t c d p f + = ' 2(
0.5)
t c d p f = +Stresses developed in the concrete
Figure 3: Models for crack initiation and propagation through the concrete cover. There are many mechanisms by which corrosion may impair the serviceability and safety of reinforced concrete structures. The residual capacity of these structures is affected by both the loss of concrete (through cracking and spalling) and reinforcing steel cross-section, and by the loss of bond between steel and concrete. To model the ultimate limit state corresponding to
structural failure, residual strength functions are formulated as R(t)=α(t)Ro, where α(t) is a
degradation function independent of the loading history but dependent on the rate of corrosion of the reinforcing steel, and Ro is the ‘undamaged’ resistance function. A reliability-based
assessment of the propagation period is then possible through the modelling of both the load and resistance as stochastic processes [6].
3. Application
The numerical model proposed above was applied to data obtained from the concrete deck of the Dickson Bridge in Montreal, Canada, which was demolished after 40 years of service. The bridge had a total length of 366 m and a width of 27 m. The superstructure consisted of reinforced concrete T-girders in the end spans and concrete deck on steel girders in the central spans. The bridge deck had a specified design thickness of 150 mm, a concrete cover of 25 mm for the top reinforcement, and a compressive strength of 28 MPa. Prior to demolition, a detailed condition assessment of the bridge was undertaken [7]. Table 1 presents a summary of the data collected in the field and used in the numerical simulations. Note that c denotes the concrete cover, Cs is the near-surface chloride concentration (within the first 10 mm), Da is the
apparent diffusion coefficient, µ is the mean, σ is the standard deviation, and COV is the coefficient of variation.
Table 1: Summary of data from field assessment.
Variable Distribution µ σ COV
c (mm) Normal 36.6 16.5 45%
Cs (by weight of cement) Lognormal 1.27% 0.51% 40%
Da (m2/s) Lognormal 1.62×10⁻¹² 0.5×10⁻¹² 30%
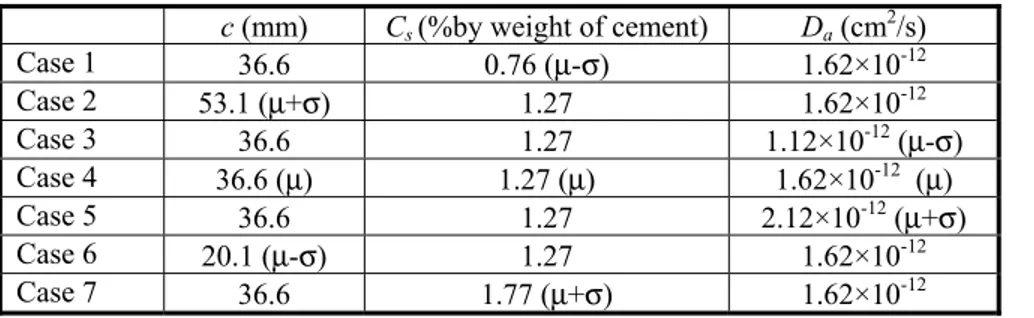
Chloride penetration profiles in the concrete deck after 39 years were calculated for seven different cases, as presented in Table 2, using the finite element model. These cases result from different combinations of the values provided in Table 1, including the mean values µ as well as µ±σ.
Table 2: Finite element cases.
c (mm) Cs (%by weight of cement) Da (cm2/s)
Case 1 36.6 0.76 (µ-σ) 1.62×10⁻¹² Case 2 53.1 (µ+σ) 1.27 1.62×10⁻¹² Case 3 36.6 1.27 1.12×10⁻¹² (µ-σ) Case 4 36.6 (µ) 1.27 (µ) 1.62×10⁻¹² (µ) Case 5 36.6 1.27 2.12×10⁻¹² (µ+σ) Case 6 20.1 (µ-σ) 1.27 1.62×10⁻¹² Case 7 36.6 1.77 (µ+σ) 1.62×10⁻¹²
Finite element analyses were performed by discretizing the deck along the concrete cover with eleven 5×5 mm bilinear rectangular elements. The “far field” boundary condition (i.e., x > 55 mm) was approximated by one four-node Lagrangian isoparametric singly infinite element to ensure the initial condition of the problem, in this case assumed to be zero chloride content. The finite element analyses allowed for the dependence of the concrete chloride diffusivity on temperature by coupling the chloride diffusion problem to that of heat transfer in concrete and
MARTIN-PEREZ, “Numerical Modelling”, 6/9 Fax: (613) 562-5173 E-mail: bmartin@eng.uottawa.ca
assuming a sinusoidal variation in seasonal temperatures with Tmax = 25°C (summer) and Tmin =
-25°C (winter).
The chloride penetration profiles for Cs = 1.27% by weight of cement (4.6 kg/m3) and Da =
1.62×10⁻¹² m2/s after 10, 20, 30 and 39 years are shown in Figure 4. Results clearly indicate the
difference in concentration values at the steel level when the variation of concrete cover presented in Table 1 was accounted for in the analysis. Monte Carlo simulation was also performed on the data presented in Table 1 to assess the distribution of chloride concentration at the reinforcement level after 39 years of service [6]. The results, which are illustrated in Figure 5, show a gamma distribution with parameters 2 and 0.783, with a mean value of 2.57 kg/m3 and a standard deviation of 1.36 kg/m3. Figure 5 also includes the results of the finite
element simulations. The results from these analyses are within the range of the distribution provided by the probabilistic analysis; however, they just provide a single value with no information of the type and extent of the scatter of the actual data.
The probability density function of the time to corrosion initiation was also obtained from Monte Carlo simulation, by assuming that the chloride threshold level had a lognormal distribution with a mean of 0.72 kg/m3 and a standard deviation of 0.072 kg/m3. The results,
which are plotted in Figure 6, show a skewed distribution that can be approximated by a lognormal distribution with a mean of 10.23 years and a standard deviation of 10.74 years [6]. Also plotted in Figure 6 are the results from the finite element analyses of the cases tabulated in Table 2, assuming a threshold chloride concentration of 0.72 kg/m3. As previously, the finite
element results fall within the range of the distribution function provided by Monte Carlo simulation; however, the considerable scatter obtained from the probabilistic analysis cannot be captured by the deterministic solution of Eq. (1) provided by the finite element analysis.
0.0 1.0 2.0 3.0 4.0 5.0 0 10 20 30 40 50 6 Concrete depth (mm) C h lo ri de c onc en tr at ion ( kg /m 3 ) 0 10 yrs 30 yrs 39 yrs c (µ -σ) c (µ) 20 yrs c (µ+σ)
0 0.02 0.04 0.06 0.08 0.1 0.5 1.65 2.65 3.65 4.65 5.65
Distribution of chloride concentration at steel level (kg/m3)
Den sit y Case 1 1.51 Case 7 3.60 Case 3 2.23 Case 5 2.82
Figure 5: Distribution of chloride concentration at the steel level after 39 years.
0.000 0.025 0.050 0.075 0.100 0.125 0.150 0 10 20 30 40 5
Distribution of time to corrosion initiation (years)
Den si ty 0 Case 2 15 Case 6 1.9 Case 1 9.9
Figure 6: Probabilistic distribution of corrosion initiation time.
MARTIN-PEREZ, “Numerical Modelling”, 8/9 Fax: (613) 562-5173 E-mail: bmartin@eng.uottawa.ca
From the condition assessment carried out at the Dickson Bridge [7], an average corrosion rate of 50 µm/year was recorded. By converting this value to an equivalent internal pressure exerted around the steel/concrete interface [5] and applying the mechanical model shown in Figure 3, an estimate of less than 6 months is obtained as the time to longitudinal cracking of the concrete cover. Given the complexities and uncertainties associated with the corrosion process itself, such value is only meaningful within the assumptions involved in its calculation. By modelling all the uncertainties involved through a probabilistic-based analysis, it is possible then to determine the probability of bridge deck cracking within a certain amount of exposure time.
4. Conclusions
This paper has presented a numerical model for service life prediction that combines finite element modelling of chloride penetration in concrete with a reliability-based model for estimating the time to onset of corrosion. The procedure is also applicable to other levels of damage build-up such as longitudinal cracking, spalling/delamination of the concrete cover and structural failure. The probabilistic approach, as opposed to a deterministic one, takes into account the uncertainties inherent in the parameters involved by modelling them as random variables. This leads to reliable service life prediction models that provide not only mean values, but also the extent and type of scatter. The application of such an approach is required in the assessment of serviceability and safety of affected structures in order to ensure that the probability of failure corresponding to different limit states is kept at an acceptable level. 5. References
1. Lounis, Z., ‘Reliability-based life prediction of aging concrete bridge decks’, in ‘Life Prediction and Aging Management of Concrete Structures’, Proceedings of the International RILEM Workshop, Cannes, France, October, 2000 (RILEM Publications). 2. Tuutti, K., ‘Corrosion of Steel in Concrete’, (Swedish Cement and Concrete Research
Institute, Stockholm, 1982).
3. Martín-Pérez, B., Pantazopoulou, S.J., and Thomas, M.D.A., ‘Numerical solution of mass transport equations in concrete structures’, Computers & Structures, 79(13) (2001), 1251-1264.
4. Tepfers, R., ‘Cracking of concrete cover along anchored deformed reinforcing bars’, Magazine of Concrete Research, 31(106) (1979), 3-12.
5. Martín-Pérez, B., ‘Service Life Modelling of R.C. Highway Structures Exposed to Chlorides’, (Ph.D. dissertation, University of Toronto, 1999).
6. Lounis, Z. and Mirza, M.S., ‘Reliability-based service life prediction of deteriorating concrete structures’, in ‘Concrete Under Severe Conditions’, Proceedings of the Third International Conference, Vancouver, 2001, 965-972.
7. Fazio, R., ‘The Assessment and Prediction of Reinforcing Steel Corrosion on the Dickson Bridge’, (M.Eng. thesis, McGill University, 1999).