Recent
Characteristic
Budgets
of
Inorganic
Chlorine
and
Fluorine
above the
Jungfraujoch
Station
E. Mahieu, R. Zander, F. Mélen, P. Demaulin, C. Servais, L. Delbouille and G. Roland
Institute of Astrophysics and Geophysics - University of Liège 5, avenue de Cointe, B-4000 Liège -
BELGIUM
V/ithin the
frameof
NDSC
(Netrvorkfor
the
Detectionof
Stratospheric Change)-relatedmonitoring
activities conductedat the
InternationalScientific
Stationof
the Jungfraujoch (ISSJ, SwissAlps,
46.5 oN, 8.0'E,
3580m
a.s.l.), long-term investigationsof
the inorganic chlorine (Cl) and fluorine (F) budgets have been pursued during the last years. They are basedon
the analysisof
high-resotution infrared solar spectra, recordedwith
grating and Fouriertransform state-of-the-art spectrometers. Nonlinear least squares
fittings of
synthetic spectrato
the
observationsare
performedover
selectedintervals,
encompassing characteristic absorptionsof HCl,
ClONOz,t{F
and COFz;this
allows the retrievalof
their total verticalcolumn abundances
(VCAs)
above ISSJ. Descriptionof
the data andenor
analysis method can be foundin
Rinsland et al.[1]
while ISSJ instrumentation is describedin
Delbouille anci Roland [2].The
following
steps explainhow
the total inorganicCl
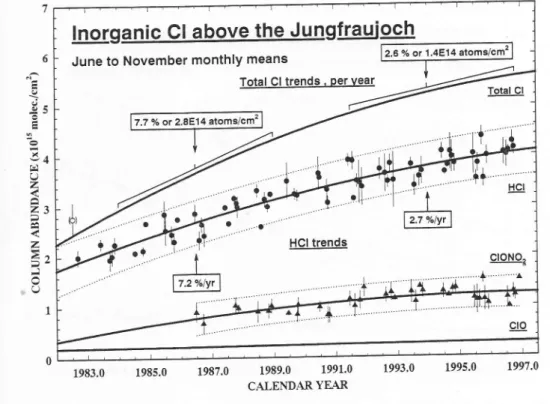
burden above the Jungfraujoch station has been evaluated :(i)
monthly averaged VCAs of HCI and CIONOz determined forthe months of June to November have been selected,
in
order to avoid significantvariabilitl'
occurring during the winter-spring
time
(see transport discussion hereafter); these monthl,vmean
VCAs
are respectively reproducedby filled
circles andfilled
trianglesin
Figure 1; in both cases, vertical bars represent one standard deviation around the monthly means.In
step(ii),
second order polynomialfits
have been applied 1o both datasets described above (seecorresponding thick lines
in Fig.
1), their associated2-o
confidence ranges are givenby
thethin
dotted curves.The lwo
fits
present negative second order derivatives, suggesting anattenuation
in
both species' trends. Based on the polynomialfits,
theHCI
ratesof
increasereferred
to
1986.5 and 7994 correspond respectivelyto
7.2Volyr and 2.7 Volyr.In
step(iii),
CIO columns computed by AER Inc. (Cambridge,
MA,
USA;M.
Ko, private communication)have been added to the CIONOz and HCI ones, to complete the inorganic Cl burden evolution above ISSJ during the last fifteen years (see upper thick curve
in Fig.
1); the CIO averaged contribution to the total inorganic Cl budget amounts to about5.57o,in
excellent agreementwith
the valueof
5.7 Vo derîvedby
Zanderet al.
[3]
and basedon a
1985Cl
inventory at30
"N. In
the same study, evaluationof
the contributionsof
species such as HOCI, COCIF,which are not included
in
the present work, indicate that they accountfor
at most 2 Voof
total inorganic Cl.Timely total Cl
trends have been calculatedfor
1986 and 1994, they are respectively equal to 7.7 Volyrand2.6%lyr,which
correspond to yearly increasesof
2.8 and1.4x10''Cl
atoms/cm2
(the maximum
Cl
trends aboveISSJ
occurred aroundthe
mid-1980s); thissignificant slowing down
resultsfrom
the
phase-outof
CFCs(their
photodissociations constitute the primary source of inorganic Cl in the stratosphere) by the Montreal protocol andits
amendments.In
particular,
drastic decreasein
CFC-11and
CFC-12 releasesto
the atmosphere are reported by AFEAS (see AFEAS-1996 report[4]),
indicating that their actual releases are backto their early
1950 levels.In
situ
measurementsconfirm
that the globalCFC-11 groundJevel
concentrationis
already
decreasing,while that
of
CFC-12
hassignificantly
leveledoff
(see, e.g., Montzkaet al. [5]).
Extrapolationof
the
second order polynomial function representing the totalCl in
Fig.1 indicates that its maximum above ISSJ6 U<
ë4
()z
z3
Pz
2a j O 11987.0 1989.0 1991.0
1993.0 CALENDARYEAR1995.0
1997.01983.0
1985.0Figure 1. Total inorganic Cl burden evolution above the Jungfraujoch station during the last fifteen
years.HighcolumnobservedinJulylg82isbelievedtobebiasedbytheElChichonvolcanic
eruption of March-APril 1982.
may occur between years 2000 and 2003'
The above proc;dure has further been adopted to determine the-total inorganic F burden above ISSJ. In
iigure 2,
June to November H-F monthly averagedVCAs
are reproduced by dots and COFzVCAs
Éy triangles;both
datasets arefitted by a
second order polynomial function (see correspondingthiJk
curves) which present positive curvatures, thus indicating*"un
,t"Àdy burden increaiesof
thesetwo
gases above ISSJ. Error bars correspondto
thestandard deviation around the
monthly
means; dottedlines
reproduce the2-o
confidencerange. The upper thick curve displays the total inorganic fluorine burden above ISSJ, obtained by summing the HF and two times the COFz columns read
off
the two lower curves' Missing species, e.g.coclF,
accountfor
at most2vo ol
the total budget (zander etai' [3])'
Timelytotal F increases calculated
for
1986 and 1994 are equal to 6'2 Volyt and 4'5 7olyr re-spectivel}which
correspondto
fearty inorganic
F
increasesof
respectively 6'4 and
6'8x10"
F;;;j;t.
il"
ru,r"tuatu"i
indicàte that theF
depositionin
the atmosphere has remainedconstant over the period investigated here, which is qualitativeiy anticipated when considering
the replacement
oi
the CFCs by other "fluorinated" species such as HCFCs and HFCs'Beside
long-term trend
evaluations describedin
the
previous paragraphs, effectsof
latitudinal
transport onvcAs
measured above the ISSJmidlatitudinal
site have also beenidentified (see also De Mazière et al. ; Demoulin et al. ; Patton Walsh et
af
in this volume)' InFigure 3, the ratios befween HCI and HF
daily
avefage VCAs obtained over the last 6'5 years are reproducedby
open andfilled
circles. The overall tendency is givenby
a t'woiterations-linear
fit
to
the data;its
decrease resultsfrom
the relative evolutionsof
HF
andHCI;
the corresponding
99 Vo confidence rangeis
representedby
the dottedlines'
All
ratiosfalling
below this range aret"pi"àr""6
uyîttea
circles. These latter, aswell
as afew
ones foundabove
the high
limit of
the
range,are
consideredto
result from
unusual almospheric= E T'J I
z
â
1.0z
z
à
= rlo
0.5 U 1983.01985.0 1987.0 1989.0 1991.0
1993.0 CALENDARYEAR1995.0
1997.0Figure 2. Total inorganic F burden evolution above the Jungfraujoch station during the last fifteen years.
circulation situations. The extremely
low
ratios, observed during thewinter
1992, primarllyresults from heterogeneous conversion of HCI
in
the presence of stratospheric aerosol clouds associatedwith
the major volcanic eruptionof Mt.
Pinatuboin
June 1991; this is confirmedby
recordhigh
valuesof
CIONOz noticedduring
this period(on
February 19th 1992, the CIONO2 c-olumn, equalto
3.45x10¹⁵ molec./cm2, even exceededthat
of
HCI
(3.33x10¹⁵molec./cm2)).
In
late January 1994, the circulation situation reversed completelywithin
one day : on January 30th, back-trajectory ECMWF-maps (providedby
the European Centrefor
Medium-Range Weather Forecasts
via NILU)
indicate that the airmasses were originatingfrom
sub-tropical
regions,with
expectedair
eurichedin
HCI
(relatively
to
HF);
thecorresponding high ratio, equal to 3.93, is
well
noticed onFig
3; potentialvorticity (PV)
atnoon
is
25.59(PV
Units
=
tO{
fmz/t<gs)for
the 475K level (similar
sub-tropical airintrusions have also been observed twice in February 1996). The next day, circulation brought
vortex-type airmasses above the Jungfraujoch station and the
ratio
fell
to
2.64,with a
PVvalue near 33 PVU at the same level. [-ow ratio episodes have further been observed
in
mid-February, late March and
mid-April of
1996. Despite a PV at 475Kof.22PVU,
the February15 event is indicative
of
some chlorine activation,with
HCI and CIONOz VCAs respectively equalto
3.38 and 2.57x101s molec./cm2, which correspondto
deviationsfrom
the expectedvalues of
-15
Vo forHCl
and near 100 Vo for ClONO2. In March andApril,
the situation wassomewhat different when low HCI/HF ratios were correlated
with
the presence above ISSJof
vortex-type air-masses. Noticeable were the record high values
of
HF and HCI VCAs, whileCIONO2 columns were some 33 Vo above normal; PY aT 475
K
extended from 37 to 40 PVU.Analysis
of
PV-
and back-trajectory ECMWF-mapsconfirm
the
north-south meridional transports that prevailed at this time. On the basisof
more recent ISSJ measurements madeduring the winter and spring time
of
1996-97,it
appears that less transport activity occurred :only
three datapoints(April
12, lll4ay2
and3)
are foundslightly below
the 99 Vo notmalrr
3.5È
3.01993.0
1994.0
1995.0CALENDARYEAR
L997.O
Figure 3. All datapoints correspond to the HCI/HF ratios observed above ISSJ during the last 6.5 years.
Filled circles, which fall below the 99 Vo confrdence range determined after two successive, 2-o linear
fits, are associated with peculiar atmospheric circulation situations.
"climatology"
limit.
ACKNOWLEDGEMENTS
Acknowledgment is made
for
the financial contributionsfrom
the Belgian organizationsFNRS
and OSTC, Brussels, andfrom the
CEC, Brussels.We
thankM.
De
Mazière, J.Granville,
O.
Hennen(BIRA/IASB) and
R.
Blomme (KSB) who
participatedin
someobservational campaigns at ISSJ. We further thank the Stiftungsrat
of
the Jungfraujoch andthe University
of
Liègefor
supporting the facilities needed to perform both the observations and their analysis.1. Rinsland C.P. et al. , C}ONO2 total vertical column abundances above the Jungfraujoch Station, 1986-1994:
Long{erm trend and winter-spring enhancements, J. Geophys. Res.,
l0l,
3891-3899,1996.2. Delbouille L. and G. Roland, High-resolution solar and atmospheric spectroscopy from the Jungfraujoch high-altitude station, Optical Eng., 34, 2736-2739, 1995.
3. Zander R. et al. , The 1985 Chlorine and Fluorine Inventory in the Stratosphere Based on ATMOS Observations at 30' North Latitudes, J. Atmos. Chem', 15, 1'71-186,7992'
4. AFEAS-1996, Production, Sales and Atmospheric Release of Fluoro-carbons Through 1996, Alternative Fluorocarbons Environmental Acceptability Study, 1333H Street NW, Washington, DC 20005' USA, 1997.
5. Montzka S.A. et al. , Decline in the Tropospheric Abundance of Halogen from Halocarbons: Implications for Stratosphedc Ozone Depletion, Science, 272, 7318-1322, 1996.