Nuclear magnetic resonance studies and molecular dynamics
simulations of the solution conformation of a 'designed', a-helical
peptide
Werner Klaus' and Rudolf Moser2
Gesellschaft fur Biotechnologische Forschung (GBF), Abt. Molekulare Strukturforschung, Mascheroder Weg 1, D-3300 Braunschweig, Germany and 2Biochemisches Institut der Universitat Ziinch, Winterthurerstr. 190,
CH-8052 Zurich, Switzerland
'Present address: F.Hoffmann-LaRoche, Ltd, Dept. Central Research Unit, Building 65, CH-4002 Basel, Switzerland
The complete three-dimensional structure in methanol of an amphipathic a-helical peptide, that has been designed by taking into account the three-dimensional structures of small haemolytic peptides, secondary structure prediction algorithms and the well documented literature on a-helix stabilizing factors, has been elucidated by two-dimensional NMR spectroscopy. Initially various two-dimensional spectra (COSY, TOCSY, and NOESY) allowed the complete sequence specific assignment of all signals in the 'H spectrum. Consequently trial structures were generated which were then subjected to molecular dynamics simulations using 121 NOE-derived distances and 25 vicinal coupling constant values as structural restraints to give a final set of calculated structures. These structures are in complete agreement with the results of a circular dichroism study and reveal that the peptide adopted a highly ordered a-helical conformation. Details of the structure which throw light on future peptide/ protein design are discussed.
Key words: amphipathic a-helix/haemolytic peptide/NMR
struc-ture/secondary structure design
Introduction
Currently one of the unresolved key problems in molecular biology is the understanding of the relationship between the primary amino acid sequence of a protein or peptide and its three-dimensional structure. The contribution of stabilizing forces which determine the secondary and tertiary structure can best be studied by the synthesis of small polypeptides that are designed to adopt a specific desired conformation. Experimental structure elucidation, either spectroscopically or crystallographically, allows an assessment of the accuracy of the model construction and an analysis of the contribution of structure stabilizing factors. Our limited understanding of how proteins or peptides fold into their specific conformation makes the use of short and easily accessible synthetic peptides a powerful tool (Wright et al., 1988) and can reduce the complexity of such systems by permitting the selective examination of only one structural building block (e.g. an a-helix). The fact that short linear peptides in isolation are capable of adopting a stable a-helical conformation is of considerable importance not only for the initiation of the protein folding process but also because it validates the de novo design of peptides with tailored structures and novel properties (DeGrado, 1988; DeGrado etai, 1989). Designing helical peptides is greatly facilitated by the existence of detailed information about helix stabilizing factors (Shoemaker et al., 1987) and about the relative helix forming propensities of the
© Oxford University Press
various amino acid residues (Chou and Fasman, 1974; Argos and Palau, 1982; Palau et al., 1982).
A Helical Erythrocyte Lysing Peptide (HELP) with a length of 26 residues, having a stable, amphiphilic, a-helical structure, was designed using secondary structure prediction methods and molecular modelling techniques (see Moser, 1992). Well characterized lytically active peptides were taken as the main structural template and together with the results from modelling studies the amino acid sequence produced by the design strategy was synthesized by the Merrifield solid-phase peptide synthesis method. HELP induced pH-triggered cell disruption using human erythrocytes as targets, as would be expected from a surface-active amphiphilic helix.
The circular dichroism (CD) spectrum of HELP is typical of an all a-helical peptide and highly suggestive of the presence of a unique folded, helical structure (Greenfield and Fasman, 1969) with the value of [0]222 corresponding to a helix content
of - 1 0 0 % (Provencher and Glockner, 1981). In spite of the similarity of CD spectra recorded in both aqueous and methanolic solutions (see Moser, 1992) the NMR spectra of HELP in the latter solvent showed drastically enhanced spectral resolution. Thus methanol stabilizes the monomeric helical structure whereas the peptide tends to form an aggregated helical state in aqueous solution (see Moser, 1992). Hence the complete three-dimensional structure of HELP dissolved in methanolic solution was elucidated by high-resolution 2D 'H-NMR-studies and molecular dynamics (MD) simulations.
Materials and methods
Peptide synthesis and sample preparation
HELP was synthesized by the Merrifield solid-phase peptide synthesis method using /ert-butyloxycarbonyl-chemistry on np-methylbenzhydrylamine resin in order to obtain a C-terminal amide. The synthetic peptide was purified by reverse-phase HPLC and its homogeneity was confirmed by amino acid composition analysis, complete sequence analysis and FAB mass spectral analysis. For the NMR-measurements one sample of 5.5 mg HELP was dissolved in 500 fil CD3OD (100% D,
Janssen Chimica, Nettetal, Germany) to which 1.5 /d DC1/D2O
(2% DC1) was added. A second sample consisted of 7 mg peptide dissolved in 500 fil CD3OH (Merck, Sharp and Dohme
Isotopes) with the same amount of HC1/H2O added.
Light scattering experiments
Light scattering experiments were performed on 1 mM and 4.5 mM methanolic solutions of the peptide using the system ALV-3000 (ALV Laservertriebsgesellschaft mbH, Langen, Germany). The correlation functions were analysed with the help of the program CONTIN (Provencher, 1982). The observed size distributions were bimodal. A first peak corresponding to the solubilized peptide co-existed with a second peak indicative of dust or particle aggregates at least an order of magnitude larger. As the scattered intensity is proportional to the square of the molecular weight of the scatterers, the latter represent an insignificant contamination without any relevance. The
distribution of the first peak. The values of 1.4 nm ± 0 . 3 nm for the first sample and 1.2 nm ± 0.2 nm for the second sample are consistent with a non-aggregated state of the peptide under these conditions.
NMR experiments
NMR spectra were recorded on a BRUKER AM 600 spectro-meter with time proportional phase increment (Redfield and Kunz, 1975) for quadrature detection in the t|-dimension and at temperatures between 277 K and 297 K. The temperature was adjusted using a stream of nitrogen gas which was precooled in a heat exchanger immersed in a thermostated liquid bath (Haake GmbH, Karlsruhe, Germany). Spectra were referenced internally with the residual signal of the methyl group of methanol set to 3.35 p.p.m. relative to 2,2-dimethyl-2-silapentanesulfonate (DSS). ID NMR spectra recorded with peptide concentrations between 0.3 mM and 4.5 mM showed no concentration-dependent chemical shifts of the amide protons that would be indicative of peptide aggregation under these conditions.
A phase-sensitive COSY-spectrum (Marion and Wiithrich, 1983) was recorded in conjunction with a NOESY-spectrum (Jeener etai, 1979; Macura etai, 1981) on the CD3
OD-sample as part of the COCONOSY-experiment of 277 K (Haasnoot etai, 1984; Gurevich etai, 1984). A double-quantum filtered COSY-spectrum (Ranee et al., 1983) was acquired at the same temperature with the peptide dissolved in CD3OH. With the same sample a 2D TOCSY was recorded in
the 'CLEAN' version as described (Griesinger et al, 1988) with the MLEV-17 mixing sequence (Bax and Davis, 1985; Davis and Bax, 1985) but without the trim pulses. The total mixing time was 100.2 ms. NOESY-spectra were acquired with the usual pulse sequence (90-t)-90o-T—90°—acq) with mixing times
ranging from 60 to 240 ms. In all measurements the solvent resonance line was irradiated during the relaxation delay ( I s ) and additionally during the mixing time of the NOESY-experiments. All spectra were recorded using Ol/O2-phase coherence (Zuiderweg etai, 1986).
To evaluate 3JHN-HCTvalues a ID-spectrum with a high digital
resolution was recorded, zero-filled to 64 k real data points, multiplied by a Gaussian window and Fourier-transformed. For overlapping resonance lines the coupling constants were extracted from the 2D-COSY-DQF-spectrum. For all 2D-spectra typical-ly 512 ti-increments were used with 64 scans sampled per increment with a spectral width of 8064 Hz for both dimensions. The data were transferred to an ASPECT X32 computer for 2D-Fourier transformation and phase correction yielding data matrices of Ik * Ik real data points for COSY-DQF and NOESY and 2k * Ik for CLEAN TOCSY. The assignment of the cross-peaks was greatly facilitated by the program AURELIA (Neidig and Kalbitzer, 1990), which was also used for the determination of the volumes of the NOE cross-peaks. Their intensities were classified into five groups and translated into distances by an empirical calibration of cross-peaks arising from known distances within regular secondary structures (Billeter etai, 1982). Distance restraints were used as upper bounds with appropriate corrections for methyl groups or methylene protons which were treated as pseudo-atoms (Wuthrich etai, 1983).
Restrained molecular dynamics simulations
Restrained molecular dynamics simulations and analysis of the resulting structures were carried out on a TRACE (Multiflow Corp.) mini-supercomputer using the GROMOS software package (van Gunsteren and Berendsen, 1987). Creation of the peptide in an extended configuration and display of structures
334
and Reichelt, 1988) running under UNIX on a Hewlett Packard Graphics System 9000. The approach for the creation of the initial 'pseudo-random' structures was influenced by Nilges et al. (1988), whereas the protocol that was used for the main part of the structure calculations was adopted from Bazzo et al. (1988) and Klaus et al. (1991).
The initial structures for the molecular dynamics calculations were created as follows. The peptide, in an extended conforma-tion with all backbone angles artificially set to 180°, was subjected to energy minimization to relieve the internal strain. Molecular dynamics runs without restraints and with velocities taken from a Maxwellian distribution corresponding to temperatures between 900 K and 1350 K were performed for time periods between 3 ps and 6 ps. These structures were energy minimized and used as input for the calculations with restraints. Each one of these starting structures was subjected to energy minimization using 500 steps of steepest descent with a small force constant of 200 kJ mol"1 nm"2 for the distance restraints and 10 kJ mol"1 for the
dihedral restrains. This was followed by 2 ps of MD at 290 K using the same force constants. The calculations were continued at 1000 K with force constants set to 500 kJ mol"1 nm"2 and
35 kJ mol"1 for 4 ps and with values of 1000 kJ mol"1 nm"2
and 70 kJ mol"1 for another 4 ps. For the rest of the
calcula-tions the force constant for the distance restraints was set to 1500 kJ mol"1 nm"2. 3 ps of cooling to 600 K were followed
by 3 ps of dynamics, 2 ps cooling to 290 K and 30 ps of dynamics at this temperature. During the 'high temperature stage' between 600 K and 1000 K the peptide bonds were additionally restrained to prevent ds/fra/w-isomerizations. For the last 20 ps of each run, which were used for analysing the resulting structure, a force constant of 3000 kJ mol"1 nm"2 for the distance restraints was
applied. The cutoff radius for calculating non-bonded interactions was set to 0.8 nm for both energy minimization and molecular dynamics with a list of interactions updated every 10 cycles. To constrain bondlengths the SHAKE algorithm was used allowing a time step of 1 fs for the simulations.
Results
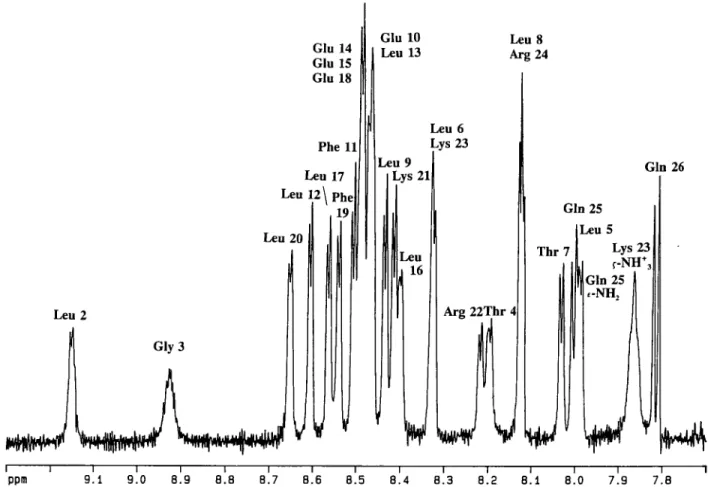
An expansion showing the amide region of the 'H NMR spectrum of HELP is given in Figure 1. Most of the signals are clearly resolved and allow direct measurement of the 3JHN-HCT
coupling constants. These, as listed in Table I, are a strong indication of a helical secondary structure of the peptide.
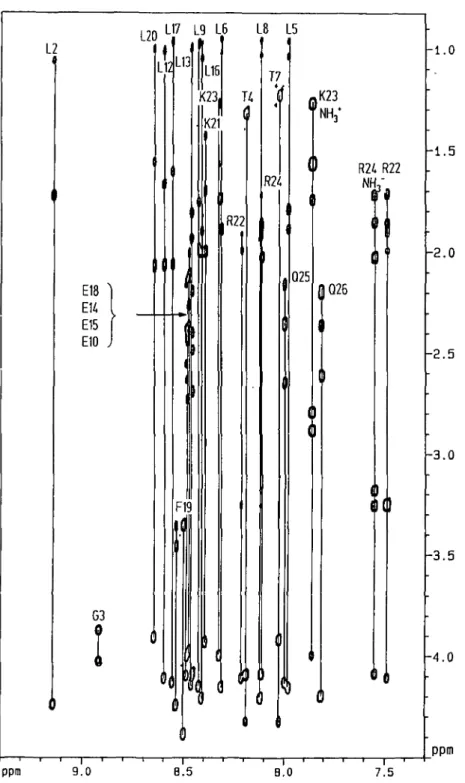
Assignment of spin systems
The TOCSY-spectrum (Figure 2) with a 100 ms mixing time shows the correlation of ten amide protons with methyl-groups resonating around 1.0 p.p.m. which can only arise from leucine spin-systems. The only other methyl-bearing amino acids present in the peptide—Thr4 and Thr7—can be distinguished from the leucines as the Thr-amide proton shows characteristic cross-peaks in the 'fingerprint region' with both its a- and /3-CH. The NH of Gly3 is readily assigned as it is the only proton visible at T = 290 K which shows correlations with just two others at 3.86 and 4.01 p.p.m. This is confirmed by inspection of the COSY spectrum where a cross-peak between both Ca-protons of Gly 1
can be observed. The NH of Glyl is observed only in spectra recorded at T = 277 K where it resonates at 8.28 p.p.m. Both Phe-residues are assigned based on their cross-peak pattern which is typical of AMX-spin systems, and are readily correlated with their amide protons in the TOCSY spectrum. This spectrum also gives the total correlation of the 'long side chain' protons of the two Lys and two Arg residues with their respective NHs. This
Gin 26
Leu 2
ppm 9.1 9.0 8.9 8.8 B.7 8.6 8.5 8.4 8.3 8.2 8.1 8.0 7.91 l 7.8
Fig. 1. 'H NMR spectrum of 4.5 mM HELP in CD3OH recorded at 600 MHz and at a temperature of 290 K. Prior to Fourier transformation the data were
multiplied by a Gaussian window function.
leaves six amide protons which belong to the peptide's four Glus and two Gins. Four of them resonate between 8.45 p.p.m. and 8.48 p.p.m. whereas the others are located at 7.81 p.p.m. and 7.99 p.p.m. This implies that the first group comprises the four Glu-NHs and the second the NHs of the Gins. This finding is confirmed in the course of the sequence specific assignment of the amide protons.
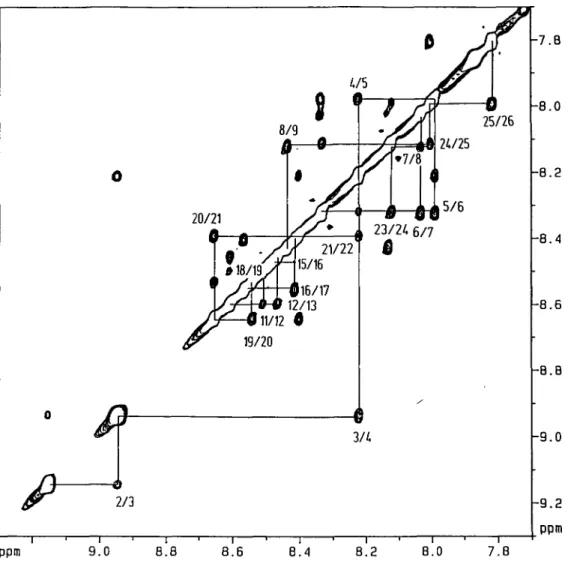
Sequence specific assignment
Figure 3 shows NOE connectivities between the amide protons of adjacent residues. The assignment starts with the highest field shifted amide proton at 7.81 p.p.m. which has only one cross-peak with the NH at 7.99 p.p.m. As both of these are of the Glx-type they are assigned to the C-terminal Gln26 and Gln25, respectively. The chain of NH-NH-connectivities can be followed up the backbone to Phel9. Another string of NOEs starts with Leu2 (or Glyl in the spectrum recorded at 277 K) on the N-terminal side of the peptide and extends to Leu9. Having assigned Phel9, the remaining Phe-residue must be number 11 in the chain, which shows NH-NH-NOE-cross-peaks with one Glu (which must be Glu 10) and Leu 12. The latter has a cross-peak with another Leu, Leul3. This leaves the 'core' of the peptide, which comprises Glu 14 to Glu 18, whose amide protons all resonate between 8.40 p.p.m. and 8.55 p.p.m. Cross-peaks between these resonances are best seen in the NOESY recorded in CD3OD at 277 K. In this spectral region there are cross-peaks
connecting a segment of Glu-Leu-Leu-Glu. Their sequence specific assignment remains ambiguous in the first instance, because of the inherent symmetry of this peptide. However, there is one weak cross-peak between Leu20 and a Glu-residue which is interpreted as a contact between the amide protons of Leu20
Table I. 3JHN-HO a n c' corresponding dihedral angles <p and * for HELP in
CD3OH. < ¥ " > M D a nd < * > M D a r e the values of the dihedral angles as
an average over the molecular dynamics analysis runs
Residue NH-CaH <«»MD Glyl Leu2 Gly3 Thr4 Leu5 Leu6 Thr7 Leu8 Leu9 Glu 10 Phell Leul2 Leul3 Glu 14 Glu 15 Leul6 Leul7 Glu 18 Phel9 Leu20 Lys21 Arg22 Lys23 Arg24 Gln25 Gln26 — 3.8 5.5 4.4 3.9 4.3 4.0 4.6 4.4 4.1 4.1 4.3 4.0 4.3 3.9 4.3 4.2 4.2 3.9 4.0 4.0 3.9 3.9 4.0 4.3 6.0 7.1 — -57 -70 -62 -57 -61 -58 -63 -62 -59 -59 -61 -58 -61 -57 -61 -60 -60 -57 -58 -58 -57 -57 -58 -61 -74 -83 — -55.9 -58.5 -62.5 -59.8 -59.0 -64.2 -61.9 -60.4 -59.6 -60.7 -60.4 -60.4 -59.8 -60.3 -59.6 -59.6 -58.0 -61.4 -59.9 -60.5 -58.2 -60.5 -62.8 -74.1 -84.0 -141.3 -37.9 -51.9 -40.1 -45.1 -46.6 -39.7 -44.3 -43.3 -45.6 -45.4 -43.2 -47.0 -43.5 -43.4 -48.4 -43.0 -49.3 -43.3 -43.3 -45.9 -42.0 -37.8 -39.0 -11.1 61.4 335
L17 L9 L6 L8 L5 L2 G3 L13 L16 K23, K21 T7 R24 - 1 . 0 »K23
V
-1.5 R24 R22 NH, Q25 -2.0 Q26 -2.5 ppm 9.0 —I ' ' 1 " 1— 8.5 8.0 ""• ' 1 — 7.5 -3.0 -3.5 -4.0 ppmFig. 2. NH (F2 axis)-aliphatic (F, axis) region of a CLEAN TOCSY-spectrum of 4.5 mM HELP in CD3OH recorded at 290 K with a mixing time of
100.2 ms. The spin systems are indicated by continuous lines.
and Glul8. This allows further the unambiguous assignment of the fragment mentioned above as Glul8-Leul7-Leul6-Glul5 leaving one NH unassigned which must be Glul4. This is consistent with the observation of NOEs between the Ca-proton
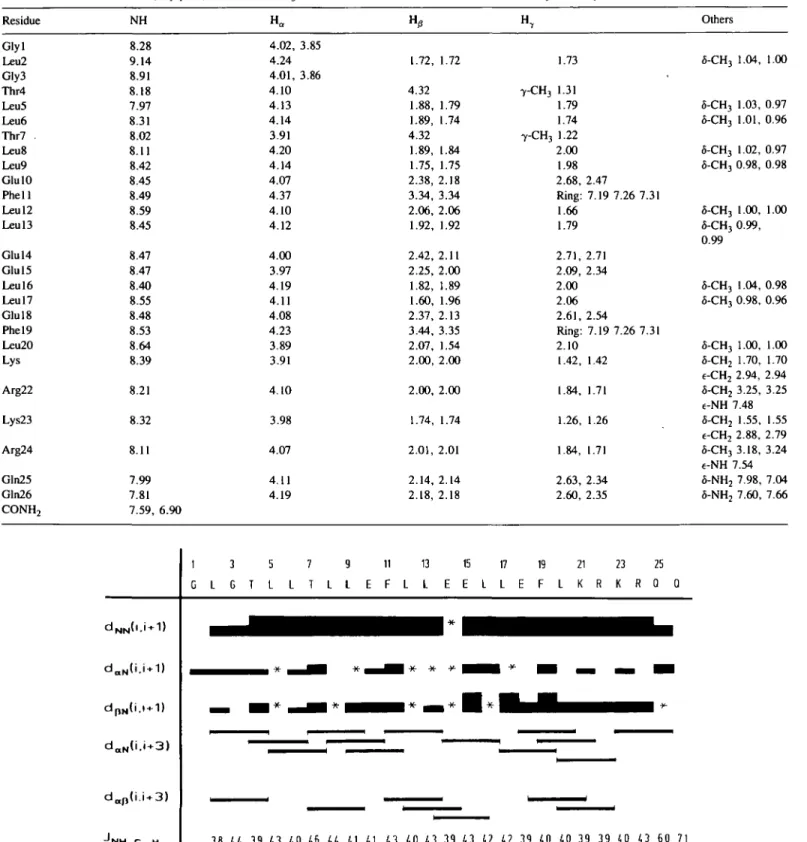
of Phel 1 and both the NH of Glul4 and Glul5 as well as with other NOEs in the fingerprint region and in other parts of the spectrum. Table II lists the assigned proton resonances of the peptide, and a summary of the observed NOEs is given in Figure 4. The predominance of leucine and glutamic acid residues in the sequence gives rise to some degeneracies in the proton chemical shifts resulting in overlap of cross-peaks. This effect is especially severe in the spectral regions where NOESY peaks between Ca-protons and CB-protons respectively and
NH-336
protons of adjacent residues are observed. For the same reason a stereospecific assignment of methylene protons and methyl groups was not feasible.
Secondary structure of HELP
The NOESY spectra of HELP show all the patterns that are characteristic of an a-helical arrangement of the peptide backbone. Starting with Leu2 and extending up to Gln25, strong or medium strong NOEs corresponding to distances d ^ are observed between most of the adjacent amide protons, as shown in Figure 3. Some of the NOEs that are not seen in this figure, but are documented in Figure 4, are taken from NOESY spectra recorded at a lower temperature or from cross-sections through
20/21 25/26 15/6 Ml/12 19/20 3/4 2/3 -7.B -8.0 -8.2 -8.4 -8.6 -8.8 -9.0 -9.2 ppm ppm 9.0 8.8 8.6 8.4 8.2 8.0 7.8
Fig. 3. NH-NH region of a NOESY-spectrum of HELP in CD3OH at 290 K with a mixing time of 240 ms. Cross-peaks between the amide protons are labelled with the sequence positions of the residues. Sequential connectivities are indicated by continuous lines.
corresponding rows and columns in the case of cross-peaks close to the diagonal. The presence of both consecutive medium-range NOEs daN (i, i+3) and da(3(i, i + 3) throughout the sequence is
another strong indication that the proposed secondary structure was accomplished. The aforementioned predominance of leucine and glutamic acid residues in the peptide explains also why the observation of medium-range NOEs da)3(i, i+3) is not complete.
The 3JHN-Ha coupling constants provide further evidence of a
helical fold, as a series of three or more constants smaller than 6 Hz is diagnostic of that structure element (Wuthrich, 1986). With values smaller than 5 Hz, as are observed from Glyl to Arg24, they are suggestive of a very large population of helical structures of HELP in methanolic solution. Based on similar considerations as given in Bradley et al. (1990) and with the same assumption of a two-state model with a helical and a random coil arrangement of the peptide backbone, we can estimate that the time-averaged helical population for residues 1 —24 is more than 80%.
Molecular dynamics simulations
For the actual structure determination a total of 121 NOE-derived distances (70 of them being inter-residue ones) were incorporated in the GROMOS force field using the usual semi-harmonic potential for the distance information. In addition 25 dihedral angle restraints were included based on the calibration curve between 3JHN-Ha a nd t n e a ng le <f> (pardi et al., 1984). Attempts
to start the calculations with an extended conformation of the peptide resulted only occasionally in reasonable final structures. A better approach using the 'random' structures created as described in Materials and methods, gave more satisfying results as cis/trans isomerizations of peptide bonds were less frequent. About 50 of these structures were subjected to molecular dynamics runs covering the time span between 0 ps and 23 ps. Structures which then showed more than three severe violations of the inter-residue distance restraints ( > 0.05 run) were discarded as it was found that in the further course of the simulations these restraints could not be satisfied. Seven configurations with few, minor violations of the distance restraints and all showing helical structures were subjected to a final analysis. The numbers of distance violations together with the relevant energies after energy minimizing are listed in Table m . The energy values for the distance (Edr) and dihedral (Edlr) restraints are reasonably low,
as well as the values for the total energy (E,ot). The only
severely violated distance restraint in structures II and IV to VI is the intra-residue one between the NH of Thr7 and the /3-proton of the same amino acid. A possible reason for this will be discussed below.
Hydrogen bonds within HELP
As a check of the helical folding of HELP, the formation and breaking of hydrogen bonds was monitored during the analysis of the molecular dynamics runs. Table IV lists all hydrogen bonds
Table II. Residue Glyl Leu2 Gly3 Thr4 Leu5 Leu6 Thr7 . Leu8 Leu9 GlulO Phell Leu 12 Leul3 Glul4 Glul5 Leu 16 Leu 17 Glul8 Phel9 Leu20 Lys Arg22 Lys23 Arg24 Gln25 Gln26 CONH2 NH 8.28 9.14 8.91 8.18 7.97 8.31 8.02 8.11 8.42 8.45 8.49 8.59 8.45 8.47 8.47 8.40 8.55 8.48 8.53 8.64 8.39 8.21 8.32 8.11 7.99 7.81 7.59, 6.90 H« 4.02, 3.85 4.24 4.01, 3.86 4.10 4.13 4.14 3.91 4.20 4.14 4.07 4.37 4.10 4.12 4.00 3.97 4.19 4.11 4.08 4.23 3.89 3.91 4.10 3.98 4.07 4.11 4.19 1.72, 1.72 4.32 1.88, 1.79 1.89, 1.74 4.32 1.89, 1.84 1.75, 1.75 2.38, 2.18 3.34, 3.34 2.06, 2.06 1.92, 1.92 2.42, 2.11 2.25, 2.00 1.82, 1.89 1.60, 1.96 2.37, 2.13 3.44, 3.35 2.07, 1.54 2.00, 2.00 2.00, 2.00 1.74, 1.74 2.01, 2.01 2.14, 2.14 2.18, 2.18 1.73 7-CH3 1.31 1.79 1.74 7-CH3 1.22 2.00 1.98 2.68, 2.47 Ring: 7.19 7.26 7.31 1.66 1.79 2.71, 2.71 2.09, 2.34 2.00 2.06 2.61, 2.54 Ring: 7.19 7.26 7.31 2.10 1.42, 1.42 1.84, 1.71 1.26, 1.26 1.84, 1.71 2.63, 2.34 2.60, 2.35 Others 6-CH3 1.04, 1.00 5-CHj 1.03, 0.97 6-CH3 1.01, 0.96 5-CH3 1.02, 0.97 5-CH3 0.98, 0.98 5-CHj 1.00, 1.00 5-CH3 0.99, 0.99 5-CH3 1.04, 0.98 3-CH3 0.98, 0.96 6-CH3 1.00, 1.00 6-CH2 1.70, 1.70 e-CH2 2.94, 2.94 6-CH2 3.25, 3.25 e-NH 7.48 5-CH2 1.55, 1.55 e-CH2 2.88, 2.79 8-CH3 3.18, 3.24 e-NH 7.54 6-NH2 7.98, 7.04 5-NH2 7.60, 7.66 dN N( i . i da N( i > 3 ) dap(i.i + 3) JNH-C_H 1 3 5 7 9 11 13 15 17 19 21 2 3 25 G L 6 T L L T L L E F L L E E L L E F L K R K R Q Q 38 44 39 4.3 40 46 44 41 41 43 40 43 39 43 42 42 39 40 40 39 39 40 43 60 71
Fig. 4. Summary of the inter-residue NOEs of HELP. The heights of the bars correspond to the intensities of the NOEs. An asterisk indicates that no NOE
could be observed due to overlap of the signals.
occurring in more than 10% of the total analysis time and averaged over all structures. The occupancy of more than 80% of H-bonds between the amide proton of residue i and the carbonyl oxygen of residue i —4 for Leu6 and from Leu8 up to Lys23 gives clear evidence for the presence of a helical secondary structure in this core region of HELP. The somewhat lower
338
populated hydrogen-bond at Leu5 is as expected as there will be some unravelling of the helix at the N-terminus. Thr7 deserves special attention as there are three H-bonds which are significantly populated. With an occurrence of 54.3%, the expected H-bond between the amide proton of this amino acid and the carbonyl oxygen of Gly3 is markedly underrepresented as compared to
Table m . Energies and distance restraints violations of the seven final
structures (m kJ mol~') using a force constant K,jr = 3000 kJ moP1 nm- 2
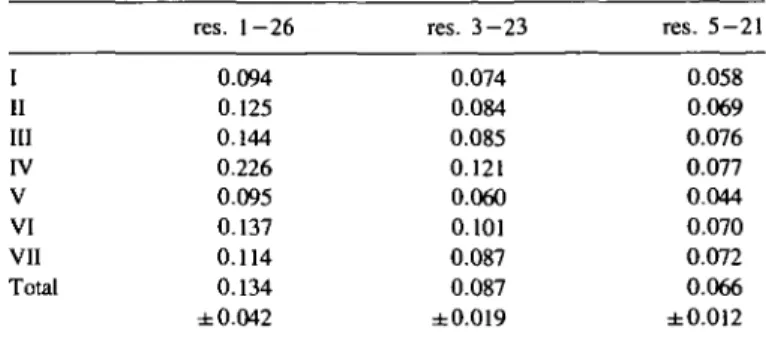
Table V. (A) RMS-deviations of the seven final structures versus an 'ideal
helix' averaged over all backbone atoms (in nm).
E,ola p bbdr d >0.02 nm I II III
rv
V VI VII 2068.9 2080.7 1998.8 2091.8 2045.6 2058.0 2031.6 11.2 12.5 22.9 10.5 15.8 12.9 7.3 2.9 3.4 4.7 2.7 9.2 4.2 2.8 aE,ol, total energy.bEdr, energy associated with the distance restraints. cEd|r, energy associated with the dihedral restraints.
Table IV. Hydrogen bonds within HELP averaged over all seven final
structures as a result of the last 20 ps of the molecular dynamics runs with more than 10% occurrence
Donor Acceptor Occurrence (in
Thr4 NH Leu5 NH Leu6 NH Thr7 NH Thr7 O7H Thr7 O7H Leu8 NH Leu9 NH GlulO NH Phell NH Leu 12 NH Leul3 NH Glul4 NH Glul5 NH Leul6 NH Glul8 NH GU1I8 Of2H Phel9 NH Leu20 NH Lys21 NH Arg22 NH Lys23 NH Lys23 NH Arg24 NH Arg24 NH Gln25 NH Gln25 NH Gln26 NH Gln26 NH Gln26 NH Gln26 Ne2H Gln26 Ne2H Gln26 CONH, Glyl O = C Glyl O = C Leu2 O = C Gly3 O = C Thr4 O = C Gly3 O = C Thr4 O = C Leu5 O = C Leu6 O = C Thr7 O = C Leu8 O = C Leu9 O = C GlulO O = C Phell O = C Leul3 O = C Glul4 O = C Glul4 O,, GlulS O = C Leul6 O = C Leul7 O = C GU1I8 O = C Phel9 O = C Leu20 O = C Leu20 O = C Lys21 O = C Lys21 O = C Arg22 O = C Arg22 O = C Lys23 O = C Arg24 O = C Lys23 O = C Arg22 O = C Gln25 O = C 11.4 64.3 85.7 54.3 12.9 11.4 72.9 85.7 84.3 88.6 84.3 87.1 92.9 90.0 85.7 90.0 17.1 80.0 87.1 85.7 87.1 78.6 12.9 70.0 20.0 62.9 17.1 44.3 20.0 18.6 18.6 14.3 24.3
the other (i, i - 4 ) H-bonds. Instead one observes H-bonds between the side chain OH of Thr7 as donor and the backbone oxygen of Gly3 and Thr4, respectively, with a total occurrence of 24.3%. This coincides with the intra-residue distance restraint violation between the amide proton and the /3-proton of Thr7. At the C-terminus, one observes besides the normal (i, i - 4 ) H-bonds H-bonds between residues i and i - 3 and i - 2 , respectively, a feature which occurs frequently at this end of a helix. There is no evidence for an unravelling of the peptide, but the C-terminus rather deviates from an ideal a-helix towards a 3|0-helix.
res. 1-26 res. 3 - 2 3 res. 5 - 2 1 5 (0.034) 3 (0.055) 7 (0.054) 3 (0.047) 5 (0.052) 4 (0.056) 2 (0.030) I II III
rv
V VI VII Total 0.094 0.125 0.144 0.226 0.095 0.137 0.114 0.134 ± 0.042 0.074 0.084 0.085 0.121 0.060 0.101 0.087 0.087 ±0.019 0.058 0.069 0.076 0.077 0.044 0.070 0.072 0.066 ±0.012Table V. (B) average of the pairwise RMS-deviations among the seven final
structures (in nm)
res. 1-26 res. 3 - 2 3 res. 5 - 2 1 0.185 ±0.078 0.127 ±0.039 0.101 ±0.027
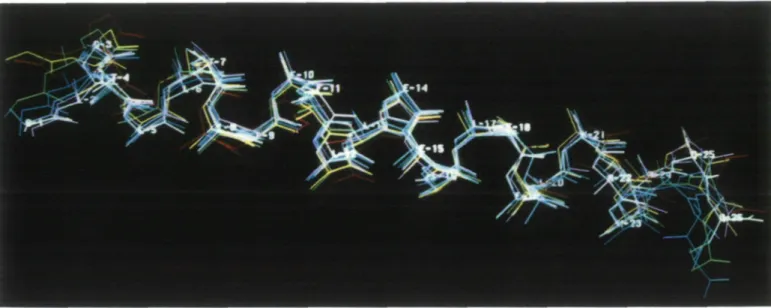
As a further criterion for the correct helical folding of the calculated structures, they were compared to an 'ideal' helix, which was model-built on the graphics display and then energy minimized. The root mean square (RMS)-deviations for them averaged over the atoms of the backbone are given in Table V. The mean value of 0.133 nm for all structures and summed over all residues is reasonably low, and it decreases further to 0.066 nm when averaged only over residues 5—21. This might be explained by some curvature which is common to all the NMR-derived structures of this peptide. A backbone superposi-tion of the seven final structures is shown in Figure 5.
Discussion
The actual determination of the three-dimensional structure of the designed helical peptide HELP in methanolic solution gives us the possibility to check on the principles underlying the design, as described by Moser (1992).
Evidence for the proposed helical structure
Already the first one-dimensional 'H-NMR-spectrum of HELP dissolved in CD3OD showed evidence for the proposed
secondary structure. The observation of J-coupling constants around 4 Hz and the fact that nearly all amide protons showed very slow exchange with the solvent protons indicated the presence of a very stable, hydrogen-bonded helical arrangement of the peptide in solution. The detailed analysis of the NMR-spectra and the results of the molecular dynamics calculations show indeed that at least residues 5 - 2 4 are arranged in an a-helical structure. So we conclude that the criteria for the selec-tion of the amino acids in the sequence, i.e. the helical propen-sity and the hydropathy, were correct.
Global fold for HELP
Inspection of the final structures shows clearly that the proposed amphiphilic arrangement of the side chains emerged as a consequence of the folding of the peptide. Indeed, the polar side chains of glutamic acid constitute the hydrophilic face, allowing at least to a certain extent the formation of a hydrogen bond between the side chain carboxylate groups of Glul5 and Glul8. As intended the apolar Leu-residues occupy the hydrophobic face. Additionally, one observes a slight bending of the helix axis towards this side suggesting some clustering of the hydrophobic
Fig. 5. Backbone representation of the seven final structures of HELP, superimposed for minimum RMS deviation between residues Gly3 and Lys23.
side chains. This may also be supported by a mutual residual repulsion of the Glu side chains.
It is clear from our results the chosen length of 26 residues is more than the minimum length for a peptide to adopt a stable secondary structure. End effects do not seem to play such an important role, especially in our design with the C-terminal a-carboxyl group blocked by an amide group. Unravelling of the helix is observed only at the N-terminus, where the first four residues are involved. Based on the pattern of hydrogen bonds the C-terminus shows a tendency towards formation of an even more compact 3I0-helix. This arrangement compares very well
with the solution structure of the peptide toxin melittin (Bazzo
et ai, 1988), whose sequence served as a template for HELP
and from which the six C-terminal residues were taken over unchanged.
The severe distance restraint violation within Thr7, as mentioned above, can be explained in at least two ways. The first explanation would be a misinterpretation of the NOE-derived distance between the amide proton and the beta proton of this amino acid. However, this can be ruled out as three of the seven final structures do not show any violation of this restraint. The second reason could be that the force constant for the distance restraints was not high enough to counteract the energetically favourable formation of a hydrogen bond between the carbonyl oxygen of Gly3 and the side chain OH of Thr7. The latter locks these structures in a slightly distorted conformation of the side chain, for which there is no experimental evidence. This also explains the observed lowered occurrence of the H-bond between the amide proton of this residue and the carbonyl oxygen of Gly3, which one would expect for a regular a-helix, and the existence of an H-bond between the side chain oxygen of this threonine and Gly3.
The dynamic properties of HELP—as manifested in the formation and breaking of the hydrogen bonds observed during the molecular dynamics simulations—correlate very well with the estimate of the helical content as deduced from the population-weighted average of the 3JHN-H« coupling constants. With this
determination at an atomic resolution of the three-dimensional structure of a designed helical peptide, the peptide design circle is closed. Having these results at hand, one can even go further towards designing more sophisticated amphiphilic a-helices,
which could be used to tailor specific minienzymes with proposed catalytic activities. HELP with its unexpected, extraordinarily high stability when compared with other naturally occurring small peptides may also be used as a valuable a-helix model enabling the study of the initial folding of proteins and of the factors which stabilize the three-dimensional structure.
Acknowledgements
We thank Prof. Dietmar Schomburg for his support of this work and Dr Hans-Jiirgen Hecht for valuable discussions. We gratefully acknowledge Dr Victor Wray for his stimulating interest in this project as well as for his careful and critical reading of the manuscript. We thank Dr Martin Zulauf for performing the light scattering experiments. This work was supported by a grant of the Swiss National Science Foundation to B.Gutte.
References
Argos.P. and Palau.J. (1982) Int. J. Peptide Protein Res., 19, 380-393. Bax,A. and Davis.D.G. (1985) 7. Magn. Res., 65, 355-360.
Bazzo.R., Tappin,M.J., Pastore.A., Harvey,T.S., Carver,J.A. and Campbell,I.D. (1988) Eur. 7. Biochem., 173, 139-146.
Billeter.M., Braun.W. and Wiithrich,K. (1982)7. Mol. Bioi, 155, 321-346. Bradley.E.K., Thomason,J.F., Cohen.F.E., Kosen.P.A. and Kuntz.I.D. (1990)
J. Mol. Bioi, 215, 607-622.
Chou.P.Y. and Fasman,G.D. (1974) Biochemistry, 13, 211-221. Davis,D.G. and Bax.A. (1985) J. Am. Chem. Soc, 107, 2820-2821 DeGrado.W.F. (1988)'/Mv. Prot. Chem., 39, 51-118.
DeGrado.W.F., Wasserman.Z.R. and Lear,J.D. (1989) Science, 243, 622-628. Greenfield.N. and Fasman,G.D. (1969) Biochemistry, 8, 4108-4116. Griesinger.C, Otting.G., Wiithrich.K. and Emst.R.R. (1988)7. Am. Chem. Soc.,
110, 7870-7872.
Gurevich.A.Z., Barsukov.I.L., Arseniev.A.S. and Bystrov.V.F. (1984)7. Magn. Res., 56, 471-478.
Haasnoot.C.A.G., vande Ven.F.J.M. and Hilbers.C.W. (1984)7. Magn. Res., 56, 343-349.
Jeener,J., Meier,B.H., Bachmann,P. and Emst,R.R. (1979)7. Chem. Phys., 71, 4546-4553.
Klaus.W., Dieckmann,T., Wray.V., Schomburg.D., Wingender.E. and Mayer,H. (1991) Biochemistry, 30, 6936-6942.
Macura.S., Huang,Y., Sutter.D. and Emst.R.R. (1981) 7. Magn Res , 43, 259-281.
Marion,D. and Wiithrich.K. (1983) Biochem. Biophys. Res. Common., 113, 967-974.
Moser.R. (1992) Prot. Engng, 5, 323-331.
Neidig,K.-P. and Kalbitzer.H.R. (1990)7. Magn. Res., 88, 155-160. NUges.M., Clore.G.M. and Gronenborn.M. (1988) FEBSLett., 239, 129-136. Palau,J., Argos.P. and Puigdomenech.P. (1982) In 7 Peptide Protein Res., 19,
394-401.
Pardi.A., Billeter.M. and Wuthrich.K. (1984)/ Mol. Biol, 180, 741-751. Provencher,S.W. and GlocknerJ. (1981) Biochemistry, 20, 3 3 - 3 7 . Provencher.S.W. (1982) Comp. Phys. Commun., 27, 213-242.
Rance.M, Sorensen,O.W., Bodenhausen,G., Wagner,G., Ernst,R.R. and Wuthrich.K. (1983) Biochem. Biophys. Res. Commun., 117, 479-485. Redfield.A. and Kunz,S.D. (1975)7. Magn. Res., 19, 250-254. Schomburg.D. and Reichelt.J. (1988) J. Mol. Graphics, 6, 161-165. Shoemaker.K.R., Kim,P.S., York.E.J., Stewart,J.M. and Baldwin.R.L. (1987)
Nature, 326, 563-567.
van Gunsteren.W.F. and Berendsen.H.J.C. (1987) GROMOS Manual. Biomos, Groningen.
Wright.P.E., Dyson.H.J. and Lerner,R.A. (1988) Biochemistry, 27, 7167-7175. Wuthrich,K., Billeter.M. and Braun,W. (1983) J. Mol. Biol., 169, 949-961. Wuthrich.K. (1986) NMR of Proteins and Nucleic Acids. John Wiley and Sons,
New York.
Zuiderweg.E.R.P., Hallenga.K. and Olejniczak.E.T. (1986) J. Magn. Res., 70, 336-343.
Received on November 5, 1991; revised and accepted on February 25, 1992