www.atmos-chem-phys.net/9/413/2009/
© Author(s) 2009. This work is distributed under the Creative Commons Attribution 3.0 License.
Chemistry
and Physics
Validation of version-4.61 methane and nitrous oxide observed
by MIPAS
S. Payan1, C. Camy-Peyret1, H. Oelhaf2, G. Wetzel2, G. Maucher2, C. Keim2, M. Pirre3, N. Huret3, A. Engel4, M. C. Volk4, H. Kuellmann5, J. Kuttippurath5,*, U. Cortesi6, G. Bianchini6, F. Mencaraglia6, P. Raspollini6, G. Redaelli7, C. Vigouroux8, M. De Mazi`ere8, S. Mikuteit2, T. Blumenstock2, V. Velazco5, J. Notholt5, E. Mahieu9, P. Duchatelet9, D. Smale10, S. Wood10, N. Jones11, C. Piccolo12, V. Payne13, A. Bracher5, N. Glatthor2, G. Stiller2, K. Grunow14, P. Jeseck1, Y. Te1, and A. Butz15
1Laboratoire de Physique Mol´eculaire pour l’Atmosph`ere et l’Astrophysique, Universit´e Pierre et
Marie Curie-Paris 6, Paris, France
2Institut f¨ur Meteorologie und Klimaforschung, Forschungszentrum Karlsruhe, Karlsruhe, Germany 3Laboratoire de Physique et Chimie de l’Environnement/CNRS, Orl´eans, France
4Institut f¨ur Atmosph¨are und Umwelt, J. W. Goethe Universit¨at Frankfurt, Frankfurt, Germany
5Institute of Environmental Physics/Institute of Remote Sensing, University of Bremen, Bremen, Germany 6Istituto di Fisica Applicata “Nello Carrara”, Sesto Fiorentino, Italy
7Universit`a di L’Aquila, Dipartimento di Fisica, L’Aquila, Italy 8Belgian Institute for Space Aeronomy, Brussels, Belgium
9Institut d’Astrophysique et de G´eophysique, University of Li`ege (ULg), Li`ege, Belgium 10National Institute for Water and Atmospheric Research (NIWA), Lauder, Otago, New Zeeland 11University of Wollongong, Wollongong, Australia
12Atmospheric, Oceanic and Planetary Physics, Department of Physics, Oxford University, Oxford, UK 13Atmospheric and Environmental Research, Inc, Lexington, Massachusetts, USA
14Meteorologisches Institut der FU Berlin, Berlin, Germany 15Institut f¨ur Umweltphysik, University of Heidelberg, Germany
*now at: Laboratoire de M´et´eorologie Dynamique, Ecole Polytechnique, Palaiseau, France
Received: 18 June 2007 – Published in Atmos. Chem. Phys. Discuss.: 17 December 2007 Revised: 13 October 2008 – Accepted: 27 October 2008 – Published: 19 January 2009
Abstract. The ENVISAT validation programme for the
at-mospheric instruments MIPAS, SCIAMACHY and GOMOS is based on a number of balloon-borne, aircraft, satellite and ground-based correlative measurements. In particular the activities of validation scientists were coordinated by ESA within the ENVISAT Stratospheric Aircraft and Bal-loon Campaign or ESABC. As part of a series of similar pa-pers on other species [this issue] and in parallel to the con-tribution of the individual validation teams, the present pa-per provides a synthesis of comparisons pa-performed between MIPAS CH4and N2O profiles produced by the current ESA
operational software (Instrument Processing Facility version
Correspondence to: S. Payan
4.61 or IPF v4.61, full resolution MIPAS data covering the period 9 July 2002 to 26 March 2004) and correlative mea-surements obtained from balloon and aircraft experiments as well as from satellite sensors or from ground-based instru-ments. In the middle stratosphere, no significant bias is ob-served between MIPAS and correlative measurements, and MIPAS is providing a very consistent and global picture of the distribution of CH4 and N2O in this region. In
aver-age, the MIPAS CH4 values show a small positive bias in
the lower stratosphere of about 5%. A similar situation is observed for N2O with a positive bias of 4%. In the lower
stratosphere/upper troposphere (UT/LS) the individual used MIPAS data version 4.61 still exhibits some unphysical os-cillations in individual CH4and N2O profiles caused by the
414 S. Payan et al.: Validation of MIPAS CH4and N2O
these problems into account, the MIPAS CH4and N2O
pro-files are behaving as expected from the internal error estima-tion of IPF v4.61 and the estimated errors of the correlative measurements.
1 Introduction
On 1 March 2002, the Michelson Interferometer for Pas-sive Atmospheric Sounding, MIPAS (Fischer and Oelhaf, 1996; ESA, 2000; Fischer et al., 2007), was launched on the Sun-synchronous polar-orbiting European ENVIronmen-tal SATellite (ENVISAT). MIPAS is a Fourier transform spectrometer providing limb spectra of atmospheric infrared emission between 685 cm−1 (14.60 µm) and 2410 cm−1
(4.15 µm) at a spectral unapodised resolution of 0.035 cm−1
(15 cm maximum optical path difference).
As recommended by ESA, validation results (presented and discussed during the second Atmospheric Chemistry Validation of ENVISAT workshop in May 2004 at ESRIN, Frascati, and during the first MIPAS Validation Meeting in November 2005 in Karlsruhe) had to be compared with prod-ucts generated by the latest version of the operational pro-cessing software. For the MIPAS CH4and N2O profiles
dis-cussed here, the corresponding products were generated by the Instrument Processor Facility or IPF v4.61.
A summary of MIPAS measurements, data processing, al-gorithm, and error budget is briefly described in Sect. 2, whereas validation experiments and analysis methods are presented in Sect. 3.
The correlative measurements for MIPAS CH4and N2O
profiles considered here (see Table 1) have been obtained by balloon experiments (Sect. 4) and by aircraft experi-ments (Sect. 5) participating in the ENVISAT Stratospheric Aircraft and Balloon Campaign (ESABC) coordinated by P. Wursteisen (2003).
An interesting complementary dataset allowing better statistics (but with reduced height resolution) is provided in Sect. 6 by ground-based profiles of CH4and N2O derived by
inversion of atmospheric solar absorption spectra recorded using Fourier transform infrared spectroscopy (FTIR).
A dataset with more global coverage and allowing bet-ter statistics is provided by HALOE satellite observations (Sect. 7).
Since methane and nitrous oxide are passive tracers in the lower stratosphere, the availability of simultaneous profiles of these 2 species affords the possibility of internal consis-tency checks by examining the corresponding CH4/N2O
cor-relation plots (Sect. 8), which will be discussed in Sect. 8 for correlative balloon datasets.
Finally, in Sect. 9, with the caveat that the amount of data available for comparisons has its own limitations, some con-clusions and recommendations are given.
2 Summary of MIPAS measurements, data processing, algorithm, and error budget
2.1 Measurements
The wide mid-infrared spectral region covered by MIPAS en-ables simultaneous observation of various trace gases. EN-VISAT orbits the Earth once every ∼100 min, resulting in
∼14 polar orbits per day. During the original standard ob-servation mode, which generally was the nominal one until 26 March 2004, the field-of-view is 30 km in the horizontal and about 3 km in the vertical at the tangent points. One limb scan of the standard observation mode covers the altitude range of 6–68 km in 17 steps with tangent altitude distance of 3 km for the 13 lower tangent altitudes, followed by tangent point around 47 km, 52 km, 60 km and 68 km. These mea-surements cover the whole latitude band from pole to pole with 14.3 orbits per day and about 73 limb scans along one orbit.
Generation of calibrated, so-called level-1B radiance spec-tra is described by Nett et al. (2002) and Kleinert et al. (2007). Several data analysis schemes have been devel-oped for near-real time and off-line retrieval of profiles of at-mospheric trace species from calibrated MIPAS spectra pro-vided by the European Space Agency (ESA) (von Clarmann et al., 2003).
During the period from mid-May until mid-October 2003 MIPAS operated quasi-continuously, with the exception of the periods 19–20 May, 25 May–4 June and 5–7 September, where no data are available. Validation of the reduced spec-tral resolution MIPAS data collected after 26 March 2004 is not covered in the present paper.
The CH4 and N2O distributions presented in this paper
were reduced by the off-line processor under ESA respon-sibility (Raspollini et al., 2006).
2.2 Error budget
The MIPAS L2 products contain estimates of random er-ror derived from the propagation of the radiometric noise through the retrieval. The noise itself varies with time, steadily rising between ice-decontamination periods (needed because of ice deposition on optics or detectors), but its con-tribution to the L2 random error also depends on the atmo-spheric temperature, which controls the total radiance re-ceived. Hence, for all species, the random error varies lat-itudinally/seasonally with atmospheric temperature, with a superimposed time dependence on ice-decontamination pe-riods.
The main source of the random error of the ESA L2 Off-line MIPAS profiles is the noise error due to the mapping of the radiometric noise on the retrieved profiles. This predicted random error is proportional to the NESR (Noise Equivalent Spectral Radiance) and inversely proportional to the Planck
Table 1. Satellite and ground based contribution to the validation of MIPAS CH4and N2O profiles.
Balloon
Instrument Flight date/campaign period CH4 N2O Latitude coverage
IBEX 28–29 Jul 2002 √ Mid-latitude
TRIPLE 24 Sep 2002 √ √ Mid-latitude
MIPAS-B
24 Sep 2002 √ √ Mid-latitude
20/21 Mar 2003 √ √ High latitude
3 Jul 2003 √ √ High latitude
SPIRALE 2 Oct 2002
√ √
Mid-latitude
21 Jan 2003 √ √ High latitude
LPMA
4 Mar 2003 √ √ High latitude
23 Mar 2003 √ √ High latitude
9 Oct 2003 √ √ Mid-latitude
24 Mar 2004 √ √ High latitude
Aircraft
MIPAS-STR 22 Jul 2002
√ √
Mid-latitude
28 Feb to 16 Mar 2003 √ √ High latitude
ASUR 14 flights from Oct 2002 to Mar 2003 √ Low, mid and high latitudes
SAFIRE-A 24 Oct 2002 √ Mid-latitudes
Ground
NDSC–FTIR From 2002-07-06 to 2004-03-26 √ √ High latitudes
NDSC-FTIR From 2002-07-06 to 2004-03-26. √ √ Mid and high latitudes
Satellite
HALOE From 22 Jul to 24 Mar 2004 √ Mid and high latitudes
function (therefore atmospheric temperature), but it does not directly depend on the VMR of the gases.
In the ESA retrieval processing, first, temperature and tan-gent pressure are retrieved simultaneously, before the 6 “key species” (H2O, O3, HNO3, CH4, N2O, HNO3, and NO2)
VMR profiles are retrieved individually in sequence. The effects of temperature and pressure errors on the VMR re-trievals are taken into account in the predicted error estima-tion (see Piccolo and Dudhia, 2007, for details).
The MIPAS noise error is available as covariance matrices included as part of the MIPAS level 2 products. The sys-tematic errors are described in Dudhia et al. (2002) and can be find in the Oxford web page (www.atm.ox.ac.uk/group/ mipas/err) where errors are divided into purely systematic errors with random variability and in purely systematic er-rors, with one exception: the altitude shift has been taken as a systematic error with random variability.
The total error is the root sum square of systematic error and random error components. The random errors take into account the propagation of instrument noise through the
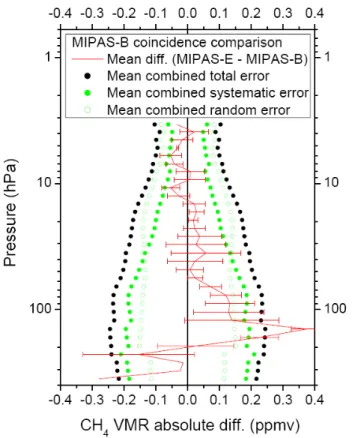
re-trieval. The definition of systematic error here includes ev-erything which is not propagation of the random instrument noise through the retrieval. However, using these errors in a statistically correct manner for comparisons with other mea-surements is not straightforward. Each systematic error has its own length/time scale: on shorter scales it contributes to the bias and on longer scales contributes to the standard de-viation of the comparison. Fortunately, two of the larger sys-tematic errors (propagation of error due to pressure and tem-perature retrieval, and spectroscopic database errors) can be treated properly. The p/T propagation error is uncorrelated between any two MIPAS profiles (since it is just the prop-agation of the random component of the p/T retrieval error through the VMR retrieval). Spectroscopic database errors are constant but of unknown sign, so will always contribute to the bias of any comparison. Of the other significant errors, the calibration-related errors should, in principle, be uncor-related between calibration cycles. However analysis of the residuals suggests that these errors are almost constant and could be included in the bias. Figure 1 presents for CH4and
416 S. Payan et al.: Validation of MIPAS CH4and N2O 1000 100 10 1 0.1 0 10 20 30 40 50 60 70 80 90 CH 4 VMR Error (%) Pr es su re ( h Pa) TOTAL Systematic Random 1000 100 10 1 0.1 0 20 40 60 80 100 120 140 N2O VMR Error (%) Pr es su re ( h Pa) TOTAL Systematic Random Figure 1
Fig. 1. Random, systematic and total errors for the nominal sets of microwindows used in off-line processing in normal MIPAS
oper-ations for CH4(left panel) and N2O (right panel), and for a global
composite of results for the five reference atmospheres, with twice the weight given to results from the polar winter case.
for N2O the vertical distribution of random, systematic and
total errors for a global composite of the five reference atmo-spheres, with twice the weight given to results from the polar winter case (see Piccolo and Dudhia, 2007, for details).
3 Validation experiments and analysis methods
The correlative measurements for MIPAS CH4and N2O
pro-files considered here (see Table 1) have been obtained from a large number of in situ and remote sensing instruments car-ried out from ground, balloon, aircraft and satellite platforms participating in the ENVISAT Stratospheric Aircraft and Bal-loon Campaign (ESABC) coordinated by (Wursteisen, 2003) (see Table 1 for dates).
The coincidence criteria recommended for the intercom-parison were set to 300 km and 3 h. However, some indi-vidual research groups involved in the validation work pre-sented here have used more relaxed criteria whenever justi-fied on the basis of previous experiences. A representation of CH4 and N2O volume mixing ratio (VMR) vertical profiles
versus pressure rather than altitude has been adopted. An-other requirement to be considered for intercomparison of polar winter measurements has been a recommended maxi-mum potential vorticity (PV) difference of: 1PV/PV<15%. In addition, a reduction of vertical smoothing differences using averaging kernels and common a priori state are used when needed, i.e. when vertical resolution of MIPAS and correlative measurements are significantly different. When smoothing is applied for a given correlative experiment con-sidered in this paper, information is given in the text. The methodology of Rodgers and Connor (2003) was used to convert (depending which is the highest vertical resolution
instrument) the MIPAS or/and correlative experiment pro-files on a common vertical (pressure) grid.
The use of trajectory calculations to increase the number of coincidences (with the same baseline collocation criteria adopted for direct coincidences) has been used.
4 Comparison with validation balloon campaign data
The balloon experiments for which CH4and/or N2O profiles
(as well as the corresponding MIPAS data) were available, include FTIR remote sensing instruments operating in limb thermal emission such as IBEX (Bianchini et al., 2003) in the far-infrared and MIPAS-B (Friedl-Vallon et al., 2004) or in solar occultation such as LPMA (Camy-Peyret et al., 1995) as well as in situ samplers such as the Bonbon cryosampler (Engel et al., 1998) and in situ diode laser spectrometers such as SPIRALE (Moreau et al., 2005). They are discussed in sequence, a priority being given to the balloon experiments of the 2002 campaigns for which IPF v4.61 MIPAS CH4and
N2O profiles are available.
4.1 IBEX
The IBEX (Infrared Balloon Experiment, Istituto di Fisica Applicata “Nello Carrara”, IFAC CNR, Firenze, Italy) (Bian-chini, 2003) is a far-infrared Fourier transform spectrome-ter, which was flown during the first campaign of ESABC from Sicily (Trapani-Milo; 38◦N, 12◦E) over the Mediter-ranean to Spain on 28–29 July 2002. Because there was no coincidence between the period when IBEX was at float and an overpass of ENVISAT, the data used for comparison was taken from MIPAS limb scans performed over the Mediter-ranean within a ±1 day window covering the IBEX measure-ments.
The comparison with MIPAS v4.61 data is based on tra-jectory calculations performed by using the Global Trajec-tory Model of Universit`a di L’Aquila, since no direct coin-cidence satisfying the standard criteria of 300 km, 3 h was available for the IBEX balloon flight. Figure 2 shows the mean relative difference (red crosses) for matching pairs of MIPAS and IBEX data (with forward and back-trajectories up to 4 days), along with the combined precision (blue line) and combined total (green line) errors. The data plotted in Fig. 2 show a reasonable agreement in the mid stratosphere with some dispersion of the balloon data. The MIPAS values in the very lower stratosphere present a positive bias with re-spect to IBEX values.
4.2 MIPAS-B
ENVISAT validation flights were carried out with the cryo-genic Fourier transform infrared spectrometer MIPAS-B, the balloon-borne version of MIPAS, from Aire-sur-l’Adour (France, 44◦N) on 24 September 2002, from Kiruna (Swe-den, 68◦N) on 20/21 March 2003, and again from Kiruna
-150 -100 -50 0 50 100 150 100 10 P ressu re (h P a) difference / error (%) Figure 2
Fig. 2. Mean relative difference (red crosses) for matching pairs of MIPAS and IBEX data (with forward and back-trajectories up to 4 days), along with the combined precision (blue line) and combined total (green line) errors.
on 3 July 2003. MIPAS-B measures all atmospheric param-eters that MIPAS (MIPAS-E in this section for making the distinction) is covering. Essential for the balloon instrument is the sophisticated line of sight stabilization system, which is based on an inertial navigation system and supplemented with an additional star reference system. Averaging several spectra during one single elevation angle leads to a reduc-tion of the noise equivalent spectral radiance (NESR) and therefore to an improvement of the signal to noise ratio. The MIPAS-B data processing including instrument characteri-zation is described in Friedl-Vallon et al. (2004) and refer-ences therein. Retrieval calculations of atmospheric target parameters were performed with a least squares fitting algo-rithm (using analytical derivatives) of spectra simulated by the Karlsruhe Optimized and Precise Radiative transfer Al-gorithm (KOPRA; Stiller et al., 2002; H¨opfner et al., 2002). The resulting vertical resolution lies typically between 2 and 3 km and is therefore comparable to the vertical resolution of MIPAS-E. Retrieval calculations were performed in selected microwindows within the ν1and 2ν2bands of N2O and the
v4band of CH4. An overview on the MIPAS-B data analysis
is given in Wetzel et al. (2006) and references therein. The measurements of three MIPAS-B flights have been used in this paper: (a) Flight 11 (F11), 24 September 2002, Aire-sur-l’Adour, sequence S and N3; (b) Flight 13 (F13), 20/21 March 2003, Kiruna, sequence N3a and D15c; (c) Flight 14 (F14), 3 July 2003, Kiruna, sequence 3.
For F11 one finds two MIPAS-E comparisons (record 14 and record 15 from orbit 2975) to MIPAS-B sequence S. At low altitudes (15 km, 120 hPa), the horizontal dis-tance between both sensors is quite large for record 15 (ca. 460 km). For F13 MIPAS-E, orbits 5508 and 5515 were used for the comparison and concerning F14 the MIPAS-E data from orbit 7004 have been compared to MIPAS-B. An
Figure 3a
Fig. 3a. Comparison of MIPAS CH4v4.61 profile with MIPAS-B on 24 September 2002 with MIPAS-MIPAS-B minus MIPAS-E v4.61 differences and combined error bars on the left.
Figure 3b
Fig. 3b. Comparison of MIPAS N2O v4.61 profile with MIPAS-B on 24 September 2002 with MIPAS-MIPAS-B minus MIPAS-E v4.61 differences and combined error bars on the left.
extremely good space and time coincidence was achieved during the MIPAS-B flight of 24 September 2002 from Aire-sur-l’Adour (43◦N, 0◦E). The vertical mixing ratio profiles of CH4 and N2O and the corresponding errors are plotted
as a function of pressure for the MIPAS IPF v4.61 together with the balloon profile. An example of the comparison for a single flight sequence (sequence S of flight 11) is given in Fig. 3a and b. Oscillations are visible in the MIPAS-E pro-files below 100 hPa pressure altitude. Such oscillations were recognized in all profile comparisons between MIPAS-B and MIPAS-E.
The mean deviations between MIPAS-B and MIPAS-E for all balloon flights together are shown in Fig. 4a and b. The differences MIPAS-B minus MIPAS-E v4.61 have been compared with the combined (root sum squares) error and
418 S. Payan et al.: Validation of MIPAS CH4and N2O
Figure 4a
Fig. 4a. CH4mean deviations between MIPAS-B and MIPAS-E for all MIPAS-B flights considered in this study.
demonstrate the impact of the remaining “oscillations”: the mixing ratio values of MIPAS-E around 100 and 300 hPa are clearly overestimated and underestimated, respectively for both species.
4.3 Bonbon
The flight of the cryosampler Bonbon (Engel et al., 1998) of Institut f¨ur Atmosph¨are und Umwelt, J. W. Goethe Uni-versit¨at, Frankfurt, Germany, took place the same day as the MIPAS-B flight on 24 September 2002, also from Aire-sur-l’Adour. The v4.61 MIPAS mixing ratio profiles from 3 limb scans are plotted as a function of altitude on the left panel of Fig. 5a and b for CH4 and N2O respectively, whereas
the statistic is improved by combining five-days forward and backward trajectories “MIPAS transported” profiles (shown on the right panel) matching the cryosampler profile. The picture emerging from this comparison is consistent with pvious comparison in the mid stratosphere, where MIPAS re-sults appear to have a negative bias (in this case about −35% between 10 and 25 hPa). For this intercomparison the overall agreement in the lower stratosphere for CH4 is good when
using the trajectory matched profiles, but in the direct in-tercomparison a high bias in MIPAS CH4 values is found
Figure 4b
Fig. 4b. N2O mean deviations between MIPAS-B and MIPAS-E for all MIPAS-B flights considered in this study.
(+10% between 100 and 200 hPa). For N2O a low bias in
MIPAS values is derived at the higher altitudes, especially when using the trajectory-matched results.
However, in the mid stratosphere, significant differences are observed between the upper parts of the CH4 and N2O
profiles observed by the cryosampler and those observed by the MIPAS balloon instrument flown on the same day, indi-cating that the cryosampler measurements above 25 hPa may have been influenced by specific local conditions. This is also indicated by the significant scatter between the three nearest MIPAS profiles. Note that in general the direct inter-comparisons seem to give better results, indicating that tra-jectory matching may introduce an additional uncertainty to the intercomparison under such conditions.
4.4 SPIRALE
The SPIRALE instrument (Moreau et al., 2005) from Labo-ratoire de Physique et Chimie de l’Environnement (LPCE, Orl´eans, France) is a fast measurement rate in situ diode laser spectrometer. Two flights of SPIRALE took place in the framework of the ENVISAT validation, firstly at mid-latitudes in the fall 2002 during the ESABC campaign from Aire-sur-l’Adour, and secondly at high latitudes on 21 Jan-uary 2003 from Kiruna. For these two flights a detailed
Figure 5a
Fig. 5a. Comparison of MIPAS CH4v4.61 profiles (blue triangles) with the Bonbon cryosampler (gray circles) on 24 September 2002. The left panel is a direct comparison with 3 nearest MIPAS pro-files for the same day. The right panel displays 5 days backward and forward trajectory transported profiles matching the cryosam-pler profile for a larger statistics.
Figure 5b
Fig. 5b. Comparison of MIPAS N2O v4.61 profiles (blue triangles) with the Bonbon cryosampler (gray circles) on 24 September 2002. The left panel is a direct comparison with 3 nearest MIPAS pro-files for the same day. The right panel displays 5 days backward and forward trajectory transported profiles matching the cryosam-pler profile for a larger statistics.
analysis of the vertical structure of the stratosphere based on the N2O and CH4measurements obtained has been made by
Huret et al. (2006).
Figure 6a and b present the comparison of SPIRALE and MIPAS profiles, for CH4 and N2O respectively, measured
on 21 January 2003. In order to take into account the large difference between SPIRALE and MIPAS vertical resolution of 150 m and 3 km respectively, the CH4and N2O SPIRALE
profiles have been smoothed using MIPAS averaging kernels. A good agreement is obtained from 180 to 26 hPa. Above 26 hPa for CH4the absolute difference between the two sets
of data is increasing. It can be noticed that the SPIRALE instrument has intercepted a thin PV filament at 14 hPa, in this layer the volume mixing ratios of each species is en-hanced (Huret et al., 2006). This thin layer is not observed by MIPAS because of its coarser vertical resolution and the MIPAS/SPIRALE comparison is not granted in this altitude range. -0.3 -0.2 -0.1 0.0 0.1 0.2 0.3 300 30 300 30 0.0 0.2 0.4 0.6 0.8 1.0 1.2 1.4 1.6 1.8 2.0 Kiruna - 21 Jan. 2003 MIPAS-E v4.6 Spirale Smoothed Spirale CH4 vmr (ppbv) Pre ssure ( h Pa )
Absolute diff. (Mipas - SPIRALE) Combined total errors
Absolute difference (ppbv) Pr es sure ( h Pa ) Figure 6a
Fig. 6a. Comparison of MIPAS CH4v4.61 profile with SPIRALE on 21 January 2003, with SPIRALE minus MIPAS v4.61 differ-ences and combined error bars on the left.
-50 0 50 300 30 300 30 0 50 100 150 200 250 300 350 Kiruna - 21 Jan. 2003 MIPAS-E v4.6 Spirale Smoothed Spirale N2O vmr (ppbv) Pre ss u re (h Pa )
Absolute diff. (Mipas - SPIRALE) Combined total errors
Absolute difference (ppbv) Pre ssure (hPa ) Figure 6b
Fig. 6b. Comparison of MIPAS N2O v4.61 profile with SPIRALE on 21 January 2003, with SPIRALE minus MIPAS v4.61 differ-ences and combined error bars on the left.
Since MIPAS was not operating on 2 October 2002 when SPIRALE was launched for its second flight, the compari-son is only possible with backward trajectories starting from MIPAS measurements on 26, 27 and 28 September and end-ing at the SPIRALE location on 2 October. The SPIRALE flight took place in pre-vortex formation conditions when air mass exchanges between tropics regions and polar re-gions occur. The abundance of long lived species is largely modified by these exchanges leading in particular to non-monotonic profiles. The origin of air masses discussed us-ing N2O-CH4 correlation in Huret et al. (2006) is
depend-ing on altitude. Then before compardepend-ing the MIPAS data to SPIRALE measurements the consistency of dynamical con-ditions using a potential vorticity analysis must be checked. This is performed with the MIMOSA PV contour advection model (Hauchecorne et al., 2002).
420 S. Payan et al.: Validation of MIPAS CH4and N2O CH4_02m_3019_14 1 10 100 1000 0 0,5 1 1,5 2 2,5 CH4 (ppmv) p ressu re ( h P a ) SPIRALE SPIRALE smooth MIPAS-E Figure 7a
Fig. 7a. Comparison of MIPAS CH4v4.61 profile transported to SPIRALE time and geolocation with SPIRALE on 2 October 2002.
Backward trajectories ending at the location of the SPI-RALE profiles (43.6◦N–0◦E) on 2 October 2002 (07:15– 08:30 UT at the ascent and 09:15–10:30 UT at the descent) have been computed as a function of potential temperature with increments of 25 K (∼1 km). Profiles 14 and 15 of or-bit 3019 have been shown to be the best possible profiles to be compared with SPIRALE. These profiles have been mea-sured close to 00:00 UT on 28 September, 4.5 days before SPIRALE. Latitude and longitude of profile 14 are respec-tively 42◦N–335◦E. Latitude and longitude of profile 15 are respectively 46.5◦N–334◦E.
The distance between the points on the trajectories at the time of the MIPAS measurements is varying from 100 km to 2100 km. SPIRALE data may be used to validate MIPAS if a set of trajectories ending close to each point of the SPIRALE profile (+/−0.5◦in latitude, +/−0.5◦in longitude, +/−250 m in altitude) obeys the two following criteria : (a) the PV is conserved on the 4.5 days which separate MIPAS and SPI-RALE measurements and (b) the PV differences between MIPAS and SPIRALE on each isentropic surface is small. From this analysis we conclude that SPIRALE data may be used to validate MIPAS profile 14 of orbit 3019 for MIPAS nominal altitudes 18, 21, 24, 30 and 33 km.
As it can be seen in Fig. 7a and b the SPIRALE instru-ment resolves atmospheric fine structures during ascent (or descent) of the payload and the comparison with the MIPAS values transported by trajectory mapping to the SPIRALE geolocation is within the combined errors bars (mean rela-tive difference of −10%).
4.5 LPMA
The LPMA (Limb Profile Monitor of the Atmosphere) is a re-mote sensing infrared Fourier transform instrument operating in absorption using the sun (Camy-Peyret et al., 1995). Its high spectral resolution and sensitivity allow the retrieval of vertical profiles of trace species having stratospheric mixing ratios as small as 0.1 ppbv. The measurements of three flights
N2O_02m_3019_14 1 10 100 1000 0 100 200 300 400 N2O (ppbv) p ressu re ( h P a ) SPIRALE SPIRALE smooth MIPAS-E Figure 7b
Fig. 7b. Comparison of MIPAS N2O v4.61 profile transported to SPIRALE time and geolocation with SPIRALE on 2 October 2002.
have been used for the validation of MIPAS CH4 and N2O
vertical profiles. As an example of LPMA measurements, during the flight performed on 24 March 2004, the Sun was acquired above a rather elevated cloud deck at about 10 km. The first complete interferograms (after proper setting of the gains of the preamps for each channel) have been obtained just above 10 km. From that point on, the primary pointing system, the heliostat, the interferometer and all the ancillary equipment performed nominally during ascent, float and oc-cultation up to loss of sun, again behind the high cloud cover (∼10 km). The 180 recorded spectra show sufficient absorp-tion by CH4 and N2O for precise retrieval in the
appropri-ate microwindows. The LPMA flight observations started at 14:31 UT (the balloon was at an altitude of 10 km during its ascent), the 33 km float was reached at 16:03 UT and occul-tation measurements (conventionally distinguished from as-cent measurements as pertaining to negative solar elevation angles) have been recorded until loss of Sun at 17:29 UT. The altitude range 12–30 km has been sounded during the flight.
The slant column density (SCD) retrieval of N2O, CH4,
O3, NO2, NO, HNO3, H2O, HCl, CO2 and ClONO2 is
performed simultaneously using a multi-fit of 11 microwin-dows. The target microwindow for N2O and CH4are around
1240.38 to 1243.65 cm−1. In addition CH4 appears as an
interfering absorber in the O3, NO2, HCl and HNO3 target
windows whereas N2O contributes in the HNO3target
win-dow. These contributions need to be included for a reliable SCD retrieval. Based on absorption line parameters from HI-TRAN 2004 (Rothman et al., 2005) and a reasonable a priori guess for the trace gas profiles, a forward model calculates synthetic spectra which are fitted to the measured ones by a non-linear Levenberg-Marquardt algorithm. The calcula-tion of the synthetic spectra relies on atmospheric parameters taken from nearby radiosonde launches and climatological and meteorological model data. Fitting parameters include a polynomial of up to third order, a small additive wavenum-ber shift and several parameters to adjust the instrumental
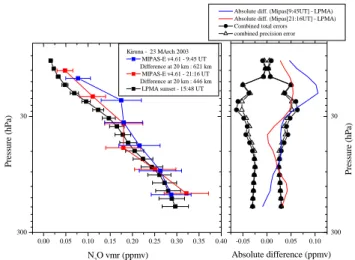
-0.3 0.0 0.3 300 30 300 30 0.3 0.6 0.9 1.2 1.5 1.8 2.1 2.4 Kiruna - 23 MArch 2003 MIPAS-E v4.61 - 9:45 UT Difference at 20 km : 621 km MIPAS-E v4.61 - 21:16 UT Difference at 20 km : 446 km LPMA sunset - 15:48 UT CH4 vmr (ppmv) P ressu re (h P a)
Absolute diff. (Mipas[9:45UT] - LPMA) Absolute diff. (Mipas[21:16UT] - LPMA) Combined total errors combined precision error
Absolute difference (ppmv) Pres sure ( h Pa) Figure 8a
Fig. 8a. Comparison of MIPAS CH4v4.61 profiles with LPMA on 20 March 2003, with LPMA minus MIPAS v4.61 differences and combined error bars.
line shape (ILS). All auxiliary ILS parameters are determined separately in various test runs and finally set to a fixed value for all spectra during a balloon flight.
The error bars comprise the statistical error of the fitting routine (1σ ), the uncertainty in determining the instrumental line shape, the error coming from the ambient atmospheric parameters and their impact on the spectroscopic parameters and the stated error bars of the latter (in total 10% system-atic contribution for both gases). Each spectrum yields an N2O and CH4SCD according to the specifications described
above. Vertical trace gas profiles are then inferred during bal-loon ascent and solar occultation. For more details on LPMA retrieval and data analysis see Payan et al. (1998, 1999) and Dufour et al. (2005).
The vertical mixing ratio profiles of CH4and N2O and the
corresponding errors have been plotted as a function of pres-sure for the MIPAS IPF v4.61 together with the balloon pro-file. An example is given in Fig. 8a and b for flight LPMA20 taking place 20 March 2003 from Kiruna. Analysis of the set of comparisons allow to conclude that apart from the zigzag-ging profiles (lower stratosphere), the MIPAS profiles of CH4
and N2O agree with the LPMA profiles within the combined
error bars.
5 Comparison with simultaneous aircraft measure-ments
Whereas balloon measurements provide trace species pro-files with high vertical resolution in most of the stratosphere, their specific launch constraints and limited geographical coverage make aircraft measurements interesting especially for optimising the coincidence with MIPAS measurements from orbit, but with a limited vertical coverage of the strato-sphere. -0.05 0.00 0.05 0.10 300 30 300 30 0.00 0.05 0.10 0.15 0.20 0.25 0.30 0.35 0.40 Kiruna - 23 MArch 2003 MIPAS-E v4.61 - 9:45 UT Difference at 20 km : 621 km MIPAS-E v4.61 - 21:16 UT Difference at 20 km : 446 km LPMA sunset - 15:48 UT N2O vmr (ppmv) P ressure (hPa)
Absolute diff. (Mipas[9:45UT] - LPMA) Absolute diff. (Mipas[21:16UT] - LPMA) Combined total errors combined precision error
Absolute difference (ppmv) P re ssu re (h P a) Figure 8b
Fig. 8b. Comparison of MIPAS N2O v4.61 profiles with LPMA on 20 March 2003, with LPMA minus MIPAS v4.61 differences and combined error bars.
Three aircraft instruments providing remote sensing mea-surements of N2O and/or CH4 have been used within
ESABC. Two of them, MIPAS-STR and SAFIRE-A, have been operated during different phases of the deployment of the M-55 Geophysica, whereas ASUR performed measure-ments during the SCIAVALUE (Sciamachy Validation and Utilization Experiment) campaign (Fix et al., 2005). 5.1 In situ and remote sensing payload aboard the
Geo-physica
Within the ESABC, three campaigns have been carried out with the M55-Geophysica high altitude aircraft in mid-latitude (Forl`ı, Italy, July and October 2002) and Arctic re-gions (Kiruna, Sweden, March 2003). All the flights have been planned and performed with the goal of a very good coincidence between the geolocations of MIPAS-E profiles and the profiles measured by the Geophysica payload. Pro-files of N2O and/or CH4have been measured by the in situ
instrument HAGAR and the two remote sensing instruments MIPAS-STR and SAFIRE-A.
MIPAS-STR (MIPAS-STRatospheric aircraft, FZK-IMK, Karlsruhe, Germany) is a limb viewing Fourier transform spectrometer, measuring the atmospheric emission in the thermal infrared spectral region (Piesch et al., 1996; Keim et al., 2004). Its characteristics and performance is compa-rable to the satellite version MIPAS-E, but the vertical reso-lution of 2–3 km is only achieved up to the flight altitude of about 20 km. The retrieval of the VMR-profiles is performed on a fixed altitude grid (steps of 0.5 km below 20 km). For the validation purposes, at each satellite geolocation, six col-located MIPAS-STR profiles have been averaged. CH4and
N2O profiles have been determined from the measured
CFC-11 and CFC-12 profiles by use of the correlations measured by HAGAR. This method is preferred to the direct retrieval of
422 S. Payan et al.: Validation of MIPAS CH4and N2O
Figure 9a
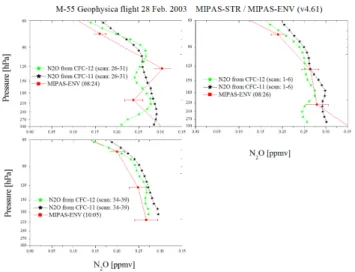
Fig. 9a. MIPAS-E CH4 profiles produced by IPR v4.61 and MIPAS-STR measurements acquired on 28 February 2003 from the M-55.
Figure 9b
Fig. 9b. MIPAS-E CH4 profiles produced by IPR v4.61 and MIPAS-STR measurements acquired on 03 Mach 2003 from the M-55.
CH4/N2O from their signatures around 1300 cm−1, because
the spectral regions of CFC-11 and CFC12 are much less affected by continuum emission mainly due to water. The re-sulting total error of the CH4/N2O profiles is smaller with the
correlation method. There are two dominating error sources in the retrieval chain. First, the error in the used tempera-ture profile is estimated to be 2 K, which results in an error of 5% in CFC-11 and CFC-12. The second error source is connected to the use of HITRAN spectral line data for the radiative transfer calculation in the forward model, and this error is estimated to be below 10%. Effects such as non-LTE, uncertainties in the pointing of the instrument, horizontal at-mospheric inhomogeneity along the line of sight, or the error
Figure 9c
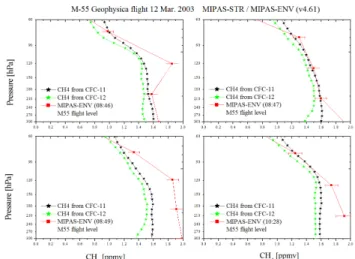
Fig. 9c. MIPAS-E CH4profiles produced by IPR v4.61 and MIPAS-STR measurements acquired on 12 March 2003 from the M-55.
of the used correlation can cause further errors, which were considered of minor importance. As the dominating error sources are independent, they sum up to below 11%. The CH4/N2O profiles derived from the CFC-11 profiles agree
within the errors with the profiles derived from CFC-12, but are significantly larger. We suppose this is due to the spec-troscopic data. The N2O profiles of MIPAS-STR are plotted
in Fig. 9a, b, and c as a function of tangent pressure, together with the coinciding profiles of MIPAS-E. The vertical mix-ing ratio profiles of CH4are plotted in Fig. 10a, b, and c. The
IPF algorithm retrieves the VMR only at given tangent alti-tudes. This makes regularization unnecessary. But omitting regularisation also removes the smoothing of non-physical zigzagging of the independent profile points. This zigzag-ging is observable in more or less all N2O and CH4
pro-files. On 22 July 2002 (not presented in Figs. 9 and 10) there is an unrealistic high VMR at ≈180 hPa in both MIPAS-E N2O profiles. The corresponding CH4 profiles of this day
also have problems. Both IPF versions (v4.55 and v4.61) do indeed present “oscillations” which are not observed in the MIPAS-STR profiles. In contrast to N2O, for which the
pro-files oscillate around the MIPAS-STR values, many of the CH4profiles are completely different from the MIPAS-STR
measurements (e.g. Fig. 9c, 12 March 2003). This kind of problems cannot be explained by the lack of regularization. Apart from the above mentioned obviously wrong profiles (outliers and zigzagging), the MIPAS-E IPR v4.61 profiles of CH4and N2O agree with the profiles of MIPAS-STR within
the combined error bars. 5.2 SAFIRE-A
SAFIRE-A (Spectroscopy of the Atmosphere by using Far-Infrared Emission-Airborne, IFAC-CNR, Firenze, Italy) is also a limb viewing FT spectrometer, but measures the
Figure 10a
Fig. 10a. MIPAS-E N2O profiles produced by IPR v4.61 and MIPAS-STR measurements acquired on 28 February 2003 from the M-55.
far infrared (10–250 cm−1)atmospheric emission in narrow bands (1–2 cm−1). Its characteristics and performance are described by Bianchini et al. (2004).
The geolocation of the SAFIRE-A limb scans and of the corresponding MIPAS tangent points is presented in Fig. 11 for the M-55 flight of 24 October 2002, demonstrating the very good coincidence between aircraft and satellite mea-surements. The N2O mixing ratio values are plotted in
Fig. 12 for MIPAS limb scan 15 and for the SAFIRE-A data at flight altitude. A positive bias in the MIPAS pro-file is clearly evident with respect to the correlative measure-ments. By comparing individual MIPAS N2O VMR values
from scan15 with the average of SAFIRE-A measurements at the same pressure level (±10%) (SAFIRE-A data high-lighted with black circles in Fig. 12), One observes a bias of MIPAS equal to (20±4)% at 90 hPa and equal to (36±8)% at 57 hPa with a total error on the VMR differences of 6% and 4% respectively.
5.3 ASUR aboard the German Falcon
ASUR is a passive heterodyne receiver operating in the fre-quency range of 604.3 to 662.3 GHz (Mees et al., 1995; von Koenig et al., 2000). It is equipped with two spectrome-ters, an Acousto Optical Spectrometer (AOS) and a Chirp Transform Spectrometer (CTS). Stratospheric measurements performed with the AOS are used in this comparison study. The total bandwidth of the AOS is 1.5 GHz and its resolution is 1.27 MHz. In order to avoid absorption by tropospheric water vapour, observations are carried out aboard a research airplane. The instrument looks upward at a stabilized con-stant zenith angle of 78◦. ASUR measures thermal emission around rotational lines of the target molecule. The shape of the pressure broadened line is related to the vertical
distribu-Figure 10b
Fig. 10b. MIPAS-E N2O profiles produced by IPR v4.61 and MIPAS-STR measurements acquired on 3 March 2003 from the M-55.
Figure 10c
Fig. 10c. MIPAS-E N2O profiles produced by IPR v4.61 and MIPAS-STR measurements acquired on 12 March 2003 from the M-55.
tion of the trace gas. Measured spectra are integrated up to 150 s, which leads to a horizontal resolution of about 30 km along the flight path. Vertical profiles of the molecule are retrieved in an equidistant altitude grid of 2 km spacing us-ing the Optimal Estimation Method (Rodgers, 1976). Ver-tical resolution of the N2O measurements is about 8–16 km
and vertical range is from 16 to 45 km. The precision of a single measurement is 10 ppb and the accuracy is 15% or 30 ppb, whichever is higher, including systematic uncertain-ties. Details about the measurement technique and retrieval theory can be found in Bremer et al. (2002) and in Kuttippu-rath (2005).
424 S. Payan et al.: Validation of MIPAS CH4and N2O
Figure 11
Fig. 11. M-55 Geophysica mid-latitude flight of 24 October 2002: MIPAS N2O comparison with SAFIRE-A.
Table 2. ASUR N2O measurements performed during the SCIAVALUE campaign.
No flight date flight path measurement range: latitude and longitude
1 04/09/2002 Kiruna – Longyearbyen – Kiruna 76.48◦N, 16.41◦E to 70.26◦N, 19.79◦E
2 17/09/2002 Palma de Mallorca – Yaounde 35.32◦N, 4.68◦E to 12.44◦N, 7.08◦E
3 18/09/2002 Yaounde – Nairobi 2.56◦N, 16.79◦E to 0.34◦S, 33.66◦E
4 19/09/2002 Nairobi – Seychelles 3.43◦S, 39.11◦E to 4.33◦S, 52.69◦E
5 25/09/2002 Nairobi – Yaounde 0.23◦S, 33.33◦E to 3.13◦N, 14.25◦E
6 26/09/2002 Yaounde – Palma de Mallorca 7.50◦N, 10.13◦E to 35.28◦N, 8.32◦E
7 19/02/2003 Munich – Basel – Tozeur 47.24◦N, 10.04◦E to 38.28◦N, 8.91◦E
8 24/02/2003 Nairobi – Mombasa – Seychelles 4.06◦S, 43.91◦E to 4.07◦S, 44.29◦E
9 26/02/2003 Seychelles – Nairobi 3.79◦S, 51.96◦E to 1.65◦S, 39.03◦E
10 28/02/2003 Nairobi – Douala 0.24◦S, 33.39◦E to 3.07◦N, 14.54◦E
11 10/03/2003 Munich – Kiruna 50.27◦N, 10.15◦E to 62.35◦N, 15.27◦E
12 12/03/2003 Kiruna – Ny-Aalesund – Kiruna 69.53◦N, 22.33◦E to 71.56◦N, 17.03◦E
13 13/03/2003 Kiruna – Keflavik 67.80◦N, 14.78◦E to 64.46◦N, 17.34◦W
14 14/03/2003 Keflavik – Kangerlussuaq 66.61◦N, 22.71◦W to 66.95◦N, 50.07◦W
The ASUR N2O measurements performed during the
SCI-AVALUE (Sciamachy Validation and Utilization Experi-ment) campaign (Fix et al., 2005) are used here. Data from 14 selected ASUR measurement flights during the campaign are analyzed. Details about the flights are given in Ta-ble 2. A criterion that the ASUR measurements are within +/−1000 km and in +/−12 h around the satellite observa-tions is chosen for the comparison between datasets. This criterion resulted in 323 coincident measurements (from 14 flights) with the IPF data. The MIPAS volume mixing ratios
are convolved with the ASUR N2O averaging kernels to
ac-count for the lower vertical resolution of the ASUR profiles. The difference 1VMR=ASUR-MIPAS is calculated from the individual ASUR and MIPAS profiles. These delta pro-files are averaged over the tropics (5◦S–30◦N), mid-latitudes (30◦N–60◦N), and high latitudes (60◦N–90◦N). Results are presented for these latitude bands separately.
Figure 13 shows the results from the comparison between ASUR and IPF v4.61 profiles. There are 101 coincident measurements in the tropics, 38 in mid-latitudes and 184 in
Figure 12
Fig. 12. Comparison of ENVISAT orbit 3403, MIPAS scan 15 N2O VMR measurements with SAFIRE-A for 24 October 2002.
high-latitudes. The differences range from −18 to 48 ppb in the tropics, 2 to 31 ppb in the mid-latitudes and −10 to 13 ppb in the high latitudes. The deviation is largest at 24–28 km altitude for all latitude bands, in which the trop-ical profile shows the highest deviation of about 48 ppb. It is found that the MIPAS profiles underestimate the ASUR VMRs in the altitude range 25–30 km and overestimate the ASUR values above 34 km. However, agreement between the profiles appears to be very good at mid and high latitudes above 30 km altitude.
In comparison with the MIPAS datasets in the tropics and mid-latitudes, there seems to be a systematic difference. Temporary atmospheric variations and the reduced altitude resolution of ASUR can hardly explain these systematic de-viations. Note that the N2O values in the tropical lower
stratosphere retrieved from ASUR measurements seem rel-atively high. Comparisons with Odin/SMR have also shown this particular feature of ASUR N2O retrievals (Urban et al.,
2005). However, for mid and high latitudes and for the lower values of N2O, agreement between ASUR and MIPAS
pro-files is very good. This was also true for comparison between ASUR and SMR profiles (Urban et al., 2005). The differ-ences in these latitude and altitude regions are well within the ASUR error bars.
6 Comparison with ground-based measurements
6.1 FTIR products
Within the framework of NDACC (Network for the Detec-tion of Atmospheric ComposiDetec-tion Change, former NDSC or Network for the Detection of Stratospheric Change), FTIR spectrometers are operated at various stations worldwide on a regular basis. These instruments record solar absorption
Figure 13
Fig. 13. Comparison of MIPAS N2O v4.61 profile with ASUR. The differences (1 VMR=ASUR VMR - MIPAS VMR) are
aver-aged over the tropics (5◦S–30◦N), mid-latitudes (30◦N–60◦N),
and high latitudes (60◦N–90◦N). Shaded area is the standard
devi-ation of the profiles averaged.
spectra from which one can retrieve the abundances of a large number of atmospheric constituents. In this work, we will present results from data recorded at Ny-Alesund (78.9◦N, 11.9◦E, 20 m a.s.l.), Kiruna (67.8◦N, 20.4◦E, 420 m a.s.l.), Jungfraujoch (46.5◦N, 8.0◦E, 3580 m a.s.l.), Wollongong (34.4◦S, 150.9◦E, 30 m a.s.l.), Lauder (45.0◦S, 169.7◦E, 370 m a.s.l.), and Arrival Heights (77.8◦S, 166.7◦E, 200 m a.s.l.). In addition to total columns, low vertical res-olution profiles are retrieved from the spectra by using the Optimal Estimation Method of Rodgers (2000) in the inver-sion programs. For the Kiruna data, the inverinver-sion code used is PROFFIT (PROFile FIT) (Hase, 2000, 2004), based on the forward model KOPRA (Karlsruhe Optimized Precise Ra-diative transfer Algorithm) (H¨opfner et al., 1998). For all other stations, the retrievals have been performed using the SFIT2 algorithm (Pougatchev et al., 1995a, b; Rinsland et al., 1998). The PROFFIT and SFIT2 codes have been cross-validated successfully by Hase et al., 2004. In all cases, the synthetic spectra were calculated using daily pressure and temperature data of the National Centers for Environ-mental Prediction (NCEP). All retrieval parameters (spectral microwindows, spectroscopic parameters, instrumental line shape, a priori information, and model parameters) have been optimized independently for each station. For the N2O
re-trievals, all stations used the spectroscopic line parameters from the HITRAN 2000 database including official updates through 2001 (Rothman et al., 2003). For the CH4retrievals,
the Northern Hemisphere stations used the HITRAN 2000 database, while the Southern Hemisphere stations used the HITRAN 2004 database (Rothman et al., 2005).
Following the Optimal Estimation Method of Rodgers (2000), the FTIR retrieved state vector xr is related to the true state vector x by:
426 S. Payan et al.: Validation of MIPAS CH4and N2O
with xathe a priori state vector and A the averaging kernel matrix. The FTIR products are low vertical resolution files. The vertical information content of the retrieved pro-file can be quantified by the number of degrees for signal (DOFS), which is the trace of the A matrix. The DOFS are about 3 for CH4 at all stations except Ny-Alesund (4) and
about 3.6 for N2O at all the stations except Ny-Alesund and
Jungfraujoch (4.5). Thus for the comparisons with MIPAS, it is more relevant to consider a limited number of partial columns containing independent information. The lower al-titude limit for the partial column comparisons is determined by the MIPAS measurements and is about 12 km. The upper altitude limit for the comparisons is chosen taking into ac-count the ground-based FTIR sensitivity which is reasonable up to around 30 km for both molecules at all stations. The DOFS within these partial columns limits are about 1.4 for CH4 at all stations except at Kiruna (1.0) and Ny-Alesund
(2.0), and about 1.7 for N2O for the three Southern
Hemi-sphere stations and 1.3, 2.3 and 2.7 for Kiruna, Ny-Alesund and Jungfraujoch, respectively .
6.2 Comparison methodology
In this work, the ground-based FTIR data are used to vali-date MIPAS ESA data v4.61 for the period when the instru-ment was operating at its full spectral resolution (i.e., from 6 July 2002 to 26 March 2004). The selected coincidence criteria were temporal and spatial distances of, respectively,
±3 h and ±300 km maximum at the MIPAS nominal tan-gent height of 21 km. For Wollongong, the number of co-incidences found using these criteria is very small, so the results of comparisons using relaxed coincidence criteria of
±4 h and ±400 km distance have been included.
When the spatial variability of the target gas is high, such as in winter-spring at high latitude stations, the standard devi-ations of the comparisons would become large and would not represent the agreement between both measurements. This is due to 1) the collocation error of the air masses, and 2) the horizontal smoothing error which corresponds to the gra-dient of the target gas within the instruments’ line of sight (Cortesi et al., 2006, Sect. 4; von Clarmann et al., 2006). For the Kiruna data an additional PV criterion of 15% differ-ence has been applied to reduce the collocation error. But, as this does not necessarily reduce the smoothing error, we de-cided to show also comparisons for limited time periods for which the spatial variability is smaller (summer-autumn for high latitude stations).
To avoid a possible geometric altitude error in the MIPAS data, the comparisons between MIPAS and FTIR measure-ments are made on a pressure grid. Each MIPAS profile xm is degraded to the lower vertical resolution of the ground-based FTIR profile following Rodgers and Connor (2003):
xs =xa+A(xm−xa), (2)
with xa and A the FTIR a priori profile and averaging ker-nel matrix, respectively, and xsthe smoothed MIPAS profile that is then used in the comparisons of profiles and partial columns.
The statistics of the profile and partial column compar-isons are given (in percentages) in the tables and figures of the next sections. The relative differences between MIPAS and FTIR products are calculated by taking the mean ab-solute difference between MIPAS and FTIR data (MIPAS-FTIR), divided by the mean FTIR value. The means (M) of the statistical comparisons (i.e., the biases) are compared to the 3σ standard errors on the means (SEM) to discuss their statistical significance. The SEMs are calculated as 3×STD/
√
N, N being the number of coincidences, and STD the standard deviation of the differences. The precision of the instruments will also be discussed by comparing the standard deviations (STD) of the differences with the random error on the difference MIPAS-FTIR.
The random error covariance matrix Sdiffof the difference
of the profiles MIPAS-FTIR has been evaluated, using the work of Rodgers and Connor (2003) for the comparison of remote sounding instruments and of Calisesi et al. (2005) for the re-gridding between the MIPAS and FTIR data, as done in Vigouroux et al. (2007):
Sdiff=SFTIR+AW SMIPASWTAT, (3)
where SFTIR and SMIPAS are the FTIR and MIPAS
ran-dom error covariance matrices, respectively, and W a grid transformation matrix (see Calisesi et al., 2005, for details). The FTIR random error budget has been estimated for a typ-ical measurement at Kiruna (F. Hase, pesonal communica-tion, 2007). The dominant error sources are the measure-ment noise, the spectral baseline error, and the temperature profile uncertainties. The smoothing error associated to the low vertical resolution of the FTIR profiles becomes negli-gible in the profiles comparisons since the smoothing proce-dure (Eq. 1) is applied to the MIPAS profiles (Rodgers and Connor, 2003).
6.3 CH4comparisons
Table 3 gives for every station, the height region of the partial columns (in pressure units), the mean (M) and the standard deviation (STD) of the partial column relative differences, along with the number N of coincident pairs, the estimated random error on the partial column differences and the 3σ standard error on the mean (SEM).
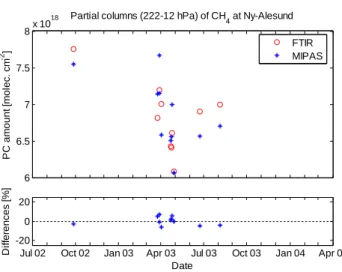
It can be seen from Table 3 that there is a statistically significant positive bias in the relative differences of par-tial columns for all the stations except Ny-Alesund and Ar-rival Heights. Due to the high standard deviation at ArAr-rival Heights during the whole period of comparison, the bias is not significant. If the comparisons are limited to the summer-autumn period, the bias at Arrival Heights appears to be also significant.
Table 3. Statistical means (M) and standard deviations (STD) of the relative differences (MIPAS-FTIR)/mean (FTIR) [%] of the CH4partial columns defined in the given pressure ranges. The number of coincidences (N) within ±3 h and ±300 km, the combined random error, and the 3σ standard error on the bias (SEM) are also given. For Wollongong the coincidence criteria is ±4 h and ±400 km distance.
Station Period Pressure
range [hPa] M ± STD [%] Random error [%] N SEM [%]
Ny-Alesund 79◦N Jul 2002–Mar 2004
Jul–Oct 2003 12–222 +0.1±4.4 −3.8±0.9 4.4 3.1 11 3 4.0 1.6
Kiruna 68◦N Jul 2002–Mar 2004
Jul–Oct 2003 2–168 +7.7±6.6 +6.5±6.2 3.8 3.8 21 14 4.3 5.0
Jungfraujoch 47◦N Jul 2002–Mar 2004 6–224 +14.3±4.6 3.6 12 4.0
Wollongong 34◦S Jul 2002–Mar 2004
Jul 2002–Mar 2004 9–201 +14.9±5.6 +11.3±7.5 3.7 5 16 7.5 5.6
Lauder 45◦S Jul 2002–Mar 2004 12–199 +10.2±4.7 3.4 15 3.6
Arrival Heights 78◦S Jul 2002–Mar 2004
Jan–Mar 2003 13–181 +5.1±15.0 +5.1±4.1 3.8 3.2 26 9 8.8 4.1 6 6.5 7 7.5 8x 10 18 P C am ount [ m ol ec . c m -2 ]
Partial columns (222-12 hPa) of CH4 at Ny-Alesund
Jul 02 Oct 02 Jan 03 Apr 03 Jul 03 Oct 03 Jan 04 Apr 04 -20 0 20 D if fer enc es [ % ] Date FTIR MIPAS Figure 14a
Fig. 14a. Time series of CH4partial column comparisons. Upper
panel: ground-based FTIR (circles) and MIPAS v4.61 (stars) CH4
partial columns for collocated measurements at Ny-Alesund. Lower panel: relative differences between ground-based FTIR and MIPAS partial columns.
Figure 14a to f present plots of the time series of partial columns of CH4 at the six ground-based stations, together
with the time series of the relative differences (MIPAS-FTIR)/mean (FTIR). It can be seen from these figures that the biases do not show a seasonal dependence.
Table 3 also shows that the statistical standard deviation (i.e. the dispersion) is usually slightly larger than the esti-mated random error which is probably due to collocation and horizontal smoothing errors. It is clear from Fig. 14a to f that the standard deviations are higher during winter-spring peri-ods for the high latitude stations, which is confirmed by the statistics in Table 3 for reduced time periods.
3 3.5 4 4.5 5 5.5 6 x 10¹⁸ P C am ount [ m ol ec . c m -2 ]
Partial columns (168-2 hPa) of CH 4 at Kiruna
Jul 02 Oct 02 Jan 03 Apr 03 Jul 03 Oct 03 Jan 04 Apr 04 -20 0 20 D if fer enc es [ % ] Date Figure 14b
Fig. 14b. Time series of CH4 partial column comparisons. Up-per panel: ground-based FTIR (circles) and MIPAS v4.61 (stars)
CH4partial columns for collocated measurements at Kiruna. Lower
panel: relative differences between ground-based FTIR and MIPAS partial columns.
The CH4difference profiles shown in Fig. 15a to f confirm
what has been seen for the partial columns comparisons: a significant positive bias is observed at Jungfraujoch, Kiruna, Lauder and Arrival Heights in the lower stratosphere. At Wollongong, the bias is maximum in the middle stratosphere. At Ny-Alesund, no bias was seen in the partial columns. We can see, however, in Fig. 15a to f that a positive bias exists in the lower stratosphere but is compensated by a negative bias in the middle and upper stratosphere. These unrealistic oscillations in the difference of profiles are due to the FTIR products at Ny-Alesund. The constraints on the a priori in-formation (Rodgers, 2000) are probably too small, leading
428 S. Payan et al.: Validation of MIPAS CH4and N2O 6 6.5 7 7.5 8 8.5 9x 10 18 P C am ount [ m ol ec . c m -2 ]
Partial columns (224-6 hPa) of CH4 at Jungfraujoch
Jul 02 Oct 02 Jan 03 Apr 03 Jul 03 Oct 03 Jan 04 Apr 04 -20 0 20 D if fer enc es [ % ] Date Figure 14c
Fig. 14c. Time series of CH4partial column comparisons. Up-per panel: ground-based FTIR (circles) and MIPAS v4.61 (stars)
CH4partial columns for collocated measurements at Jungfraujoch.
Lower panel: relative differences between ground-based FTIR and MIPAS partial columns.
5.5 6 6.5 7 7.5 8x 10 18 P C am ount [ c m -2 ]
Partial Columns (201-9 hPa) of CH4 at Wollongong FTIR
MIPAS (± 300 km; ± 3h) MIPAS (± 400 km; ± 4h)
Jul 02 Oct 02 Jan 03 Apr 03 Jul 03 Oct 03 Jan 04 Apr 04 -20 0 20 D iffe re n c e s [% ] Date Figure 14d
Fig. 14d. Time series of CH4partial column comparisons. Upper
panel: ground-based FTIR (circles) and MIPAS v4.61 (stars) CH4
partial columns for collocated measurements at Wollongong. Lower panel: relative differences between ground-based FTIR and MIPAS partial columns.
to oscillations in the profiles. This would also explain the larger degrees of freedom for signal at Ny-Alesund, given in Sect. 6.1.
6.4 N2O comparisons
The FTIR datasets used here are the same ones as used al-ready by Vigouroux et al. (2007) for the validation of MIPAS N2O v4.61 products, for all the stations except Ny-Alesund.
But the coincidence criteria were less strict, which was com-pensated by the use of the data assimilation system
BAS-5 5.5 6 6.5 7 7.5 8x 10 18 P C am ount [ m ol ec . c m -2]
Partial columns (199-12 hPa) of CH4 at Lauder
Jan 03 Apr 03 Jul 03 Oct 03 Jan 04
-20 0 20 D iffe re n c e s [% ] Date Figure 14e
Fig. 14e. Time series of CH4 partial column comparisons. Up-per panel: ground-based FTIR (circles) and MIPAS v4.61 (stars)
CH4partial columns for collocated measurements at Lauder. Lower
panel: relative differences between ground-based FTIR and MIPAS partial columns. 3 4 5 6 7 8x 10 18 P C am ount [ m ol ec . c m -2]
Partial columns (181-13 hPa) of CH4 at Arrival Heights
Jan 03 Apr 03 Jul 03 Oct 03 Jan 04 -20 0 20 40 60 D iffe re n c e s [% ] Date Figure 14f
Fig. 14f. Time series of CH4partial column comparisons. Upper
panel: ground-based FTIR (circles) and MIPAS v4.61 (stars) CH4
partial columns for collocated measurements at Arrival Heights. Lower panel: relative differences between ground-based FTIR and MIPAS partial columns.
COE. Results obtained with the same criteria as adopted else-where in the present paper (±3 h; ±300 km) have been used. Considering the means and their statistical 3σ standard er-rors (SEM) given in Table 4, there is no statistically signifi-cant bias in the relative differences of partial columns for the Kiruna, Jungfraujoch, Wollongong, and Lauder stations. A statistically significant negative bias is seen for the highest latitude stations: Ny-Alesund (−10.1%) and Arrival Heights (−8.5%). For Arrival Heights, we can see in Fig. 16a to f and Table 4 that the bias is more pronounced during the
Table 4. Statistical means (M) and standard deviations (STD) of the relative differences (MIPAS-FTIR)/mean (FTIR) [%] of the N2O partial columns defined in the given pressure ranges. The number of coincidences (N) within ±3 h and ±300 km, the combined random error, and the 3σ standard error on the bias (SEM) are also given. For Wollongong the coincidence criteria is ±4 h and ±400 km distance.
Station Period Pressure
range [hPa] M ± STD [%] Random error [%] N SEM [%]
Ny-Alesund 79◦N Jul 2002–Mar 2004
Jul–Oct 2003 9–222 −10.1±5.5 −10.1±2.0 5.9 4.8 9 3 5.5 3.5
Kiruna 68◦N Jul 2002–Mar 2004
Jul–Oct 2003 2–168 −2.3±4.0 −1.6±2.5 5.3 5.3 21 14 2.6 2.0
Jungfraujoch 47◦N Jul 2002–Mar 2004 2–224 +1.3±2.8 5.0 12 2.4
Wollongong 34◦S Jul 2002–Mar 2004
Jul 2002–Mar 2004 12–196 +8.8±8.7 +4.3±6.8 5.1 5 18 11.7 5.1
Lauder 45◦S Jul 2002–Mar 2004 12–199 +3.1±4.8 4.9 15 3.7
Arrival Heights 78◦S Jul 2002–Mar 2004
Jan–Mar 2003 17–181 −8.5±9.1 −4.3±5.0 6.0 5.1 20 8 6.1 5.3 -30 -20 -10 0 10 20 30 100 101 102 [%] Pr e s s u re [ h Pa ] CH 4 at Ny-Alesund
<MIPAS - FTIR> ± STD / <FTIR> Standard error on the mean (3σ) Combined Random Error
Figure 15a
Fig. 15a. Statistical means and standard deviations of the relative
differences mean(MIPAS-FTIR)/mean(FTIR) [%] of the CH4
pro-files measured at NY-Alesund. The shaded areas correspond to the estimated random error on the relative differences. The two black horizontal bars show the pressure ranges used for the partial column comparisons of Table 3.
local spring period, and that it is no longer significant when the comparisons are limited to summer-autumn. For Ny-Alesund, the number of coincidences (3) in the limited time period is too small to draw any significant conclusions.
From Table 4, it can be seen that the statistical standard deviations are within the estimated random error for Ny-Alesund, Jungfraujoch, Lauder and Kiruna. For Wollongong, we see in Fig. 16a to f that the larger standard deviation for the statistics (with coincidence criteria of ±3 h; ±300 km) is due to one single coincidence only, on the 1st of March 2003. Thus, results for Wollongong are better using the relaxed
cri--30 -20 -10 0 10 20 30 100 101 102 [%] Pr e s s u re [ h Pa ] CH 4 at Kiruna (July-October) Figure 15b
Fig. 15b. Statistical means and standard deviations of the relative
differences mean(MIPAS-FTIR)/mean(FTIR) [%] of the CH4
pro-files measured at Kiruna. The shaded areas correspond to the esti-mated random error on the relative differences. The two black hor-izontal bars show the pressure ranges used for the partial column comparisons of Table 3.
teria of ±4 h, ±400 km. For Arrival Heights, considering the whole period, the statistical standard deviation is also larger than the estimated random error, but this is no longer the case in the reduced time period. Indeed, we see in Fig. 16a to f that the dispersion is larger during local spring for the three highest latitude stations.
430 S. Payan et al.: Validation of MIPAS CH4and N2O -30 -20 -10 0 10 20 30 100 101 102 [%] Pr e s s u re [ h Pa ] CH 4 at Jungfraujoch Figure 15c
Fig. 15c. Statistical means and standard deviations of the relative
differences mean(MIPAS-FTIR)/mean(FTIR) [%] of the CH4
pro-files measured at Jungfraujoch. The shaded areas correspond to the estimated random error on the relative differences. The two black horizontal bars show the pressure ranges used for the partial column comparisons of Table 3. -30 -20 -10 0 10 20 30 100 101 102 [%] Pr e s s u re [ h Pa ] CH 4 at Wollongong Figure 15d
Fig. 15d. Statistical means and standard deviations of the relative
differences mean(MIPAS-FTIR)/mean(FTIR) [%] of the CH4
pro-files measured at Wollongong. The shaded areas correspond to the estimated random error on the relative differences. The two black horizontal bars show the pressure ranges used for the partial col-umn comparisons of Table 3. The statistics shown is for the ±4 h and ±400 km coincidence criteria.
-30 -20 -10 0 10 20 30 100 101 102 [%] Pr e s s u re [ h Pa ] CH 4at Lauder Figure 15e
Fig. 15e. Statistical means and standard deviations of the
rela-tive differences mean(MIPAS-FTIR)/mean(FTIR) [%] of the CH4
profiles measured at Lauder. The shaded areas correspond to the estimated random error on the relative differences. The two black horizontal bars show the pressure ranges used for the partial column comparisons of Table 3. -30 -20 -10 0 10 20 30 100 101 102 [%] Pr e s s u re [ h Pa ] CH
4 at Arrival Heights (January-March)
Figure 15f
Fig. 15f. Statistical means and standard deviations of the relative
differences mean(MIPAS-FTIR)/mean(FTIR) [%] of the CH4
pro-files measured at Arrival Heights. The shaded areas correspond to the estimated random error on the relative differences. The two black horizontal bars show the pressure ranges used for the partial column comparisons of Table 3.
0.9 1 1.1 1.2 1.3x 10 18 P C am ount [ m ol ec. c m -2 ]
Partial columns (222-9 hPa) of N
2O at Ny-Alesund
Jul 02 Oct 02 Jan 03 Apr 03 Jul 03 Oct 03 Jan 04 Apr 04 -20 0 20 D iffe re n c e s [% ] Date FTIR MIPAS Figure 16a
Fig. 16a. Time series of N2O partial columns comparisons. Upper
panel: ground-based FTIR (circles) and MIPAS v4.61 (stars) N2O
partial columns for collocated measurements at Ny-Alesund. Lower panel: relative differences between ground-based FTIR and MIPAS partial columns. 4 5 6 7 8 9 10x 10 17 P C am ount [ m ol ec . c m -2 ]
Partial columns (168-2 hPa) of N2O at Kiruna
Jul 02 Oct 02 Jan 03 Apr 03 Jul 03 Oct 03 Jan 04 Apr 04 -20 0 20 D iffe re n c e s [% ] Date Figure 16b
Fig. 16b. Time series of N2O partial columns comparisons. Up-per panel: ground-based FTIR (circles) and MIPAS v4.61 (stars)
N2O partial columns for collocated measurements at Kiruna. Lower
panel: relative differences between ground-based FTIR and MIPAS partial columns.
Figure 17a to f confirm that, except at Ny-Alesund and to a smaller extent at Lauder, there is no statistically significant bias in N2O comparisons in the lower stratosphere where the
N2O concentration is the highest. At higher altitude, a high
positive bias is seen at Wollongong, and a small negative one at Kiruna.
6.5 Summary for ground based measurements
The CH4comparisons show a statistically significant positive
bias of 5 to 11% between MIPAS and FTIR lower-middle
1.05 1.1 1.15 1.2 1.25 1.3 1.35x 10 18 PC am oun t [mo lec . c m 2 ]
Partial columns (224-2 hPa) of N
2O at Jungfraujoch
Jul 02 Oct 02 Jan 03 Apr 03 Jul 03 Oct 03 Jan 04 Apr 04
-20 0 20 D iffe re n c e s [% ] Date Figure 16c
Fig. 16c. Time series of N2O partial columns comparisons. Up-per panel: ground-based FTIR (circles) and MIPAS v4.61 (stars)
N2O partial columns for collocated measurements at
Junhgfrau-joch. Lower panel: relative differences between ground-based FTIR and MIPAS partial columns.
0.95 1 1.05 1.1 1.15 1.2 1.25 1.3x 10 18 PC am oun t [cm 2 ]
Partial Columns (196-12 hPa) of N
2O at Wollongong
FTIR
MIPAS (± 300 km; ± 3h) MIPAS (± 400 km; ± 4h)
Jul 02 Oct 02 Jan 03 Apr 03 Jul 03 Oct 03 Jan 04 Apr 04
-20 0 20 D iffe re n c e s [% ] Date Figure 16d
Fig. 16d. Time series of N2O partial columns comparisons. Upper
panel: ground-based FTIR (circles) and MIPAS v4.61 (stars) N2O
partial columns for collocated measurements at Wollongong. Lower panel: relative differences between ground-based FTIR and MIPAS partial columns.
stratosphere partial columns, and a standard deviation of 4 to 7.5%, when the high variability period (winter-spring) for high latitude stations is not taken into account.
For N2O comparisons, no statistically significant bias is
seen between MIPAS and FTIR lower-middle stratosphere partial columns, and the standard deviation is between 2.5 and 6.8%, when the high variability period (winter–spring) for high latitude stations is not taken into account.
432 S. Payan et al.: Validation of MIPAS CH4and N2O 0.85 0.9 0.95 1 1.05 1.1 1.15 1.2x 10 18 PC am oun t [mo lec. c m 2]
Partial columns (199-12 hPa) of N2O at Lauder
Jan 03 Apr 03 Jul 03 Oct 03 Jan 04
-20 0 20 D iffe re n c e s [% ] Date Figure 16e
Fig. 16e. Time series of N2O partial columns comparisons. Up-per panel: ground-based FTIR (circles) and MIPAS v4.61 (stars)
N2O partial columns for collocated measurements at Lauder. Lower
panel: relative differences between ground-based FTIR and MIPAS partial columns. 4 5 6 7 8 9 10x 10 17 P C am ount [ m ol ec. c m -2 ]
Partial columns (181-17 hPa) of N
2O at Arrival Heights
Jan 03 Apr 03 Jul 03 Oct 03 Jan 04 -20 0 20 D iffe re n c e s [% ] Date Figure 16f
Fig. 16f. Time series of N2O partial columns comparisons. Upper
panel: ground-based FTIR (circles) and MIPAS v4.61 (stars) N2O
partial columns for collocated measurements at Arrival Heights. Lower panel: relative differences between ground-based FTIR and MIPAS partial columns.
When the winter-spring period is included in the compar-isons for the high latitude stations, Standard deviations of 9 and 15% can be reached, for N2O and CH4 respectively,
probably due to collocation and horizontal smoothing errors.
7 Intercomparison of simultaneous MIPAS and HALOE measurements
Satellite-satellite intercomparisons are another method to as-sess the quality of a new space instrument, considered to be
-50 -40 -30 -20 -10 0 10 20 30 40 50 100 101 102 [%] P re s s u re [h P a ] N 2O at Ny-Alesund
<MIPAS - FTIR> ± STD / <FTIR> Standard error on the mean (3σ) Combined Random Error
Figure 17a
Fig. 17a. Statistical means and standard deviations of the
rela-tive differences mean(MIPAS-FTIR)/mean(FTIR) [%] of the N2O
profiles measured at Ny-Alesund. The shaded areas correspond to the estimated random error on the relative differences. The two black horizontal bars show the pressure ranges used for the partial columns of Table 4. -50 -40 -30 -20 -10 0 10 20 30 40 50 100 101 102 [%] Pr e s s u re [ h Pa ] N 2O at Kiruna (July-October) Figure 17b
Fig. 17b. Statistical means and standard deviations of the relative
differences mean(MIPAS-FTIR)/mean(FTIR) [%] of the N2O
pro-files measured at Kiruna. The shaded areas correspond to the esti-mated random error on the relative differences. The two black hor-izontal bars show the pressure ranges used for the partial columns of Table 4.
already validated by independent measurements, to be stable, and to be producing reliable profiles. Several papers cover in detail the comparison between MIPAS and ACE measure-ments of CH4 (De Mazi`ere et al., 2007), between MIPAS


![Fig. 15b. Statistical means and standard deviations of the relative differences mean(MIPAS-FTIR)/mean(FTIR) [%] of the CH 4 pro-files measured at Kiruna](https://thumb-eu.123doks.com/thumbv2/123doknet/5596656.134564/17.892.467.816.440.726/statistical-standard-deviations-relative-differences-mipas-measured-kiruna.webp)
