Multi-Market Trading and Market Quality
♣Carole Gresse♦
January 2010 Preliminary draft
JEL classification: G14, G15, G18
Keywords: Fragmentation, Liquidity, Multilateral Trading Facility (MTF), Price quality, OTC trading, Systematic internalizer (SI)
♣ I address special thanks to IFS and their managing directors, Sabine and Darren Toulson, for generously providing the data used in this study. I am particularly grateful to Mark Holloway and Oliver Speakman of IFS for their technical work on the data. I also wish to thank Romain Devai, Simon Brickles, Luca Filippa, Alasdair Haynes, Terry Hendershott, Maureen O’Hara, and Peter Randall, for their help, assistance, or comments.
♦ Université Paris-Dauphine, Pôle Universitaire Léonard de Vinci, 92916 Paris La Défense cedex, France. E-mail : [email protected].
Multi-Market Trading and Market Quality
Abstract
This empirical study based on data from several exchanges and trading platforms for a sample of 153 European blue chip stocks over a post-MiFID three-month period shows that the way liquidity correlates with fragmentation is diverse and depends on the market, the type of liquidity metrics, and the type of fragmentation that is considered. All in all, fragmentation seems to be more beneficial to global traders trading in several market places than to local traders trading on the primary exchange only, which confirms the crucial role of order routing systems in fragmented markets. Further, fragmentation adversely affects price quality by increasing short-term volatility. That adverse effect is assignable to market-traded order flow fragmentation but not to internalization.
1 1. Introduction
With the development of sophisticated trading technologies and the enforcement of pro-competition market regulations, order flow fragmentation has undeniably increased in all large western stock markets. Whether this has improved or harmed execution and price quality is thus a very topical issue for regulators, issuers, and asset managers. The present article provides empirical evidence on this matter by drawing on a comprehensive dataset that combines high frequency data from several exchanges and alternative trading and reporting platforms for a large sample of European blue chip stocks.
In theory, security markets are natural monopolies because of the so-called virtuous circle of liquidity. Traders choose the market with the best liquidity, and the most liquid market is the one with most participants because it offers the highest probability of order execution and the most competitive prices. As a result, the market with the greatest numbers of traders attract all other traders, so that the order flow should inevitably consolidate in a single market. Nevertheless, equity trading is anything but consolidated in practice. More than fifty trading venues are now available to investors in the US.
In Europe, market fragmentation is a more recent phenomenon, mainly because national regulations have long protected the business of traditional exchanges with the so-called concentration rules.1 The enforcement of the Markets in Financial Instruments Directive (MiFID)2 on 1 November 2007 abolished the concentration rule in the countries of the European Economic Area (EEA), and has created a competitive environment for trading systems and services, in which new trading systems allowed by technological innovation may be widely exploited. The MiFID recognizes three types of order execution venues: Regulated
1 A provision in the 1993 Investment Services Directive (ISD) permitted (but did not mandate) individual member states to require orders from investors in that member state to be executed only on regulated markets. This provision was applied in France, Italy, and Spain.
2 This European Union law provides a comprehensive and harmonized regulatory regime for investment services and activities across the 30 member states of the European Economic Area (EEA), i.e. the 27 member states of the European Union (EU) plus Norway, Iceland, and Liechtenstein.
2 Markets (RMs), Multilateral Trading Facilities (MTFs), and Systematic Internalizers” (SIs). RMs and MTFs are multilateral trading systems with similar functionalities but they differ in that RMs have to be authorized by a competent authority. Both RMs and MTFs may organize primary listings, but securities primary listed on MTFs are not considered as regulated instruments. SIs are investment firms which, “on an organized, frequent and systematic basis,” execute client orders outside a regulated market or an MTF, either on their principal accounts or against other clients’ orders. Legally, a SI does not have to be designated by a regulated market, and an institution can be a SI for securities listed on different stock exchanges. Creating the legal status of SIs institutionalizes internalization. In counterpart, the MiFID treats SIs as mini-exchanges and imposes pre-trade and post-trade transparency requirements on them.
The MiFID has served as a catalyst for the soaring of competition between marketplaces, and the number of trading venues at the disposal of investors have substantially increased for European equities. In the U.S., competition between trading platforms is fierce. Indeed, on both sides of the Atlantic, traders now have a wider set of trading opportunities, and new entrants to markets as well as established alternative trading systems have gained market share by introducing innovative approaches to trade. In this context, the potential consequences of order flow fragmentation for the quality of trading is an extremely topical issue for exchanges, regulators, institutional investors, or market intermediaries. The present study aims to provide empirical evidence on this matter by using high frequency data from eight European exchanges, the Chi-X MTF, and the BOAT trade report system. First, it sets out to assess the actual level of fragmentation for European blue chip stocks. Second, it aims to understand the factors favoring fragmentation by examining for which type of stocks the execution of trades is most fragmented between different trading venues. Third, it examines how liquidity and price quality relates to market fragmentation.
3 The remainder of the document is organized as follows. Section 2 reviews the related literature. Section 3 describes the sample, the organization of the markets for the stocks of the sample, and the data. The fourth section provides statistics on the level of market fragmentation and internalization, and investigates which factors may favor fragmentation. Section 5 focuses on the relation between fragmentation and liquidity, while Section 6 examines how price quality relates to fragmentation. Section 7 concludes.
2. Merits and drawbacks of multi-market trading: A review of the literature
A market is said to be fragmented when trading simultaneously takes place at different locations. The trade flow in a security may fragment for different reasons: 1) several trading mechanisms exists on the primary exchange for the trading of the security; 2) the security is cross-listed and several exchanges compete for the order flow, 3) ATSs compete with the primary exchange, 4) a portion of the order flow is internalized by broker-dealers or executed in the OTC market etc. Whether fragmentation adversely affects market quality has already been addressed in several research articles which alternatively points out positive and negative effects. One of the first empirical works conducted on this matter is that of Hamilton (1979) who studied the effects of off-board trading of NYSE-listed stocks on the regional exchanges and in the third market. Hamilton (1979) documents two opposite effects: one the one hand, the dispersion of trading may increase competition and thus improve liquidity (competition effect); on the other hand, it may “prevent full realization of any economies of centralized trading on the exchange” (fragmentation effect).
2.1. Merits of market consolidation and drawbacks of order flow fragmentation
Security market centers are often considered as natural monopolies because the marginal cost of a trade decreases with the quantity of orders executed in the market. First, a great part of the costs born to run a market are fixed expenses, so that a consolidated market enjoys
4 economies of scale. If several markets that use the same technology and market model compete together, the one with the highest volume has the lowest average cost, and thereby enjoys a competitive advantage.
Second, there are network externalities associated with running a market. A market becomes more attractive as the number of traders increases. It is easier to find a counterparty in a market where there are more people willing to trade, so that the consolidation of the order flow creates economies of scale on the provision of liquidity (Mendelson, 1987). Pagano (1989) shows that, when a security trades in two markets with similar structures and types of investors, orders concentrate in the market where traders are foreseen to be more numerous.
Third, under information asymmetry, Chowdry and Nanda (1991) show that adverse selection costs increase with the number of markets listing an asset. Besides, when a new market opens for a stock, it may skim the least informed and consequently more profitable orders, and then harm the liquidity of the primary market (Easley, Kiefer, and O’Hara, 1996; Bessembinder and Kaufman, 1997). Consistently, Bennett and Wei (2006) provide evidence that stocks switching from the Nasdaq fragmented environment to the more consolidated NYSE structure experience an improvement in market quality. Using European data, Gajewski and Gresse (2007) show that trading costs are smaller in a centralized order book than in a hybrid market equally fragmented between an order book and competing dealers off the order book.
Fourth, another cost of fragmentation is that priority rules are difficult to maintain across markets. With transparency, an investor can send his order to the market with the best price. However, price priority can sometimes be violated, in particular, when large orders in one market trade through prices in another market. According to Foucault and Menkveld (2008), the rate of these so-called trade-throughs exceeded 73% in the case of the competition
5 between the LSE’s EuroSETS order book and the Euronext’s NSC order book for the trading of Dutch stocks.
2.2. Drawbacks of market consolidation and merits of competition between trading venues
Because of the positive network externality that characterizes markets, trading systems with identical structures have a natural tendency to consolidate, as shown in Pagano (1989). Therefore, fragmentation often arises between trading systems that uses different mechanisms and thereby addresses the needs of different categories of investors. The ability to serve different clienteles and satisfy diverse trading needs is one of the positive aspects of fragmentation.
Another positive effect stemming from fragmentation is that it promotes innovation and efficiency. As mentioned by Stoll (2003), “The term “fragmentation” has a harmful connotation, but, in fact, fragmentation is just another word for competition.”. In the 90s, the SEAQ International, an order-driven market segment of the LSE, was competing with the continental European exchanges for the trading of blue chips stocks. It succeeded in diverting block trading from the primary exchanges, but progressively disappeared after continental exchanges and, in particular, the Paris Bourse, implemented block trading procedures in the home market. More recently, Euronext reduced tick sizes and the LSE changed their fee schedule to remain competitive in front of emerging MTFs. In the US, developing electronic trading on established exchanges was spurred by competitors’ pressure. In October 2002, in response to the pressure of ECNs, Nasdaq launched SuperMontage, an electronic trading platform gathering quotes from market makers and ECNs. In October 2006, the NYSE started to introduce its Hybrid market to enhance electronic trading and thus reduce floor trading (cf. Hendershott and Moulton, 2008).
With competition between market places, liquidity, and more specifically spreads, are often proved to improve. Battalio (1997) shows that the bid-ask spreads of NYSE-listed
6 securities tightens after a major third market broker-dealer starts operating. Boehmer and Boehmer (2003) document that the NYSE entry in the trading of ETFs listed on the American Stock Exchange improves their liquidity. Mayhew (2002) and Fontnouvelle, Fishe, and Harris (2003) finds that multi-market trading has the same consequences for the bid-ask spreads of equity options. Levin (2003) reviews several studies that examine the impact of fragmentation on market quality. He concludes that “Overall, these studies dent the theoretical prediction that fragmentation of trading may decrease market quality”. The studies reviewed by Levin (2003) were based on data from the US markets in the mid 90s, a period during which spreads have been shown to decrease dramatically on Nasdaq (cf. Barclay et al., 1999) as well as the NYSE (cf. Jones, 2002). In addition, the findings of Huang (2002) suggest that the proliferation of alternative trading venues, such as ECNs, may promote quality rather than fragmenting markets. With respect to European markets, Lee (2002) reviews several empirical studies conducted on the competition between SEAQ International and various continental European exchanges in the 90s. He concludes that most of the measures of market performance show that such competition was beneficial.
Some studies not only examine liquidity effects but also investigate the impact of market fragmentation on price quality. By examining the entries of multiple markets into transacting three major US ETFs, Nguyen, Van Ness, and Van Ness (2007) show that the competition effect dominates the fragmentation effect, and do not find that multi-market trading harms price efficiency or increases price volatility. A recent study by O’Hara and Ye (2009), based on a large sample of Nasdaq and NYSE listed equities, shows that fragmentation reduces transaction costs, increases execution speed, and makes prices closer to being a random walk.
Competition between order books may have specific features. Foucault and Menkveld (2008) focus on the recent competition between EuroSETS, the order book run by the LSE for Dutch stocks, and NSC, the order-driven system of Euronext Amsterdam. They show, both
7 theoretically and empirically, that, due to the absence of price priority across markets, consolidated depth (i.e. the sum of all shares available at that price or better in both markets) is larger after EuroSETS entry.
3. Sample, market organization, and data
3.1. Sample selection
The study is based on a three-month observation period after MiFID implementation, which spreads from 7 April to 30 June 2008. The stocks considered are the constituents of the AEX, the CAC 40, the DAX 30, and the FTSE 100 indices, plus other European stocks compounding the DJ Stoxx 50 and the DJ Euro Stoxx 50. Any stock that was added to or removed from one of these indices during the period is excluded.
Several corporate characteristics as well as daily closing prices have been collected from Datastream. Ownership structure data as of 30 June 2008 have been retrieved from Thomson One Banker. Information on the existence of ADRs and the type of ADRs issued when any, was found on the website of the Bank of New York Mellon.3 High frequency market data from various markets and trade reporting entities have been provided by Intelligent Financial Systems Limited (IFS). Unfortunately, trade data available for German equities do not cover all German market centers and do not allow me to calculate reliable volume statistics because of obvious multiple reporting. DAX 30 securities as well as German exchange trade data for other stocks are thus excluded from the analysis.
Matching the aforementioned databases results in a final sample of 152 blue chip stocks issued by companies from eight European countries.4 After removing from the observation
3 www.adrbnymellon.com.
8 period any date when at least one primary exchange is closed,5 the observation period consists of 55 business days. For some stocks, a relatively small portion of the order flow is traded in another currency than that of the issuer. For sake of simplicity, I have chosen to consider the order flow in home currency solely. The case of the stock Royal Dutch Shell A is ambiguous though, as the stock is listed at the London Stock Exchange with prices quoted in pence sterling (GBX) and is listed on Euronext Amsterdam with prices quoted in euros (EUR). So as to avoid the complexity of price conversion in real time, I have considered the stock priced in GBX and the stock priced in EUR as two distinct securities in the sample. This choice increases the size of the sample to 153.
Prices of Swiss and UK stocks are expressed in Swiss franc and pence sterling respectively. Some metrics used in the study require expressing all prices and volumes in euro. For that purpose, the daily foreign exchange rates of the CHF and the GBP against EUR have been downloaded from the Oanda website (www.oanda.com). For each day of the observation period, the exchange rate available on Oanda is the average ask rate observed in the FX market throughout that particular day.
3.2. Market organization for the trading of sampled stocks
3.2.1. Primary exchanges
The stocks of the sample are primarily listed on eight genuine exchanges: the London Stock Exchange (LSE), Borsa Italiana, Euronext Amsterdam, Euronext Paris, Euronext Brussels, the Madrid Stock Exchange,6 OMX Helsinki, and SWX Europe. Those exchanges all run electronic order books for the trading of large capitalization stocks. Buy and sell orders are continuously matched from the open to the close according to the price/time
5 New Year’s Day, Good Friday, and Easter Monday are closed on all exchanges. The 1st of May is a banking holiday for all exchanges but the LSE and Euronext Lisbon. 5 May 2008 and 26 May 2008 were UK banking holidays. 20 June 2008 was closed in Finland and Sweden. OMX Nordic Exchange Stockholm was closed on 6 June 2008. Finally, 2 January and 12 May are banking holidays in Switzerland.
6 The Madrid Stock Exchange is the largest component of the BME group (Bolsas y Mercados Espaňoles) that encompasses four regional exchanges. The four markets use the same order-driven electronic system: SIBE.
9 priority rules, and trading sessions commence and finish with call auctions. The LSE and Borsa Italiana merged in 2007 but are still operating as independent exchanges. Other cross-border exchanges such as Nyse-Euronext or Nasdaq OMX, were still running one order book per country at the time of the study. Until 14 January 2009, Euronext, the European branch of Nyse-Euronext, had four order books operating with the NSC system: Euronext Amsterdam, Euronext Brussels, Euronext Lisbon, and Euronext Paris. OMX, the European subsidiary of Nasdaq OMX, encompasses seven national European stock markets, among which OMX Helsinki for Finland. Furthermore, the SIX group incorporates two exchanges: SIX Swiss Exchange and SWX Europe. All Swiss stocks that are not constituents of the SMI index are traded on SIX Swiss Exchange, while SWX Europe7 (previously Virt-X) caters for the trading of Swiss stocks compounding the SMI index and non-Swiss European Blue Chip stocks. Intraday trading hours applying to order book trading on those eight exchanges are reported in Table 1.
Table 1 about here
Parallel to the central order books, off-order-book trading can be substantial on some exchanges. In particular, at the London Stock Exchange, an important dealership activity has always existed simultaneous to order book trading since its introduction in 1997. Broker-dealers execute a significant part of the order flow outside the book and the majority of retail orders are routed to dealers specialized in retail trading, the so-called RSPs. Off order book trading is less developed on continental exchanges, where the order book market model has been prevailing for a long time, and where concentration rules existed before the implementation of MiFID. Table 1 also mention on which exchanges a concentration rule applied before MiFID.
7 SWX Europe currently provides on order book trading for 280 equity securities pertaining to top pan-European blue-chip market indices. From a regulatory point of view, these securities are listed by a competent listing authority and are admitted to trading on SWX Europe, a UK regulated market, in addition to trading on one or more other exchanges. SWX Europe is under the authority of the FSA.
10
3.2.2. Other trading venues
At the time of the study, several MTFs and SIs were already competing with traditional exchanges. The biggest MTFs or emerging exchanges that were active at that time were the Chi-X order-driven platform launched by Instinet, the PLUS quote-driven exchange, and the POSIT crossing network run by ITG.
The Chi-X MTF is an order-driven matching engine in which anonymous orders are matched continuously from 06:35 to 16:30 (UK time) in time-price priority. No call auctions are organized either at the open or at the close. Chi-X is closed on New Year’s Day, Good Friday, Easter Monday, Christmas day, and Boxing Day, and typically observes the domestic market practice for open business days. At the time of the observation period, all sampled stocks were tradable on Chi-X except the Italian and the Spanish ones.
Also sampled stocks were also tradable on PLUS. This new Londonish exchange is a quote-driven electronic platform that offers an execution venue for securities listed elsewhere in London and in continental Europe, in addition of those primarily listed on PLUS. The list of stocks traded on PLUS covers more than 850 liquid securities including FTSE100 stocks and other European blue-chip stocks. On the PLUS platform, competing market makers display two-way quotes in a minimum size known as the Exchange Market Size, during the Mandatory Quote Period (MQP), i.e. from 8:00 to 16:30 UK time.
POSIT is a crossing network in which non-visible anonymous orders are matched and executed at the mid-quote derived from the primary exchange. It is registered as an MTF and is considered as a dark pool in the sense that POSIT orders cannot be observed from other traders and do not contribute to price discovery. For European stocks, periodic batch matches take place at 09:00, 09:30, 10:00, 11:00, 12:00, 14:00, 15:00, and 16:00 in UK time, and between periodic matches, orders can cross with each other on a continuous basis.
11 Finally, investment banks registered as systematic internalizers, can also execute order flow internally, either by crossing client orders internally, or on own account as dealers.
3.2.3. Trade reporting facilities
Under MiFID, any trade, independent from the type of execution, must be reported, but not necessarily with primary exchanges. RMs and most MTFs report their trades themselves. Systematic internalizers and OTC traders delegate trade reporting to specialized entities such as the reporting facility of the LSE or Markit BOAT, designated as BOAT in the remainder of the paper. To date, BOAT appears to be the major player in the trade reporting business.
3.3. High frequency data and data filtering
Best limit and trade data covering the observation period have been generously delivered by IFS. IFS data have been generated from the original order flow of the eight primary exchanges of sampled stocks, as well as Chi-X, PLUS, and BOAT. POSIT data are not covered, but given that POSIT activity focuses on small and middle capitalization stocks and that their market share in blue chip stocks is very low in percentage, not holding their data should not bias the study.
For each stock, the data contain the trade prices and best limit quotes of all trading venues where the stock is priced in the same currency as that of the primary listing. Order flow in other currencies is not considered. All timestamps in the database are in UK time and hours will be expressed in UK time throughout the paper.
Best limit data received from IFS provide, at each second of the trading session from 8:00 to 16:30, the best bid price, the best ask price, and quantities associated, for every trading venue where a quote is displayed. The quotes originate from PLUS, Chi-X, and the order books of traditional exchanges. No quote comes from BOAT as their activity is restricted to trade reporting. Bid and ask prices with times that could fall inside the opening auction
12 periods or after the end of the continuous session of the primary exchange, are eliminated. As a result of this rule, I have deleted from the dataset, bid and ask quotes with times:
- before 08:05 for Italian stocks and before 08:01 for all other securities,
- after 16:20 for the stock primarily listed on OMX Nordic Exchange Helsinki (Nokia) and Swiss stocks traded on SWX Europe,
- after 16:30 for any other stock.
Trade data cover the same markets as quote data plus BOAT-reported trades which essentially are OTC trades or trades executed by SIs. IFS trade data encompass continuous trades for all markets and call auction trades for all exchanges but Borsa Italiana. For each trade, the data provide the execution time, the price, the size in number of shares, as well as best bid and ask prices, best bid and ask displayed quantities, and bid and ask effective prices prevailing on every sampled market at the time of the trade.
For all trading venues, overnight transactions, that is transactions executed before 07:00 and after 17:00, have been eliminated from the dataset. LSE-reported trades have a 2-figure trade-type code. Any LSE trade for which this code indicates that the trade results from an option exercise, a stock swap, or the cancellation of a previous trade, is deleted.
I have then identified batch auction trades. For the LSE, SETS call auction trades are flagged with a special trade code. On other exchanges, fixing trades have to be identified with trading times. At the open, trades whose execution time is the first trade time observed at or after the official start time of the open auction period are considered as open auction trades. At the close, trades executed at the first trade time immediately superior or equal to the official start time of the close auction but no later than the end time of the close auction period are identified as close auction trades. Once auction trades have been determined, other trades are classified into three groups: continuous trades executed between the open and the close auctions, pre-open trades, and post-close trades.
13 4. Characterizing market fragmentation
To have an order executed in the market environment described at Section 3, a trader has the choice between several order books, a crossing network, a quote-driven platform, or systematic internalizers’ services. To assess the actual level of order flow fragmentation and its impact on market quality, I examine the share of volume executed out of primary exchanges and its correlation with liquidity metrics and variance ratios.
4.1. Measuring fragmentation
The level of fragmentation is measured for each stock i on each day t of the observation period by reporting the volume executed off the primary exchange to the total volume reported for the stock on that date. When measuring volumes, two types of order flow are distinguished: trading volumes executed on MTFs and RMs, referred to as the market-traded order flow and denoted MVi,t, and trading volumes executed by SIs or in the OTC market, referred to as the internalized order flow and denoted IVi,t. Statistics on internalized volumes are established by using BOAT trade data as well as trades reported to the LSE as OTC or SI trades. The level of fragmentation for stock i on day t is then measured by three metrics:
1. the total fragmentation denoted FRi,t and equal to the percentage of the total order flow (MVi,t +IVi,t) executed outside the primary exchange,
2. the fragmentation of the market-traded order flow, calculated as the percentage of MVi,t executed off the exchange of primary exchange, and denoted market
t, i
FR ,
3. the share of the total order flow internalized by SIs or executed in the OTC market, denoted intern
t, i
FR , and calculated as IVit,
(
MVit, +IVit,)
.These fragmentation rates are also measured per stock and per primary exchange for the entire observation period.
14
4.1. Fragmentation of the market-traded order flow
Primary exchanges are prominent in the execution of the market-traded order flow. For the whole sample compounded of 153 stocks, during the period from 7 April to 30 June 2008, the percentage of market-traded volumes executed off primary exchanges did not exceed 14%. Out those 14%, 7.8% were executed in other RMs, 5.7% on Chi-X, and 0.4% on PLUS. The 7.8% executed in other RMs distribute between exchanges of the same group as the primary exchange for 2.4% and other exchanges for 5.4%.
Figure 1 shows the distribution of market-traded volumes between different types of trading venues for eight sub-groups of stocks formed according to their exchanges of primary listing. For all sub-groups, the primary exchange is dominant, the market-traded order flow being particularly concentrated for all stocks primarily listed on, in order of decreasing rate of fragmentation, the Madrid Stock Exchange ( =2.3%), SWX Europe ( =8.7%), the LSE ( =12.7%), Borsa Italiana ( =14.4%), and Euronext Paris ( =16.9%).
Figure 1 about here
For Euronext Brussels, Euronext Amsterdam, and Borsa Italiana, the main competing RM appears to be the largest exchange of the exchange group to whom they are affiliated.
In spite of the dominant position of exchanges, Chi-X has succeeded in building a significant market share in large equities, with a share in market-traded volumes of more than 5% for LSE, Euronext Amsterdam, and Euronext Paris equities. PLUS, which is specialized in middle and small capitalization equities, has a visible market share for LSE large stocks only. Adding PLUS’ market share to that of Chi-X brings to 11.4% the share of MTFs in the market-traded volumes of LSE equities.
When examining the shares of off-group exchanges, the primary exchanges which are most challenged by exchanges not pertaining to their group are, in order, OMX Helsinki, Euronext,
15 and SWX Europe. The order flow diverted by off-group exchanges is generally captured by the LSE which, in contrast, loses very little order flow to other exchanges.
4.2. Fragmentation of the total order flow and internalization
When SI and OTC trades are included in the analysis, the share of internalized volumes in total traded volumes reaches 39%, which reduces the share of primary exchanges to 53.5% and that of Chi-X to 3.6%. However, these figures are a matter of discussion, as the accuracy of internalized volume statistics is imperfect. It is well acknowledged that internalized volumes may be subject to double or triple reporting, and may sometimes overlap market-traded volume statistics. An article by Jacquillat and Gresse (1998) dedicated to the competition between the electronic order book of the Paris Stock Exchange and the SEAQI dealer market, showed that dealer-reported volumes could be inflated by a factor 2 or 3. If this rule was roughly applied to our case, the actual share of internalized volumes would fall into a range between 17.6% and 24.2%, rather than nearly reaching 40%. Nonetheless, all internalized trades are not necessarily multiple reported and the correction by 2 or 3 might also be excessive. Assuming that half of internalized trades are double-reported would produce an inflation factor of 1.5 on the corresponding volumes. Dividing those volumes by 1.5 would make their market share decrease from 39% to 29.9%, which is probably closer to reality, but no available statistics allow checking this assessment at present.
4.3. Is the order flow more fragmented for some stocks than for others?
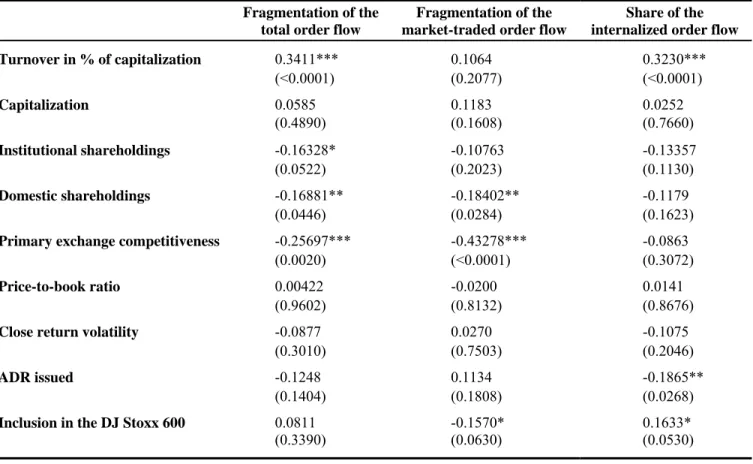
Factors favoring fragmentation are sought by testing the correlations between stock-by-stock fragmentation rates calculated for the whole observation period and company features as well as primary exchange competitiveness. The firm characteristics considered are market size, price-to-book ratios, daily return volatility, institutional shareholdings, foreign shareholdings, the inclusion in the Stoxx 600, and the issuance of ADRs. The proxy for
16 primary exchange competitiveness is the percentage of time when the primary exchange quotes the best prices on both the bid and the ask side of the market.
For the calculation of those correlations, Italian and Spanish stocks are excluded as they were not tradable on Chi-X at the time of the observation period. Therefore, their fragmentation rates were not directly comparable with those of other stocks.
Those correlations, reported in Table 2, show that the fragmentation of the total order flow is higher for stocks with higher turnover and lower primary exchange competitiveness. Concerning market size, findings differ by sub-groups of stocks. Across Euronext equities, the largest ones have a more fragmented order flow, while inside the sub-group of LSE-listed stocks, the order flow is more fragmented for smaller ones. Foreign shareholdings relate to total fragmentation for Euronext Amsterdam and LSE stocks only. The order flow in Dutch stocks is less fragmented for more domestically-held equities, whereas it is exactly the opposite for UK stocks. More precisely, UK stocks with a greater domestic ownership have a more fragmented order flow because a higher proportion of their order flow is internalized. The share of internalized volumes for LSE equities not only increases with domestic shareholdings but also increases with turnover. In addition, it decreases with market size which explains why fragmentation decreases with market size for LSE equities.
Table 2 about here
Finally, the only factor that is found to explain the fragmentation of the market-traded order flow, is the competitiveness of the primary exchange. Consistent with the intuition, the more competitive the primary exchange in terms of quotes, the lower the share of market-traded volumes executed off the exchange.
17 5. Fragmentation and liquidity
5.1. Measuring liquidity
Liquidity is measured for two categories of traders: small traders who can only connect to the primary exchange, and large traders who are connected to all trading venues or use smart order routers (SORs) that enable them to distribute their orders across several marketplaces. The former will be referred to as local traders, and the latter as global traders.
5.1.1. Spreads
Two measures of spreads are considered: quoted bid-ask spreads and effective spreads. On each day of the observation period, average quoted spreads are computed by using the best limit quotes of the primary exchange second by second:
∑
= − = Ki,t k iprexch,k prexch k , i prexch k , i t, i local t, i M B A K QS 1 1 , (1) where prexch k iM , , Biprexch,k , and Aiprexch,k are respectively the mid quote, the best bid quote, and
the best ask quote of stock i at second k; Ki,t is the number of seconds at which bid and ask quotes are observed on the primary exchange on day t for stock i.
Daily average quoted spreads are also computed by consolidating the quotes of all trading venues every second and extracting the highest best bid price and the lowest best ask price. Such spreads are designated as average global quoted spread and are determined as follows:
∑
= − = Ni,t n iconso,n conso n , i conso n , i t, i global t, i M B A N QS 1 1 , (2) where conso n iB, and Aiconso,n are respectively the highest best bid quote and the lowest best ask quote from all the trading venues quoting stock i at second n on day t; conso
n i
M , , the consolidated mid price, is the midpoint of the consolidated bid and quotes conso
n i
18
t i
N , is the number of seconds in day t for which there exists arbitrage-free consolidated bid and ask quotes stock i.
Spreads actually paid on trades are estimated with daily volume-weighted means of effective spreads calculated in two different manners. First, I calculate what I designate local effective spreads, that is spreads determined by relating the price of a trade to the mid-quote prevailing in the market where the trade was executed:
∑
∑
= = ⎟ ⎟ ⎠ ⎞ ⎜ ⎜ ⎝ ⎛ − × = it t i J j ilocalj local j i j i j i J j j i local t i M M P Q Q ES , , 1 , , , , 1 , , 1 2 , (3)with Pi,j being the price of the jth trade on stock i on day t; Qi,j being the size of the trade in number of shares; local
j i
M , being the local mid-price, that is the mid-price prevailing at the time of the jth trade on the trading venue where the trade was executed; Ji,t being the number of trades executed in all markets for stock i on day t.
Local effective spreads measure the trading costs effectively born by the local traders of that market. Daily averages of global effective spreads are computed by relating trade prices to the middle price found by scanning the best bid and ask quotes of all trading venues, that is multi-market consolidated mid quote conso
j , i
M prevailing at the time of trade j:
∑
∑
= = ⎟ ⎟ ⎠ ⎞ ⎜ ⎜ ⎝ ⎛ − × = it t i L j iconsoj conso j i j i j i L j j i global t i M M P Q Q ES , , 1 , , , , 1 , , 2 1 , (4) with conso j iM , being the consolidated mid price at the time of the jth trade; Li,t being the number of trades executed in all markets for stock i on day t, for which an arbitrage-free global mid-price can be observed.
Global effective spreads measure the trading costs actually paid by global traders. Daily means of local and global effective spreads are weighted by transaction volumes.
19 Besides, when consolidating the quotes of all trading venues, it may happen that the best bid price prevailing on a trading venue exceeds the best ask price prevailing on another one, so that the consolidate bid-ask spread is negative and prices are not arbitrage-free. Observations for which cross-market quotes are not arbitrage-free are eliminated from the calculation of daily average global spreads.
5.2. Depths
Depth is defined as the quantity to be traded to move prices by one unit and it is commonly measured with quantities displayed at the bid and ask quotes. In the present study, it is assessed locally on the primary exchange and globally across trading venues. On each day and for each stock, local depth is measured by averaging the sum of the visible quantities available at the first best limit prices on the primary exchange and expressed in currency units:
(
)
∑
= × + × = Ki,t k prexch k , i prexch k , i prexch k , i prexch k , i t, i local t, i Qbid B Qask A K D 1 1 , (5) where prexch k iQbid , and Qaskiprexch,k are the visible quantities in number of shares available at
the best bid and the best ask quotes respectively at second k for stock i on day t.
Global depth is measured by aggregating the displayed quantities offered by the venues that quote the best cross-market bid and ask prices:
(
)
∑
= × + × = Ni,t n conso n , i conso n , i conso n , i conso n , i t, i global t, i Qbid B Qask A N D 1 1 , (6) where conso n iQbid , (Qaskiconso,n ) is obtained by aggregating the best bid (ask) quantities on all the venues where the best bid (ask) price is conso
n i
20
5.3. Illiquidity ratios
Synthetic metrics of illiquidity are built by reporting spreads to the quantities that can be traded within those spreads. Such ratios can be viewed as the marginal cost of trading one share or, in other words, as the sensitivity of prices to quantities. This cost is modeled in Kyle (1985) as a constant coefficient λ whose inverse value is the depth of the market in that trading 1/ λ shares moves prices by one. In other words, λ is an illiquidity coefficient that can be interpreted as the sensitivity of prices to quantities. As in Gajewski and Gresse (2007), I use empirical proxies of Kyle’s λ by reporting relative spreads to quantities in thousands of currency units. Such illiquidity ratios represent the marginal cost of trading an additional amount of 1,000 currency units in percentage of the mid-quote. Local (Global) quoted illiquidity ratios are calculated every second by dividing local (global) quoted bid-ask spreads by associated local (global) depths. Local (Global) effective illiquidity ratios are calculated on a trade-by-trade basis by dividing local (global) effective spreads by trade sizes. In those calculations, depths and trade sizes are expressed in thousands of currency units. Illiquidity ratios are averaged per day and per stock. Daily means of effective ratios are quantity-weighted. Daily means of global ratios only include observations for which cross-market prices are arbitrage-free. Calculation formulas stand as follows:
(
)
(
)
∑
= + × × − − = Ki,tk iprexch,k iprexch,k iprexch,k prexch k , i prexch k , i prexch k , i t, i local t, i M Qbid Qask M B A K QIR 1 10 3 1 , (7)
(
)
(
)
∑
= + × × − − = Ni,tn iconso,n iconso,n iconso,n conso n , i conso n , i conso n , i t, i global t, i M Qbid Qask M B A N QIR 1 10 3 1 , (8)
(
)
∑
∑
= − = × × − × = i,t t , i J j i,j ilocal,j local j , i local j , i j , i j , i J j i,j local t, i M Q M M P Q Q EIR 1 3 1 10 1 , (9)21
(
)
∑
∑
= − = × × − × = i,t t , i L j i,j iconso,j conso j , i conso j , i j , i j , i L j j , i global t, i M Q M M P Q Q EIR 1 3 1 10 1 , (10) where local t, iQIR , QIRiglobalt, , EIRilocalt, , and EIRiglobalt, respectively denotes the average local quoted, global quoted, local effective, and global effective illiquidity ratios, for stock i on day
t.
5.2. Testing how liquidity relates to fragmentation
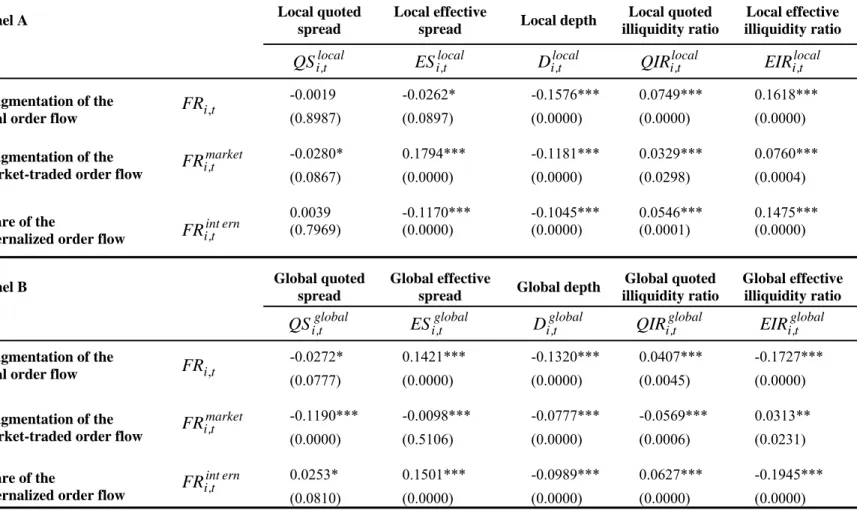
The relation between liquidity and trade flow fragmentation is examined by calculating temporal correlations between the daily measures of liquidity and the daily measures of fragmentation. It is acknowledged that a part of these correlations is attributable to the fact that trading activity impacts both liquidity and fragmentation at the same time. So as to isolate the correlation that is independent from trading volumes, I compute stock-by-stock time-series partial correlations that control for daily trading volume. Then I test whether their cross-sample averages significantly differs from zero. All results are reported in Table 3.
Table 3 about here 5.2.1. Spreads and fragmentation
Local quoted spreads of primary exchanges do not significantly correlate with any fragmentation measure on average across the whole 153-stock sample. The average correlation between local effective spreads and the fragmentation rate of the total order flow is weakly negative.8 When distinguishing the fragmentation of the market-traded order flow from the share of internalization, local effective spreads positively correlate to the former, and negatively correlate to the latter, with high statistical significance in both cases.
As for global quoted and effective spreads, they significantly decrease with the fragmentation of market-traded order flow, but they are positively correlated with
22 internalization, the statistical significance of that positive correlation being weaker9 for quoted spreads.
5.2.2. Depth and fragmentation
On average across the sample, correlations between depths measures and fragmentation rates are significantly negative. The more fragmented the order flow, the lower the quantities displayed at the best quotes. In fact, trading volumes and depths relate with fragmentation in the same way as they relate with algorithmic trading. On the one hand, trading volumes increase with fragmentation because new volume is generated by arbitrage opportunities arising between markets. Volumes also increase with algorithmic trading, as the development of automated trading entails an extreme increase in volume of orders, cancellations, and trading messages. On the other hand, the decrease in average depth and average trade size can be as much a consequence of electronic algorithmic trading10 as a consequence of fragmentation.
5.2.3. Illiquidity ratios and fragmentation
Illiquidity ratios are positively correlated with fragmentation, with the exception of global effective illiquidity ratios which decrease with total order flow fragmentation. The positive correlation observed for most ratios indicates a liquidity deterioration with fragmentation. However, the negative correlation between global effective illiquidity ratios and total fragmentation contrasts that conclusion. Indeed, it means that the actual liquidity obtained by a global trader trading in several markets improves with fragmentation. Analyzing the correlation with internalization rates separately shows that this positive relation between effective liquidity and fragmentation is assignable to internalization but not to market-traded order flow fragmentation.
9 10% level.
23 6. Fragmentation and price quality
6.1. Measuring price quality
Price quality is assessed in this study by variance ratios that report a short-term return variance to a long-term return variance. Such ratios were first suggested by Hasbrouck and Schwartz (1988). Theoretically, if prices are perfectly efficient, they should follow a random walk and price autocorrelation should not be significantly different from zero. In the absence of auto-correlation, a variance ratio reporting k times the variance of returns measured on α -minute intervals to the variance of returns measured on kα-minute intervals should equal one. In the case of stiky prices, α-minute returns are positively correlated, so that the ratio exceeds one. Conversely, in case of over-reaction, α-minute returns are negatively correlated, and the ratio is lower than one. The closer the ratio to one, the more efficient the prices.
I use two variance ratios: a ratio reporting 15 times the 1-minute mid-quote return variance to the 15-minute quote return variance, and a ratio reporting 6 times the 5-minute mid-quote return variance to 30-minute mid-mid-quote return variance. The distances between those ratios and 1 can be considered as inverse measures of price quality. They will be referred to as price inefficiency coefficients and thus denoted PIC. More explicitly, PICs are calculated as follows: min t, i min t, i t, i Var Var PIC 15 1 15 1− =1−15 , (11) min t, i min t, i t, i Var Var PIC 30 5 30 5− =1−6 , (12)
where Variα,tmin is the variance of mid-price α-minute returns computed in logarithm for stock
24 All returns are computed in logarithm on the mid-quotes of the primary exchange from 08:15 to 16:15. The trading session has been truncated from the first and the last quarters in order to avoid open and close auction periods and to get the same number of minutes in each 15- and 30-minute period of the trading day.
6.2. Testing how price quality relates to fragmentation
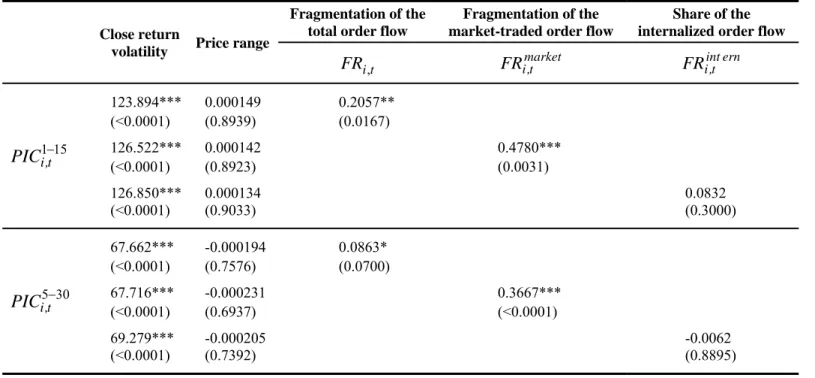
Inefficiency coefficients are calculated for each day and each stock of the sample. Then, temporal correlations between daily by-stock inefficiency coefficients and daily stock-by-stock fragmentation ratios are investigated through panel regressions in which the daily efficiency measures are the dependent variables and each fragmentation measure is used, in turn, as the independent variable. Those panel regressions are designed with a fixed effect per stock, a fixed effect per day, and a one-lag moving average term that accounts for auto-correlation. They control for close-return volatility and daily price range.
Table 4 displays the results. While market-traded order flow fragmentation appears to affect price quality, the share of internalized volumes does not. The regressions put forward a positive correlation between inefficiency coefficients and market-traded order flow fragmentation, that is a deterioration of prices’ quality with that type of fragmentation. In contrast, no significant correlation is found between price quality measures based on variance ratios and internalization rates.
Table 4 about here
7. Conclusion
The coming into force of the MiFID has fomented competition, complexity, and change in the trading industry across Europe. This empirical study based on a sample of 153 European blue chip stocks over a post-MiFID three-month period from April to June 2008 reveals that turnover and fragmentation are positively correlated, a high turnover favoring fragmentation,
25 and reversely, fragmentation generating more volumes. The factor that most determines market-traded order flow fragmentation appears to be the primary exchange’s competitiveness. Market size is another determinant, but its effect on fragmentation differs from one market to another. Large Euronext equities have a more fragmented order flow, whereas among LSE securities, the smallest have the most fragmented volumes. With regard to the consequences of fragmentation, depth is found to decrease with fragmentation. The way other measures of liquidity correlate with fragmentation is diverse and depends on the market, the type of liquidity metrics, and the type of fragmentation that is considered. All in all, fragmentation seems to be more beneficial to global traders trading in several market places than to local traders trading on the primary exchange only, which confirms the crucial role of SORs in fragmented markets. Further, fragmentation adversely affects price quality by increasing short-term volatility for LSE equities but not for other stocks of the sample. That adverse effect is assignable to market-traded order flow fragmentation but not to internalization which is not found to impact price quality for any sub-sample.
However, the results obtained in this empirical work should be interpreted having in mind some inevitable caveats. In terms of methodology, the approach consists in analyzing correlations. It thus allows us to conclude on the co-movements of the variables taken into consideration, but not on causality. New trading venues have quickly appeared in Europe after the observation period used in the study, and the degree of competition between marketplaces has continued to grow. Therefore, extending the observation period later in time may reveal effects that could not be identified in the early months after the MiFID enforcement.
Another caveat lies in the manner by which orders and trades were initially time-stamped. The liquidity metrics used in the study requires to synchronize trade prices with quotes for each market, and to synchronize prices from all trading venues. Ideally, orders and trades
26 should be time-stamped with systems set on a unique clock in order to make the synchronization process perfectly accurate. In practice, order and trade messages were time-stamped by the system of a data supplier with the time at which they arrived in that system. As a result, clock uniqueness is ensured, but a time delay whose maximum value can be estimated to one second may have elapsed between the timestamp and the actual time of occurrence of the trading message in its trading venue.
More importantly, the available data only allow to assess liquidity with measures based on traditional spreads and displayed quantities at the first best limits. Other dimensions such as speed of order execution, fill rate of orders, hidden depth or depth available at farther limits inside the order book could not be tested. Last but not least, with the MiFID, no trade remains unreported, but unfortunately, no centralized mechanism has been put in place to impede multiple reporting across marketplaces.
27 References
Barclay, Michael J., William G. Christie, Jeffrey H. Harris, Eugene Kandel, and Paul H. Schultz, 1999, “The Effects of Market Reform on the Trading Costs and Depths of Nasdaq Stocks”, Journal of Finance, 54(1), 1-34.
Battalio, Robert H., 1997, “Third Market Broker-Dealers: Cost Competitors or Cream Skimmers?”, Journal of Finance, 52(1), 341-352.
Bennett, Paul, and Li Wei, 2006, “Market Structure, Fragmentation, and Market Quality”,
Journal of Financial Markets, 9(1), 49-78.
Bessembinder, Hendrick, and Herbert M. Kaufman, 1997, “A Cross-Exchange Comparison of Execution Costs and Information Flow for NYSE-listed Stocks”, Journal of Financial
Economics, 46(3), 296-319.
Boehmer, Beatrice, and Ekkehart Boehmer, 2003, “Trading Your Neighbor’s ETFs: Competition or Fragmentation?”, Journal of Banking and Finance, 27(9), 1667-1703. Chowdry, Bhagwan, and Vikram Nanda, 1991, “Multimarket Trading and Market Liquidity”,
Review of Financial Studies, 4(3), 483-511.
Easley, David, Nicholas M. Kiefer, and Maureen O’Hara, 1996, “Cream-Skimming or Profit-Sharing? The Curious Role of Purchased Order Flow”, Journal of Finance, 51(3), 811-833. de Fontnouvelle, Patrick, Raymond P. H. Fishe, and Jeffrey H. Harris, 2003, “The Behavior of Bid-Ask Spreads and Volume in Options Markets during the Competition for Listings in 1999”, Journal of Finance, 58(6), 2437-2468.
Foucault, Thierry, and Albert Menkveld, 2008, “Competition for Order Flow and Smart Order Routing Systems”, Journal of Finance, 63(1), 119-158.
Gajewski, Jean-François, and Carole Gresse, 2007, “Centralised Order Books versus Hybrid Order Books: A Paired Comparison of Trading Costs on NSC (Euronext Paris) and SETS (London Stock Exchange),” Journal of Banking and Finance, 31(9), 2906-2924.
28 Hamilton, James L., 1979, “Marketplace Fragmentation, Competition, and the Efficiency of
the Stock Exchange”, Journal of Finance, 34(1), 171-187.
Hasbrouck, Joël, and Robert A. Schwartz, 1998, “Liquidity and execution costs in equity markets,” Journal of Portfolio Management, 14, 10-17.
Hendershott, Terrence, Charles J. Jones, and Albert J. Menkveld, 2010, “Does Algorithmic Trading Improves Liquidity?”, Journal of Finance, forthcoming.
Hendershott, Terrence, and Pamela C. Moulton, 2008, “Speed and Stock Market Quality: The NYSE’s Hybrid”, working paper, UC Berkeley and Fordham Graduate School of Business. Huang, Roger D., 2002, “The Quality of ECNs and Nasdaq Market Maker Quotes”, Journal
of Finance, 57(3), 1285-1319.
Jacquillat, Bertrand, and Carole Gresse, 1998, “The Diversion of Order Flow on French Stocks from CAC to SEAQ International: A Field Study”, European Financial
Management, 4(2), 121-142.
Jones, Charles, 2002, “A century of stock market liquidity and trading costs”, working paper, Columbia University.
Kyle, Albert S., 1985, “Continuous auction and insider trading,” Econometrica, 53(6), 1315-1336.
Lee, Ruben, 2002, “Capital Markets that Benefit Investors. A Survey of the Evidence on Fragmentation, Internalisation, and Market Transparency”, Oxford Finance Group.
Levin, Mattias, 2003, “Competition, Fragmentation, and Transparency: Providing the Regulatory Framework for Fair, Efficient, and Dynamic European Securities Markets - Assessing the ISD Review”, CEPS Task Force Report, Centre for European Policy Studies. Mayhew, Stewart, 2002, “Competition, Market Structure, and Bid-Ask Spreads in Stock
29 Mendelson, Haim, 1987, “Consolidation, Fragmentation, and Market Performance”, Journal
of Financial and Quantitative Analysis, 22(2), 189-207.
Nguyen, Vanthuan, Bonnie F. Van Ness, and Robert A. Van Ness, 2007, “Short- and Long-Term Effects of Multimarket Trading”, Financial Review, 42(3), 349-372.
O’Hara, Maureen, and Mao Ye, 2009, “Is Fragmentation Harming Market Quality?”, working paper, Cornell University.
Pagano, Marco, 1989, “Trading Volume and Asset Liquidity”, Quarterly Journal of
Economics, 104(2), 255-274.
Stoll, Hans, 2003, “Market Microstructure”, in Constantinides, G., Harris, M., and Stulz, R. eds., Handbook of the Economics of Finance, Volume 1A, Amsterdam: Elsevier.
30 Table 1. Trading hours for blue chip stocks on the stock exchanges of the sample
Exchange group Branch or trading segment Electronic
system
Open call
auction* Continuous trading*
Close call auction*
CR** prior to MiFID
LSE-Borsa Italiana LSE SETS 08:00 08:00-16:30 16:35 No
Borsa Italiana 08:03-08:05 08:05-16:25 16:33-16:35 Yes
Nyse-Euronext Euronext Amsterdam NSC 08:00 08:00-16:30 16:35 Yes
Euronext Brussels NSC 08:00 08:00-16:30 16:35 Yes
Euronext Paris NSC 08:00 08:00-16:30 16:35 Yes
SIX Group SWX Europe - Swiss stocks SWX 08:00 08:00-16:20 16:35 No
SWX Europe - non-Swiss
stocks SWX None 08:00-16:30 None No
Nasdaq OMX OMX Nordic Exchange Helsinki OMX 07:45-08:00 08:00-16:20 16:20-16:30 Yes
BME Madrid Stock Exchange SIBE 08:00 08:00-16:30 16:35 Yes
*: Trading hours are expressed in UK time. **: CR stand for concentration rule.
31 Figure 1. Distribution of market-traded volumes by primary exchange
76.0% 50.8% 81.4% 87.3% 97.7% 85.6% 83.1% 91.3% 10.9% 39.0% 10.6% 6.3% 7.8% 17.8% 2.3% 3.8% 11.1% 6.7% 6.9% 2.4% 0.7% 10.1% 5.6% 2.0% 1.3% 0% 20% 40% 60% 80% 100% 120% Euronext Ams. stocks (20) Euronext Bru. stock (1)
OMX Hel. stock (1)
LSE stocks (79) Madrid SE stocks (5) Borsa Italiana stocks (6) Euronext Par. stocks (38) SWX Eur. stocks (3)
32
Table 2. Stock characteristics and fragmentation level
Fragmentation of the total order flow
Fragmentation of the market-traded order flow
Share of the internalized order flow
Turnover in % of capitalization 0.3411*** 0.1064 0.3230*** (<0.0001) (0.2077) (<0.0001) Capitalization 0.0585 0.1183 0.0252 (0.4890) (0.1608) (0.7660) Institutional shareholdings -0.16328* -0.10763 -0.13357 (0.0522) (0.2023) (0.1130) Domestic shareholdings -0.16881** -0.18402** -0.1179 (0.0446) (0.0284) (0.1623)
Primary exchange competitiveness -0.25697*** -0.43278*** -0.0863
(0.0020) (<0.0001) (0.3072)
Price-to-book ratio 0.00422 -0.0200 0.0141
(0.9602) (0.8132) (0.8676)
Close return volatility -0.0877 0.0270 -0.1075
(0.3010) (0.7503) (0.2046)
ADR issued -0.1248 0.1134 -0.1865**
(0.1404) (0.1808) (0.0268)
Inclusion in the DJ Stoxx 600 0.0811 -0.1570* 0.1633*
33
Table 3. Average partial correlations between fragmentation and liquidity measures
Panel A Local quoted
spread
Local effective
spread Local depth
Local quoted illiquidity ratio Local effective illiquidity ratio local t, i
QS ESilocalt, Dilocalt, QIRilocalt, EIRilocalt,
Fragmentation of the
total order flow FRi,t
-0.0019 -0.0262* -0.1576*** 0.0749*** 0.1618***
(0.8987) (0.0897) (0.0000) (0.0000) (0.0000)
Fragmentation of the market-traded order flow
market t, i FR -0.0280* 0.1794*** -0.1181*** 0.0329*** 0.0760*** (0.0867) (0.0000) (0.0000) (0.0298) (0.0004) Share of the
internalized order flow
ern int t, i FR 0.0039 -0.1170*** -0.1045*** 0.0546*** 0.1475*** (0.7969) (0.0000) (0.0000) (0.0001) (0.0000)
Panel B Global quoted
spread
Global effective
spread Global depth
Global quoted illiquidity ratio Global effective illiquidity ratio global t, i
QS ESiglobalt, Diglobalt, QIRiglobalt, EIRiglobalt,
Fragmentation of the
total order flow FRi,t
-0.0272* 0.1421*** -0.1320*** 0.0407*** -0.1727***
(0.0777) (0.0000) (0.0000) (0.0045) (0.0000)
Fragmentation of the market-traded order flow
market t, i FR -0.1190*** -0.0098*** -0.0777*** -0.0569*** 0.0313** (0.0000) (0.5106) (0.0000) (0.0006) (0.0231) Share of the
internalized order flow
ern int t, i FR 0.0253* 0.1501*** -0.0989*** 0.0627*** -0.1945*** (0.0810) (0.0000) (0.0000) (0.0000) (0.0000)
This table reports the cross-sectional average of stock-by-stock time-series partial correlations between fragmentation measures and liquidity measures calculated for 153 stocks. Partial correlations control for the effect of trading volume. P-values are in brackets. ***, **, * indicate that the average correlation is statistically different from zero at the 1%, 5%, or 10% level respectively.
34
Table 4. Panel regression of Price Inefficiency Coefficients (PICs) on fragmentation measures
Close return
volatility Price range
Fragmentation of the total order flow
Fragmentation of the market-traded order flow
Share of the internalized order flow
t i
FR, FRimarkett, FRiintt, ern
15 1− t, i PIC 123.894*** 0.000149 0.2057** (<0.0001) (0.8939) (0.0167) 126.522*** 0.000142 0.4780*** (<0.0001) (0.8923) (0.0031) 126.850*** 0.000134 0.0832 (<0.0001) (0.9033) (0.3000) 30 5− t, i PIC 67.662*** -0.000194 0.0863* (<0.0001) (0.7576) (0.0700) 67.716*** -0.000231 0.3667*** (<0.0001) (0.6937) (<0.0001) 69.279*** -0.000205 -0.0062 (<0.0001) (0.7392) (0.8895)