Publisher’s version / Version de l'éditeur:
Journal of the Acoustical Society of America, 98, 1, pp. 294-301, 1995
READ THESE TERMS AND CONDITIONS CAREFULLY BEFORE USING THIS WEBSITE. https://nrc-publications.canada.ca/eng/copyright
Vous avez des questions? Nous pouvons vous aider. Pour communiquer directement avec un auteur, consultez la première page de la revue dans laquelle son article a été publié afin de trouver ses coordonnées. Si vous n’arrivez pas à les repérer, communiquez avec nous à [email protected].
Questions? Contact the NRC Publications Archive team at
[email protected]. If you wish to email the authors directly, please see the first page of the publication for their contact information.
NRC Publications Archive
Archives des publications du CNRC
This publication could be one of several versions: author’s original, accepted manuscript or the publisher’s version. / La version de cette publication peut être l’une des suivantes : la version prépublication de l’auteur, la version acceptée du manuscrit ou la version de l’éditeur.
Access and use of this website and the material on it are subject to the Terms and Conditions set forth at
Subjective evaluation of new room acoustic measures
Soulodre, G. A.; Bradley, J. S.
https://publications-cnrc.canada.ca/fra/droits
L’accès à ce site Web et l’utilisation de son contenu sont assujettis aux conditions présentées dans le site LISEZ CES CONDITIONS ATTENTIVEMENT AVANT D’UTILISER CE SITE WEB.
NRC Publications Record / Notice d'Archives des publications de CNRC:
https://nrc-publications.canada.ca/eng/view/object/?id=7b22a15d-0388-40ea-a6b0-1df0b0c2e13f https://publications-cnrc.canada.ca/fra/voir/objet/?id=7b22a15d-0388-40ea-a6b0-1df0b0c2e13f
http://www.nrc-cnrc.gc.ca/irc
Subje c t ive e va lua t ion of ne w room a c oust ic m e a sure s
N R C C - 3 9 2 3 9
S o u l o d r e , G . A . ; B r a d l e y , J . S .
J a n u a r y 1 9 9 5
A version of this document is published in / Une version de ce document se trouve dans:
Journal of the Acoustical Society of America, 98, (1), pp. 294-301, 1995
The material in this document is covered by the provisions of the Copyright Act, by Canadian laws, policies, regulations and international agreements. Such provisions serve to identify the information source and, in specific instances, to prohibit reproduction of materials without written permission. For more information visit http://laws.justice.gc.ca/en/showtdm/cs/C-42
Les renseignements dans ce document sont protégés par la Loi sur le droit d'auteur, par les lois, les politiques et les règlements du Canada et des accords internationaux. Ces dispositions permettent d'identifier la source de l'information et, dans certains cas, d'interdire la copie de documents sans permission écrite. Pour obtenir de plus amples renseignements : http://lois.justice.gc.ca/fr/showtdm/cs/C-42
Subjective evaluation of new room acoustic measures
Gilbert A. Soulodre
Department of Psychology, Carleton University, 1125 Colonel By Drive, Ottawa, Ontario KIS 5B6, Canada
John S. Bradley
Acoustics Laboratory, National Research Council Canada, Ottawa, Ontario K1A OR6, Canada
(Received
20 July 1994;
revised
17 February
1995;
accepted
21 February
1995)
A series of experiments were conducted to evaluate several acoustical measures as predictors of subjective judgments. Subjects were asked to rank binaurally reproduced sound fields in terms of loudness, clarity, reverberance, bass, treble, envelopment, apparent source width, and overall preference. The binaural impulse responses were measured in several North American concert halls and were chosen so as to cover as broad a range as possible of RT, EDT, C80, G, IACC, and LF values. The results of these tests were then correlated with the various octave-band objective measures to find the best predictor of each subjective parameter. New objective quantities were found that are correlated with loudness, clarity, bass, and treble judgments. The relative importance of the various subjective parameters to the overall preference of these sound fields was also examined. ¸ 1995 Acoustical Society of America.
PACS numbers: 43.55.Hy, 43.55.Ka
INTRODUCTION
About a hundred years have passed since Sabine first developed his measure of reverberation time as a predictor of the acoustic quality of rooms. However, it has long been
realized that reverberation time alone is insufficient to com-
pletely describe the complex combination of parameters (not all of them acoustic) that determine a listener's perception of a given concert hall. As a result much effort over the past several decades has been devoted to understanding the sub- jective building blocks which combine to form a listener's opinion, and to developing objective measures to predict these parameters. The present paper reports the results of a series of experiments designed to examine the suitability of various objective measures as predictors of subjective rat- ings.
There are several experimental approaches which can be used in such a study. Each approach has its merits and its shortcomings. In fact, the main advantages of one method tend to be the limitations of another. These various ap- proaches can be classified in terms of laboratory or field studies and are best described in the context of past subjec- tive studies which have similar goals to the present work.
Two large studies were conducted in the past in which the subjects attended a series of live concerts in several halls.
In the 1971 study
by Hawkes
and Douglas,
• listeners
at-
tended live concerts and completed questionnaires consisting
of a set of 16 bipolar rating scales. The goal of that study was not to evaluate the suitability of various objective measures and so only the reverberation times of the halls (three occu- pied and one unoccupied) were described. The primary result of the study was the determination of a subset of orthogonal
subjective
parameters.
In Barron's
1988
study,
2 expert
listen-
ers attended live performances in 11 British concert halls and completed a questionnaire after each concert. His question- naire was shorter in length and was designed as a result of the findings from earlier studies. Barron correlated his sub-
jective results with a set of objective quantities measured using an omnidirectional loudspeaker in the unoccupied halls. Since the presence of an audience can have a profound effect on the acoustics of a hall and since the radiation pat- tern of an orchestra spread across a stage must obviously be different to that of a single loudspeaker placed in the middle of the stage, one can see an immediate difficulty in trying to correlate subjective and objective data under these circum- stances. The subjects listened to quite different conditions than those that were measured. This along with the influence
of various nonacoustical factors, are limitations encountered
with studies involving live concerts.
The other approach to subjective testing is to simulate the sound of a concert hall as accurately as possible in a laboratory setting. Two such studies were carried out in Ger-
many in the 1970s. In both of these studies the stimulus
consisted of dummy head recordings of music made in real
halls.
In the Grttingen
study
3 two directional
loudspeakers
were placed on stage in 25 concert halls and anechoic music was played through them and recorded via a dummy head. However, the objective measures used in that study were derived from impulse responses measured using a spark source with the dummy head as the receiver. Naturally the directional characteristic of the omnidirectional spark source must be quite different from the combined directional pattern of the loudspeakers. As well, the directional characteristics of the summed ear signals were not omnidirectional. 4 It is known that the directionality of the source and the receiver both have a profound effect on the resulting acoustic mea- sures and therefore the objective measures could not have precisely represented the sound fields that the subjects were judging. The playback system used two loudspeakers in an
anechoic chamber with steps taken to cancel the acoustic
cross-talk. In the Grttingen study, subjects were asked to compare sound fields in pairs and identify the one that they preferred.
In the Berlin
study
5-7 dummy
head
recordings
of the
294 J. Acoust. Soc. Am. 98 (1), July 1995 0001-4966/95/98(1)/294/8/$6.00 ¸ 1995 Acoustical Society of America 294Berlin Philharmonic Orchestra were made in six halls. These
recordings were played to subjects over headphoues. There are two well-known problems associated with headphone playback of dummy head recordings: in-head localization, and front/back confusion. Both of these shortcoinings imply obvious limitations in the realism of the reproduced sound fields. Also, in the Berlin study the objective measures were derived from impulse responses measured using a spark source. As with the G6ttingen study, the objective measures may not have been entirely indicative of what the subjects heard. Subjects in the Berlin study were asked to rate 19 different subjective parameters of the sound fields on a six- point bipolar scale. More comprehensive comparisons of these past studies and their results are given in papers by
Barron,
2 Beranek,
8 and
Bradley.
9
The obvious advantage of the live concert approach is realism. No laboratory study can perfectly recreate the sound experienced in an actual concert hall. Certain approximations which may bias subjective responses are inevitable in any
simulation. However, the effects of these biases can be mini-
mized by asking subjects to rate differences between sound fields rather than judgments of absolute preference. One dis- advantage with the live concert approach is that A/B com- parisons are not possible. Subjects cannot move instantly from one hall to another and often there can be periods of several days between concerts. The experimenter must rely on a subject's ability to make judgments in the context of his memory of past concerts in other halls. Furthermore, one does not usually have the opportunity to begin making judg- ments after having heard all of the concert halls to be exam- ined. Another disadvantage of field studies is that the subject cannot help but be biased by his knowledge (and preconcep- tion) of the hall's acoustic reputation. For example, listeners would naturally tend to give high ratings to Boston Sym-
phony Hall and Vienna Grosser Musikvereinsaal because of
their well-known reputations. As well, visual biases will tend to influence listener judgments.
In a laboratory study it is possible to examine: a certain parameter while holding all others constant. Also, subjects can instantly switch between sound fields to make their judg- ments. In laboratory studies, there are no changing visual biases and subjects need not be aware of which coucert halls are being used in the testing. We can overcome the limita- tions of previous laboratory studies by using the same stimu- lus throughout a test, and by using the same impulse re- sponses to derive the objective measures and to convolve
with the stimulus to create the test sounds. While field stud-
ies may be suitable for questions of absolute preference, laboratory studies are more suited to examining differences
between sound fields in detail.
I. METHOD
A series of subjective experiments was conducted using a binaural simulator system. Sound fields were produced by convolving anechoic music with binaural impulse responses captured using a binaural version of the RAMSofi-ll acoustic
measurement
system
m which uses an omnidirectional
(dodecahedron) sound source. A Bdiel & Kj•er type 4128
head and torso simulator was used in the measurements. The
(a) (b)
FIG. 1. Loudspeaker enclosures with mechanical b,'u'riers to reduce acoustic cross-talk, (a) overhead and (b) side view.
convolutions were performed on a Macintosh computer us- ing the Sound Utilities 2.0 software developed by one of the
authors.•,•2
The music
consisted
of a 15-s
passage
from
the
overture of Mozart's "Le Nozze di Figaro" (Denon anechoic orchestral music recording, PG-6006, bars l-18). A spectral analysis showed this passage to have significant energy in each of the octave bands from 63 to 4000 Hz. Subjects lis- tened to the resultant sound fields over a pair of near-field loudspeakers equipped with mechanical barriers to reduce the acoustic cross-talk. Signal processing was used in con- junction with the mechanical barriers to obtain a total of
about 30 dB of cross-tall, cancellation across the entire fre-
quency range. Furthermore, the use of near-field monitoring eliminated the need for •[n anechoic listening environment. Additional signal processing was used to equalize for the diffuse-field response of the dummy head and the loud- speaker frequency response. An illustration of the loud- speaker enclosures is giwm in Fig. 1.
All tests were in the form of double-blind paired com- parisons. The sound fields were played directly from the
computer. The playback l.•,vel of the music was set such that the average levels for the sound fields varied between 74 and
82 dB as measured at the listener's position. The stimulus was played repeatedly, thereby allowing subjects to switch back and forth between the sound fields for as long as they required in order to make their judgments. Also, the stimulus
is played continuously during switching. That is, when a sub-
ject switched between tke two sound fields in a pair, the music did not start over f:om the beginning. Rather, the mu- sic continued to play and only the listener's "position" in the hall changed. The compu :er played the pairs of sound fields in random order and automatically recorded the subjects' re- sponses. A more detailed description of the binaural simula- tor system is given in Re[. 13.
Subjects conducted eight separate listening tests and
ranked the sound fields in terms of loudness, clarity, rever- berance, bass, treble, en,,elopment, apparent source width,
and overall preference. Therefore, the subjects made their judgments based on the d7ference between two sound fields.
For example, for the loudness experiment, subjects listened to pairs of sound fields .red identified the one which they perceived to be louder. The choice of these subjective param-
eters
was based
on the questionnaire
developed
by Barron.
2
Prior to each test, a desc:iption of the parameter under test was read to the subject. Also, to ensure that they fully under-
295 d. Acoust. Soc. Am., Vol. 98, No. 1, July 1995 G.A. Soulodre and d. S. Bradley: Evaluation of new measures 295
stood their task, subjects conducted a brief training sequence prior to each test. Ten subjects participated in each of the tests. Most of the subjects had extensive musical training and all had previous experience in critical listening experiments. None of the subjects had any known hearing loss.
The binaural impulse responses were chosen from a
large database of measurements made in North American
concert halls. Since the main goal of the study was to evalu- ate the suitability of various objective measures as predictors of subjective perception, impulse responses were chosen to encompass, as much as possible, the full ranges of several objective measures. The octave-band objective measures (125-4000 Hz) of interest were reverberation time RT, early
decay time EDT, clarity C80, relative sound level G, lateral
energy fraction LF, and interaural cross-correlation IACC. Ten impulse responses were chosen so as to include a full range (as found in actual concert halls) of each of these ob- jective measures. Subjects heard each of the 45 sound field pairs only once in each of the eight listening tests. That is, none of the pairs was repeated in any given test.
There are several advantages to the method used in this study. Since subjects were asked to judge the differences between sound fields, any bias resulting from imperfections in the reproduction system would be minimized. Also, the binaural impulse responses used for the convolutions were obtained using the same technique as the monaural impulse response used to derive the acoustic measures. The impulse responses were obtained at the same time and under identical acoustic conditions. The only difference was that a dummy head was used instead of an omnidirectional microphone to measure the binaural impulse responses. Therefore it is pos- sible to make precise comparisons between subjective and objective results.
A preliminary study using only eight sound fields was carried out prior to the final study. The preliminary study was intended to verify that the process would provide meaningful results and to identify any procedural issues in the experi- ments. The results of the preliminary test are given in Ref. 14. The results of the tests involving the spatial aspects of the sound fields (i.e., envelopment and apparent source width) will be reported in a future paper.
II. LOUDNESS
In the first experiment subjects were asked to rank the ten sound fields in terms of loudness. Loudness was de-
scribed to the subjects as, "the relative strength or loudness
of the sound."
The first objective measure of loudness in halls appears
to have
been
proposed
by Yamaguchi.
•5 Lehmann
later
pro-
posed
the same
measure,
calling
it strength
indexfi
Barron
and Lee modified the measure by replacing the sound power level of the omnidirectional source by the level at a particu-
lar distance under free-field conditions. 16 This version of the
measure is given in Eq. (1). The measure is equivalent to the
difference between the sound-pressure level measured at the
receiver location and the level of the same source measured
at a distance of 10 m in an anechoic chamber:
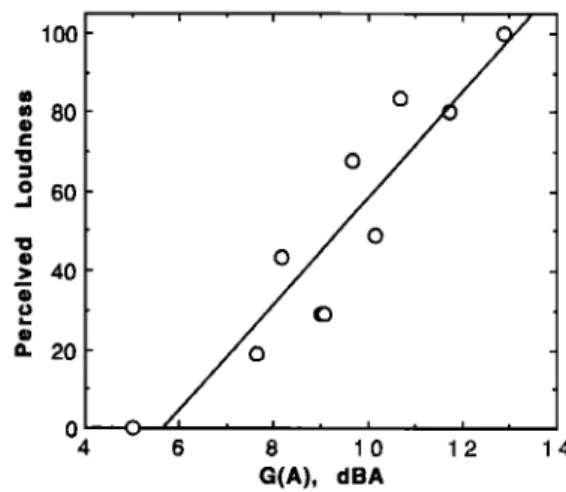
100 • 80 o, 60 g. 20 0 4 o
ø
ø
oø
o
c 6 8 10 12 G(A), dBA 14FIG. 2. Loudness ratings vs G(A). G(A) is the A-weighted value of G.
f•p2(t)dt
G: 10
log
f•p•(t)dt
(dB).
(1)
A review of the pertinent literature did not provide any
indication of how the various octave bands should be com- bined to obtain an overall value. Therefore the results of the
loudness test were correlated against various octave-band combinations of G. There was, however, no immediate jus- tification for excluding any of the octave bands from the
measure. The G values for each of the ten sound fields were
summed on an energy basis over all of the octave bands. This was found to correlate reasonably well (r = 0. 845) with the subjective perception of loudness.
The measure G, as defined in Eq. (1), considers all fre- quencies as contributing equally to the overall perception of loudness. However, it is well known that the ear's sensitivity to loudness is frequency dependent and various weightings are often used to reflect this. Therefore an A-weighted adap- tation of Eq. (l) was investigated as a predictor of the sub- jective perception of loudness. Figure 2 shows perceived
loudness ratings versus the A-weighted values of G.
It should be noted that the ratings of perceived loudness are unitless and are plotted on an arbitrary scale. A higher value along the vertical axis indicates a subjectively louder sound field. Furthermore, the subjective rankings were lin- early scaled so that the maximum possible score was 100. That is, if all subjects agreed that a particular sound field was
the loudest, then it would be given a score of 100. This was
done to make the presentation of the data clearer to the reader. This linear scaling was performed for each of the
eight subjective tests. The horizontal axis represents an
A-weighted version of Eq. (1), referred to here as G(A). As can be seen from the figure, a strong correlation was ob- tained (r=0.926) with the use of the A-weighting. It is interesting to note that the subjects were able to accurately
resolve very small differences in loudness. This demonstrates
the level of detail which can be discriminated in a laboratory
study of this nature.
The results of this subjective test indicate that
A-weighted G values are a superior predictor of the influence of concert halls on the loudness of sounds. Although includ-
296 J. Acoust. Soc. Am., Vol. 98, No. 1, July 1995 G.A. Soulodre and J. S. Bradley: Evaluation of new measures 296
ing an A-weighting in the calculation of G values is a con- ceptually simple idea, this has not been done in previous
studies.
III. CLARITY
Clarity was described to the subjects as "the clarity or definition of the sound. The ability to perceive musical de- tail. The degree to which notes are separated in titne." The concept of clarity stems from the realization that reflections arriving soon after the direct sound are integrated by the ear and contribute to the clarity or definition of the sound. Most measures of clarity consist in some way of a ratio of the early-to-late sound. Generally speaking, greater levels of early energy increase the perception of clarity while greater levels of late energy are expected to decrease clarity. The dividing point between early and late is usually chosen as 50 ms for speech and 80 ms for music. The most commonly used measure of clarity for music is C80 as proposed by
Reichardt
•7 and
defined
in Eq. (2),
f oø'øaø
p2(
t )dt
C80 =10 log •
2
(dB).
(2)
f0.080P (t)dt
One difficulty with measures of this sort is the choice of
the limits of integration. Clearly the boundary between the
early and late sound is not abrupt as suggested by F,q. (2). To avoid this problem center time TS [defined in Eq. (3)] was
proposed
as a measure
of clarity?
In practice,
one
finds
that
C80 and TS are usually highly correlated with each other:
rs=
tp2(t)dt (s).
(3)
I
The results of this second experiment were correlated against octave-band values of both C80 and TS. One diffi- culty arose in that it is not well understood how the various octave bands should be combined to give an overall measure. Many combinations of octave bands were investigated and the best correlation for both C80 and TS was obtained by summing the 500- and 1000-Hz octave bands. Correlations
of r=0.844 and 0.878 were obtained for C80 and TS, re-
spectively.
Both C80 and TS are determined by the relative levels
of the early and late sounds. The authors speculated, how-
ever, that clarity should also be related to the absolute level (loudness) of the sound. Therefore a multiple-regression analysis was performed to include both level (loudness) and C80 as predictors of clarity. The measure of loudness G(A), proposed in Sec. II of this paper, and C80 (500 and 1000 Hz) were used as the predictor variables in the regression. The result of the regression analysis is given in Eq. (4) and the resulting combination of C80 and G(A) has been termed level adjusted C80:
level adjusted C80= C80(500- 1000 Hz)
+0.62-G(A) (riB). (4)
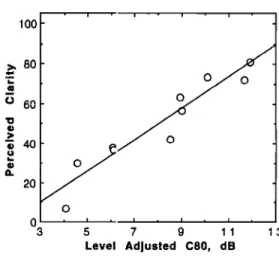
Mean perceived clarity scores are plotted versus this
level adjusted C80 combination in Fig. 3. Again, the values of perceived clarity are unitless and the scale is arbitrary.
lOO
3 5 7 9 11
Level Adjusted C80, dB
FIG. 3. Clarity ratings versus level adjusted C80, Level adjusted C80 is defined as C80(500-1000 Hz)4 0.62* G(A).
Higher values indicate greater clarity. Level adjusted C80 was found to have a strong correlation with perceived clarity
(r=0.950).
For this study, midf•equency C80 and TS were both good predictors of the •erceived clarity. However, when C80 and G(A) were combined as in Eq. (4), an even better predictor of clarity was obtained. Thus the results of this test indicate that a loudness component is also required in a mea- sure of clarity.
IV. REVERBERANCE
The reverberation tirae RT was proposed by Sabine as an important predictor of the acoustic quality of a room. In this study RT was defined as the time it takes for a sound to decay by 60 dB as measured from a straight-line fit of the decay from -5 to -30 dB. Subsequent studies have shown that a listener's judgment of reverberance correlates better
with the early
portion
of the decay.
m'2ø
This
has
resulted
in
the general acceptance cf the early decay time EDT as a better measure of subjectively perceived reverberance. EDT is defined as the time it takes for sound to decay by 60 dB as measured from a straight-line fit to the decay from 0 to - 10 dB.
In the present study, reverberance was described to the subjects as "the degree of perceived reverberation in a tem- poral sense. The blending; of one sound into subsequent fol- lowing sounds." The resrills of the subjective test were cot'- related with several objective measures of the sound decay. As expected, RT was not as good a predictor of perceived
reverberance as the other measures. When the values of RT
were averaged over all octave bands, the correlation was r=0.740 but rose slightly to r=0.799 when only the 500-
and 1000-Hz octave bands were included in the measure of
RT. It was found that EDT (averaged over all octaves) cor- related very well (r=0.971) with the perceived reverbel:-
ance. The result of this c>rrelation is shown in Fig:. 4.
Interestingly, TS, when averaged over all octaves, cor- related equally well with the perception of reverberance (r =0.977). This is not surprising since TS and EDT are often highly correlated with each other. The results of this subjec-
tive test confirm that EDT is an appropriate measure of re-
verberance and suggest trot all of the octave bands are im-
297 d. Acoust. Soc. Am., Vol. 98, No. 1, July 1995 G.A. Soulodre and d. S. Brad ey: Evaluation of new measures 297
10o o 1.o 1.5 2.0 2.5 EDT(125-4k), $ 3.0 8O 6O 4O 2O 0 -4 o
o
o
o -2 0 2 4 6 8 0Early Basa Level, dB
FIG, 4. Reverberation ratings versus values of EDT averaged over all oc-
laves.
portant to the overall perception of reverberance. This result
agrees
with Barron
2 who found
EDT averaged
over
all oc-
tave bands to be the best correlate for reverberance in his
study.
v. BASS
Bass was described to the subjects as "the strength of the bass or low-frequency sounds relative to the midfre- quency sounds." There appears to be very little work re-
ported
on appropriate
objective
measures
of bass.
Beranek
2•
proposed bass ratio as a measure of the perception of bass. Bass ratio is defined as the ratio of the low- to midfrequency RT. The results of the present study do not correlate signifi- cantly with bass ratio. This agrees with Barron's results in
which he found bass ratio to be "least well correlated with
subjective
Bass
Balance.
"2 Barron
proposed
an EDT ratio
and a TS ratio as possible measures of bass balance, but his own correlations with these measures were not very high (r = 0.35). The results of the present study were correlated against these proposed measures, but the results were only marginally better than for "bass ratio."
Analysis of the results of the present study suggests that
the perception of bass is determined at least in part by the
low-frequency content of the early sound. Specifically, the
best correlation (r=0.868) was obtained with the relative
level of the low-frequency energy in the first 50 ms which we refer to here as the early bass level. Early bass level is defined as
fo.
0O5Op2 uzl(t)dt
(125-500early bass level= 10 log • 2
-foP^
0z5-5oo
az)(
t)dt
=a•ø(125-50o Hz) (dB),
(5)
where the subscript and superscript indicate the limits of the integration used in the calculation of the early bass level.
Using the entire impulse response (i.e., the sum of G values from 125 to 500 Hz) reduced the correlation to r=0.642, thus supporting the proposition that the percep- tion of bass is predominantly influenced by the early portion
FIG. 5. Bass ratings versus early bass level. Early bass level is defined as G05ø(125-500 Hz).
of the impulse response. The results of the subjective experi- ment are plotted against values of early bass level in Fig. 5.
There are good reasons for the perceived bass response of halls to relate to the strength of the early bass sounds. The
seat
dip effect
22'23
can cause
large
attenuations
of the low-
frequency content of the direct sound and this attenuation can vary significantly from seat to seat and from hall to
hall.
24
Low-frequency
Gg
ø values
can
vary
by more
than
10
dB and hence readily explain the perceived differences in the
bass content of the test sounds.
It should be noted that the largest range (about the mean trend) of subjective judgments occurred in the bass experi- ment. A detailed analysis revealed that most of the sound fields had a pronounced dip in the low frequencies. However, the frequency at which the dip occurred varied and thus its
effect was sometimes seen in the 125-Hz octave band and other times in the 250-Hz octave band. The sound fields with
a dip in the 250-Hz octave band typically had a rise in G at 125 Hz. It is believed that the varied frequencies of these dips caused a certain degree of confusion in the subjects' perception of bass. That is, confusion occurred when a sound field with a dip in the 125-Hz band was compared to a sound field with a dip in the 250-Hz band.
It is popularly believed that long low-frequency rever- beration times are required for a strong sense of bass. The results of the present study do not support this notion. Fur- thermore, the new finding that the perception of bass is re- lated to the early sound suggests that the expensive massive constructions required to obtain long low-frequency RTs may not be the most important factor for achieving strong bass in concert halls. It may be at least equally important to provide early low-frequency energy by using appropriate reflecting
surfaces.
VI. TREBLE
The lack of information regarding treble is even greater than for bass. The authors were unable to find any literature
regarding an objective measure of treble. In the present study, treble was described to the subjects as "the strength of the treble or high-frequency sounds relative to the midfre-
298 J. Acoust. Soc. Am., VoL 98, No. 1, July 1995 G.A. Soulodre and J. S. Bradley: Evaluation of new measures 298
100
80...
•O•
60
O
40
o o
20 -9 -8 -7 -6 -5 -4 Treble Ratio, dBFIG. 6. Treble ratings versus treble ratio. Treble ratio is defined as G•0(4 kHz)-G•0(l-2 kHz).
quency sounds." The results of this test were correlated against various measures based on the findings in the bass experiment. Strong correlations (r=0.863, 0.843, and 0.926) were obtained using high-to-midfrequency ratios of RT, EDT, and TS. Here the high frequencies consisted of the 4000-Hz octave band while the midfrequencies were the av- erage of the 1000- and 2000-Hz octave bands. Treble was also found to be correlated with the temporal distribution of the high frequencies. Specifically, treble was found to be related to the high-frequency content of the late arriving sound. The best correlation (r= 0.966) was obtained by tak- ing the ratio of the high to midfrequencies of the late sound energy. The ]ate sound was taken to be everything arriving more than 80 ms after the direct sound. This measure will be referred to as the treble ratio and is defined in Eq. (6). The subjective results of the treble test are plotted against treble ratio in Fig. 6:
f•.080P•4
km)(t)
dt
treble
ratio=
10
log
f•.080P•
2 mz)(t)
dt
=G8•0(4 kHz)-Gs•0(1-2 kHz) (dB).
(6) When the early portion of the impulse response was in- cluded with the late portion, the correlation dropped dramati- cally to r=0.070. This clearly demonstrates that it is the late arriving sound that determines the perception of treble
differences between sound fields. It seems reasonable that
the perception of treble should be related to the high- frequency content of the late sound in concert halls. Large differences in the high-frequency content of the late sound are to be expected due to large differences in the absorption of the various surfaces at 4000 Hz. Also, the absorption due to the air is significant at 4000 Hz and therefore the volume
of the hall will directly affect the high-frequency content of the late sound. Listeners are therefore likely to base their
judgments on these differences in the late sound given that they will tend to be larger than the differences in the early sound.
TABLE I, Correlafions between vations subjective parameters and overall preference. Numbers in bold type are statistically significant (p<0.01).
Loudness Clarity Reverberance Bass Treble
0.447 0.726 -0.199 0.113 0.811
VII. PREFERENCE
As a final experiment:, listeners were asked to rank the ten sound fields in terms •f preference. As explained in the: Introduction, preference judgments are susceptible to biases due to any limitations of the simulation system. However, the binaural simulation procedure was not thought to have sig-- nificant limitations and prfference judgments were analyzed to determine the factors influencing preference. Table I
shows the correlations between the various subjective param-
eters already described and overall preference.
As can be seen from the table, only clarity and treble correlate significantly with the subjects' overall preference. (Envelopment and apparent source width, though not de-- scribed in this paper, did not correlate significantly with pref-- erence.) The high correlation between clarity and preference•
agrees
with
the
results
of •:he
Berlin
study
7 where
they
found
clarity to be the most significant factor for some subjects. The strong positive correl•tion between treble and preference may be influenced by the background of the subjects em- ployed in this study. Most of the subjects were graduate stu.- dents in training as recording engineers. It is possible that they would prefer sound fields with a more extended high.- frequency bandwidth as is typical in modern recordings of orchestral music. Finally, t should be stressed that with only ten subjects, one must be cautious not to try to interpret too much from the results of a preference experiment.
It was also of interes• to examine whether any intercor.-
relations existed among the other subjective parameters. As such, the subjective results from the loudness, clarity, rever--
berance, bass, and treble tests were correlated with each
other. The results showec[ that the only significant (though weak) correlation was bet'•een clarity and reverberance (r:: -0.7 7). The lack of correlation confirms that these five sub- jective parameters do indeed describe different aspects of the
sound fields. This result a so indicates that the listeners were
able to successfully discri•ninate between the various subjec-
tive dimensions.
VIII. CONCLUSIONS
A series of subjective experiments were conducted to evaluate various objective measures as predictors of subjec- tive ratings of various aspects of concert hall sound fields New objective measures or modifications of existing mea- sures were found that were good predictors of each subjec- tive rating. In most cases these new measures provide some insight into the question of the relative importance of the
different octave bands to the overall measures of each sub- jective rating.
Loudness ratings were significantly related to overall G values, but were more strongly correlated with A-weighted G
299 J. Acoust. Soc. Am., Vol. 98, No. 1, July 1995 G.A. Soulodre and d. S. Bradl,;y: Evaluation of new measures 299
values. Although not previously considered. the simple addi- tion of an A-weighting response considerably improved the relationship with perceived loudness ratings.
Clarity was found to correlate well with midfrequency values of both C80 and TS. As a result of this study, the addition of the relative sound level [represented by G(A)] was found to significantly improve the prediction of clarity ratings. A new measure that combined these quantities, termed level adjusted C80, has been proposed as a predictor of clarity. This level adjusted clarity is a first attempt to include the effects of both overall loudness and the relative balance between the early and late arriving sound energy as predictors of clarity.
The results of the present study support the generally accepted importance of EDT as a predictor of subjective re-
verberance. It is not clear from the literature how the EDT
values t¾om the six octave bands should be combined to give a single overall measure of reverberance. One common prac- tice is to quote only midfrequency RT and EDT values to characterize reverberance in a hall. The results of the present study indicate that the EDT values from all six octave bands contribute to the perceived reverberance and should therefore be included in the overall measure. In this study ratings of reverberance were also found to be strongly correlated with TS values which are traditionally associated with clarity.
There has been little previous work to determine mea- sures related to the perceived strength of the bass and treble aspects of sound fields in concert halls. Previous objective measures appear to be limited to Beranek's bass ratio, as well as the EDT and TS ratios suggested by Barron. In the present study, judgments of bass did not correlate well with any of these measures. The present findings indicate that the low- frequency content of the early sound (first 50 ms) is the dominant factor influencing the perception of bass. As a re- sult, the early bass level was proposed as a measure of per-
ceived bass in concert halls.
Significant correlations were found between subjective ratings of treble and high-to-midfrequency ratios of EDT, RT, and in particular TS. The perception of treble was found to be predominantly related to the 4000-Hz octave-band measures. This may in part explain why Barron was unable to find an objective correlate for treble in his study since his
objective
data
did not include
the 4000-Hz
octave
band.
2 A
new finding of the present study is that the perception of treble is determined primarily by the high-frequency content of late arriving sound. Because of this, the treble ratio mea- sure (of the late sound energy) has been proposed as a mea- sure of perceived treble.
Preference judgments were found to correlate with both clarity and treble. The subjects' preference for increased treble may be influenced by their expectations as a result of
their background.
The new results have several direct implications to the design of concert halls. Because loudness judgments were related to A-weighted G values, the low-frequency absorbing properties of a hall will not strongly influence the loudness of sounds. Perceived clarity was related to midfrequency C80 values and G(A). This suggests that relatively small
reflecting surfaces can be used to provide increased early
reflections that will increase perceived clarity in a hall. While loudness and clarity do not seem to require increased low- frequency sound, one must consider low-frequency sounds to influence perceived reverberance and bass. Reverberance was best related to EDT averaged over the six octaves from
125 to 4000 Hz. Thus for reverberance it is desirable to have
sufficiently long EDT values in all bands. Designing for an equivalent RT and ensuring a reasonably diffuse sound field should lead to the desired EDT values.
Perceived treble was related to the late arriving high- frequency sound energy. Thus for adequate treble it is impor- tant to minimize porous absorbing material as well as the room air absorption. Although increased reverberation times at low frequencies are normally recommended, the new re-
sults here indicate that it is also important to maximize the
level of low-frequency early sound energy. This requires a design which minimizes the attenuation caused by the seat dip effect. The inclusion of early arriving reflections contain- ing low-frequency energy that arrive from nongrazing angles can help to minimize the seat dip attenuation and hence to increase the perception of bass in a hall.
This paper presents the results of a first look at several subjective parameters which describe sound fields in concert halls. Although the results point to several new objective measures, each subjective parameter requires more extensive study in order to determine the most suitable predictor.
ACKNOWLEDGMENTS
The authors would like to thank the Concert Hall Re-
search Group for partial support of this project. The authors would also like to thank Dale Stammen for his help in con- ducting some of the subjective tests. The first author is funded by a grant from the Social Sciences and Humanities
Research Council of Canada.
I R. J. Hawkes and H. Douglas, "Subjective acoustic experience in concert auditoria," Acustica 24. 235-250 (197 l).
2M. Barron. "Subjective study of British symphony concert halls," Acus-
tica 66, 1-14 (1988).
M. R. Schroeder, D. Gottlob. and K. E Siebrnsse, "Comparative study of
European concert halls: Correlation of subjective preference with geomet-
ric and acoustic parameters," J. Acoust. Soc. Am. 56, 1195-1201 0974).
D. Gottlob, "Comparison of objective acoustic parameters in concert halls
with results of subjective experiments," dissertation, English translation by M. Barron, Gruingen, 1973.
SH. Wilkens, "Mehrdimensionale beschreibung subjekfiver beurteilungen
der akustik yon konzerts/ilen," dissertation. TU Berlin, 1975.
6p. Lehmann. "0her die ermittlung raumakustischer kriterien und deren
zusammenhang reit subjektiven beuneilungen der h6rsamkeit." disserta-
tion, TU Berlin, 1976.
7p. Lehmann and H. Wilkens. "The connection between subjective judg- ments of concert halls and criteria of room acoustics," Acustica 45, 256-
268 (1980).
aL. L. Beranek, "Concert hall acoustics--1992." J. Acoust. Soc. Am. 92.
1-39 0992).
oj. S. Bradley, "Contemporary approaches to evaluating auditritium acous-
tics," Proceedings of the AES 8th International Conference, the Sound of Audio, Washington. May 1990, pp. 59-69.
mR. E. Halliwell and J. S. Bradley, "RAMSoft 1I: A computer based room acoustics measurement system," J. Acoust. Soc. Am. 89. 1897{Al (19911. IIG. A. Soulodre and D. R. Staremen. "A binaural recording and playback
system for the reproduction of virtual concert halls," Proceedings of the International Comp. Music Conference, Tokyo, 1993.
12D. R. Staremen and G, A. Soulodre, "SOUND UTILITIES 2.02 A software 300 J. Acoust. Soc. Am., Vol. 98, No. 1, July 1995 G.A. Soulodre and d. S. Bradley: Evaluation of new measures 300
system for creating virtual acoustic spaces." Proceedings of the Interna-
tional Comp. Music CantOrenee, Denmark, 1994.
13G. A. Soulodre and D. R. Srammen, "A binaural simulator for conducting
subjective studies of concert hall acoustics," Proceedings of the Sabine Centennial Symposium, Cambridge, MA, 1994, pp. 267-270.
14G. A. $oulodre and i. S. Bradley. "A subjective evaluation of new acous- tic measures in concert halls using binaural simulation," Proceedings of the Sabine Centennial Symposium, Cambridge, MA, 1994, pp. 271-274.
K. Yamaguchi, "Multivariate analysis of subjeclive and physical measures
of hall acoustics," .1. Acoust. Sac. Am. 52. 1271-1279 (1972).
m6M. Barron and L.-J. Lee, "Energy relations in concert auditoriums. l," J. Acoust. Sac. Am. 84, 618-628 (1988).
•7W. Reichardt. O. Abdel Alim, and W. Schmidt, "Definition and basis of making an objective evaluation to distinguish between useful and useless
clarity defining musical performances." Acustica 32, 126-137 (1975).
I•L. Cremer and H. A. Milllet. Principles and Applications of Room Acous-
tics. English translation by T. J. Schultz (Applied Science. Essex. England.
1982), Vol. I.
IøR. H. Bolt and P. E. Doak, "Tentative criterion for the short-term transient
response o1' auditorium," J. Acoust. Sac. Am. 22, 507-509 (1950).
2oB. S. Atal. M. R. Schroeder. and G. M. Sessler. "Subjective reverbcra6on time and its relation to •ound decay." Proc. 51h Int. Congr. Acoust. lb. G32 (1965).
•'L. L. Beranek. Music, Acoustics and An'hitecture (Wiley, New York,
1962).
22T. J. Schultz and B. G. Watters, "Propagation of sound across audience
seating," I. •coust. Soc. Am. 36. 885-896 (1964).
23G. M. Sesster and J. E. West, "Sound transmission over theater seats." .I.
Acoust. Soc. Am. 36, 1725-1732 {1964).
•4j. S. Bradley, "Some further investigations of the seat dip effect." J.
Acoust. Soc, Am. 90, 324-333 (1988).
$01 J. Acoust. Soc. Am., Vol. 98, No. 1, July 1995 G.A. Soulodre and J. S. Bradley: Evaluation of new measures 301