Figure S1. Bayesian phylogenetic tree constructed in Mr. Bayes based on mtDNA d-loop
sequence.
Numbers are posterior probabilities. Blue are Mus musculus musculus subspecies;
orange are M. m. castaneus; red are M. m. domesticus with each region defined by a two or three
letter code. Ge: Georgia, Ir: Iran, Sp: Spain, En: England, Fr: France, Ca: Cameroon, Ger:
Germany, Sc: Scotland, Ire: Ireland, Gr: Greece, Au: Austria, Sw: Switzerland, Eg: Egypt, Tu:
Turkey, Mo: Morocco, Un: United States, Po: Portugal, Is: Israel, Pe: Peru, It: Italy, Cr: Croatia,
No: Norway, De: Denmark, Swe: Sweden.
A
C
B
D
Figure S2. Principal coordinate analysis of 21 microsatellite loci. A.) Axis 1 and Axis 2 for all
popualtions. B.) Axis 3 and Axis 4 for all populations. C.) Axis 1 and Axis 2 for just the
Figure S3. Posterior Density Distributions of the main model. Black lines indicate the prior distribution and the red lines indicate the posterior density
distributions.
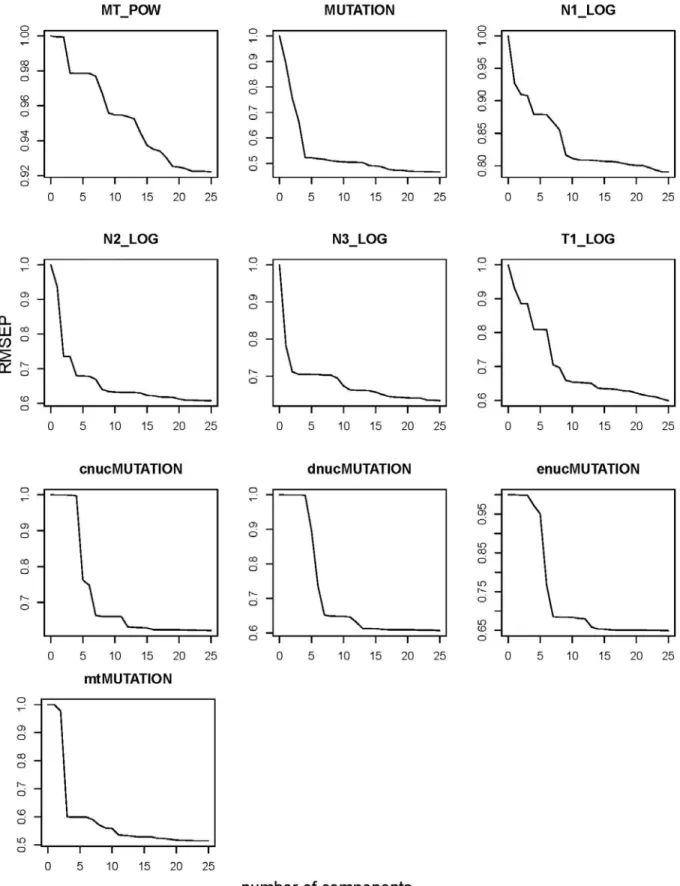
Figure 4. Root Mean Squared Error (RMSE) plots of partial least squared components for each
parameter inferred in the main demographic model.
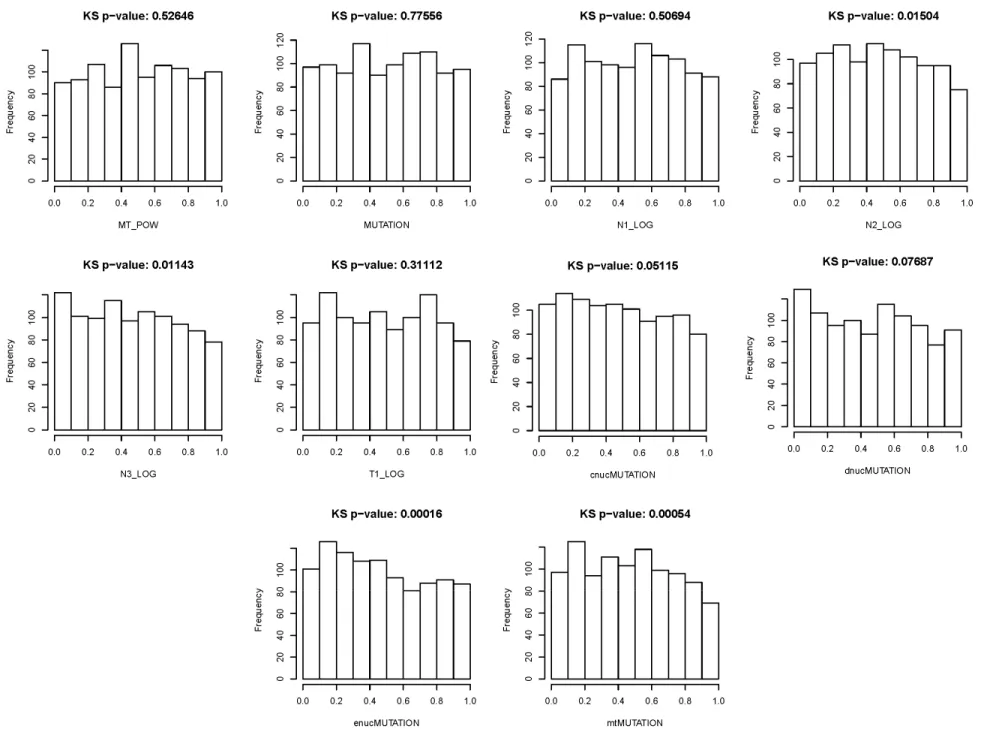
Figure S5. Distributions of the posterior quantiles for the parameters inferred in the main model of the ABC analysis. Values above the histograms
are Kolmogorov-Smirnov test p-values.
Figure S6. Posterior Density Distributions of Variation 1 model. Black lines indicate the prior distribution and the red lines indicate the posterior
density distributions.
Figure S7. Posterior Density Distributions of Variation 2 model. Black lines indicate the prior distribution and the red lines indicate the posterior
density distributions.
Table S1. European samples included in the study.
Sample
Locality
D‐loop
haplotype Publication/Contributor GERMANY
MU205
Dortmund
MU205 S. Gabriel et al. unpublished
MU206
Dortmund
MU206 S. Gabriel et al. unpublished
MU212
Munster‐Gievenback
MU212 S. Gabriel et al. unpublished MU213
Munster‐Gievenback
MU213 S. Gabriel et al. unpublished MU209
Hamm (in Westfalen)
MU209 S. Gabriel et al. unpublished ENGLAND
SA
Steeple Ashton, nr. Trowbridge,
Wiltshire
BritIsl.1 Searle et al. 09 PRS 276,201
52
Bristol
BritIsl.2 Searle et al. 09 PRS 276,201
MVZ162564
Culham College, Abingdon, Oxfordshire MVZ162564 S. Gabriel et al. unpublished MVZ162565
Culham College, Abingdon, Oxfordshire MVZ162565 S. Gabriel et al. unpublished EnLa1
Preston St Mary, nr. Lavenham, Suffolk EnLa1 Jones et al. submitted EnSB1
Sowerby Bridge, Yorkshire EnSB1 Jones et al. submitted EnTo1
Todmorden, Yorkshire
EnTo1 Jones et al. submitted 670M
Epworth, Lincolnshire
BritIsl.5 Searle et al. 09 PRS 276,201 Hesl
Heslington, near York
BritIsl.9 Searle et al. 09 PRS 276,201
York, Cara
York
BritIsl.1 Searle et al. 09 PRS 276,201
SCOTLAND
2
West Canisbay, Caithness BritIsl.17 Searle et al. 09 PRS 276,201 83
Mains of Olrig, Caithness partial Searle et al. 09 PRS 276,201 117
Dunnet, Caithness
partial Searle et al. 09 PRS 276,201 119
John o'Groats, Caithness BritIsl.31 Searle et al. 09 PRS 276,201 121
John o'Groats, Caithness partial Searle et al. 09 PRS 276,201 SPAIN
98
Viladecans, near Barcelona partial Gunduz 1999 PhD thesis 115
Viladecans, near Barcelona BARC 9 Johannesdottir et al. submitted 121
St Marti Sarroca, near Barcelona partial Gunduz 1999 PhD thesis 125
St Marti Sarroca, near Barcelona BARC 2 Johannesdottir et al. submitted 132
Garraf, near Barcelona
BARC 12 Johannesdottir et al. submitted SP1
Villamartin,Andalusia
SP1 Sofia Gabriel/ Jeremy Searle SP30
Chiclana de la Fontera,Andalusia SP30 Sofia Gabriel/ Jeremy Searle SP66
Algeciras,Andalusia
SP66 Sofia Gabriel/ Jeremy Searle SP82
Palos de la Frontera,Andalusia SP82 Sofia Gabriel/ Jeremy Searle SP106
Doñana,Andalusia
SP106 Sofia Gabriel/ Jeremy Searle IRELAND
ETL15
Tullamore,County Offaly ETL15 Eleanor P Jones/JeremySearle ECG5
Clonmel ,County Tipperary ECG5 Jones et al 2011
EBFt3
Blarney ,County Cork
EBFt3 Jones et al 2011
EBD5
Blarney ,County Cork
EBD5 Jones et al 2011
EBE6
Blarney ,County Cork
EBE6 Eleanor P Jones/JeremySearle ELR4
Letterkenny,County Donegal ELR4 Eleanor P Jones/JeremySearle ETM4
Tullamore,County Offaly ETM4 Eleanor P Jones/JeremySearle ERC10
Rathdrum ,County Wicklow ERC10 Jones et al 2011
ECJ3
Clonmel ,County Tipperary ECJ3 Jones et al 2011
EBD6
Blarney ,County Cork
EBD6 Eleanor P Jones/JeremySearle FRANCE
FrCs2
Calais,Pas‐de‐Calais
FrCs2 Jones et al 2011
FrFe2
Fecamp,Haute‐ Normandie FrFe2 Jones et al 2011
FrCn1
Caen,Basse‐Normandie
FrCn1 Eleanor P Jones/Jeremy Searle
FrAb9
Abbeville,Picardie
FrAb9 Jones et al 2011
FrSM1
Saint Malo,Bretagne
FrSM1 Eleanor P Jones/ Jeremy Searle PORTUGAL
PT38
Vila Franca de Xira
PT38 Sofia Gabriel / Daniel Förster / Jeremy Searle PT46
Sines
PT46 Sofia Gabriel / Daniel Förster / Jeremy Searle PT57
Figueira da Foz
PT57 Sofia Gabriel / Daniel Förster / Jeremy Searle PT67
Porto
PT67 Sofia Gabriel / Daniel Förster / Jeremy Searle
PT80
Tavira
PT80 Sofia Gabriel / Daniel Förster / Jeremy Searle
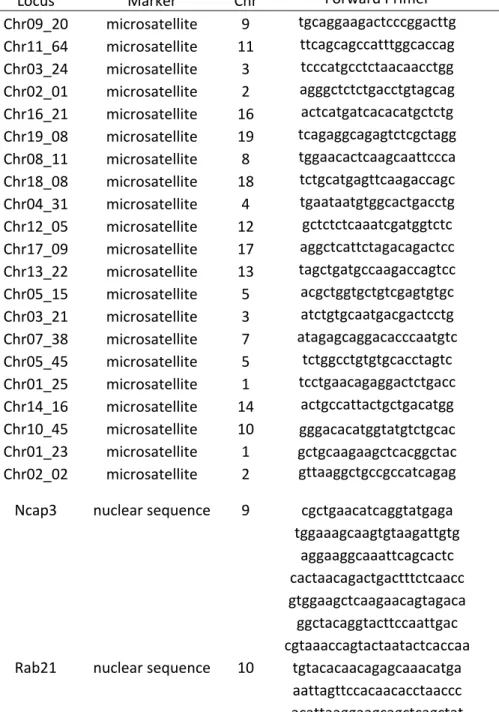
Table S2. Genetic marker characteristics, primers, and reference sequence location.
Locus
Marker
Chr
Forward Primer Reverse Primer
2011 Ref seq Ref Seq Size Dye pool Motif
Chr09_20
microsatellite
9
tgcaggaagactcccggacttg agactccacttgggacaactgc
106198465 210 FAM 1 AC
Chr11_64
microsatellite
11
ttcagcagccatttggcaccag agctacatagtgaggcactgtc
57516759 329 HEX 1 GT
Chr03_24
microsatellite
3
tcccatgcctctaacaacctgg acgtcttgataggcatctgtgc
122426201 389 FAM 1 AG
Chr02_01
microsatellite
2
agggctctctgacctgtagcag tgagttcaagtccacactggtc
25427463 481 HEX 1 AG
Chr16_21
microsatellite
16
actcatgatcacacatgctctg taagaggccacccagctacctg
30268016 209 FAM 2 AC
Chr19_08
microsatellite
19
tcagaggcagagtctcgctagg agttgtggctccgcccggtgtc
36737261 278 HEX 2 AC
Chr08_11
microsatellite
8
tggaacactcaagcaattccca tagctcccaaggacagttgacg
23410531 364 FAM 2 GT
Chr18_08
microsatellite
18
tctgcatgagttcaagaccagc gctagagcaggacctccattgg
20509056 444 HEX 2 AC
Chr04_31
microsatellite
4
tgaataatgtggcactgacctg agagataaggccagccattctg
14167775 134 FAM 3 AG
Chr12_05
microsatellite
12
gctctctcaaatcgatggtctc ctttcatggtaccagaaggctc
70936323 172 HEX 3 AC
Chr17_09
microsatellite
17
aggctcattctagacagactcc acaagggtcggctgtgtgtctg
35193776 239 FAM 3 AG
Chr13_22
microsatellite
13
tagctgatgccaagaccagtcc agtctctccagacagcactacc
64159864 353 HEX 3 AC
Chr05_15
microsatellite
5
acgctggtgctgtcgagtgtgc ctccgagtgtcccaaggctgac
113773172 140 FAM 4 GT
Chr03_21
microsatellite
3
atctgtgcaatgacgactcctg ccgctactgatgacgaccagtg
131563768 192 HEX 4 GT
Chr07_38
microsatellite
7
atagagcaggacacccaatgtc ggtgtgtgccaccactgtccag
108932186 137 FAM 5 AC
Chr05_45
microsatellite
5
tctggcctgtgtgcacctagtc acaatgcttggtgactgtggtg
22613534 204 HEX 5 AC
Chr01_25
microsatellite
1
tcctgaacagaggactctgacc gctagactgatactttccgacttagc 143737780 327 FAM 5 AC
Chr14_16
microsatellite
14
actgccattactgctgacatgg gacatcggtgtgagccatctgc
122467400 477 HEX 5 GT
Chr10_45
microsatellite
10
gggacacatggtatgtctgcac tacagtgcttctccgactaagg
128924346 230 HEX 6 AG
Chr01_23
microsatellite
1
gctgcaagaagctcacggctac agtgtcacgtcatccaggccag
134957479 278 FAM 6 TC
Chr02_02
microsatellite
2
gttaaggctgccgccatcagag agcctgacaacctggaacccac
94438926 218 HEX 7 GT
Ncap3
nuclear sequence
9
cgctgaacatcaggtatgaga aggtgtaatagcttcagggaatagt 27034502 2216 PCR tggaaagcaagtgtaagattgtg ggccacttctttgtgaaagtct
27034604 2015 PCR aggaaggcaaattcagcactc gcatgaagctcaagtgtacaaaga SEQ cactaacagactgactttctcaacc aagtcctagattgtaagatcaacca SEQ gtggaagctcaagaacagtagaca ttcccttcacgtcatggt
SEQ ggctacaggtacttccaattgac ctggacaataatctcatgtcagaa SEQ cgtaaaccagtactaatactcaccaa agcccttcgtcaaatatagga
PCR Rab21
nuclear sequence
10
tgtacacaacagagcaaacatga aaaataagtcacctgtgaactttcc 115298895 1962 PCR aattagttccacaacacctaaccc gtagttgtcctctacctgaggttc
SEQ
acattaaggaagcagctcagctat SEQ
cttcctttaccaggtgaaatcttg SEQ ggtatcactaactggccactttct caggatgagttcctgtgtgac
SEQ Mamdc2
nuclear sequence
19
gcatcaaatctagttctctgtggg tttctttcatgtagccagtgcttt
23443226 2278 PCR gttactaacagtgtgaggcctgg tctacagatccaagtctcaacgg
23443329 2057 PCR
ggcagtttaccagctatgtagag SEQ
agctggtgatgtctgggtc tctctcctttactatgccaacctt
SEQ caaagtagctcttcctcataaatgagt tctgggaggaagaacaaactaaac SEQ
tttcctacttatcgaagtaggtgac SEQ
cacacagagagagaaacacaatga atgtgtgccagctgctgtact
SEQ d‐loop1a
mitochondria
ataaacattactctggtcttgtaaac cctgaagtaagaaccagatg
15300 508 PCR
Table S3. Summary Statistics and Partial Least Squared components calculated in the approximate Bayesian computation analysis.
Summary Statistic
Marker
Observed
max min PLS1 PLS2 PLS3 PLS4
PLS5 PLS6 PLS7 Description
K_1
microsatellite
7.905
41.000 1.095 ‐0.181 ‐0.042 0.030 ‐0.100
0.002 ‐0.017 0.034 Average number of alleles across microsatellite loci in pop 1 K_2
microsatellite
13.667
41.286 1.667 ‐0.119 0.148 0.072 ‐0.058
0.004 ‐0.012 ‐0.012 Average number of alleles across microsatellite loci in pop 2 Ksd_1
microsatellite
3.097
6.715 0.000 ‐0.175 ‐0.044 0.026 ‐0.080
‐0.002 ‐0.012 0.055 stdev of average number of alleles across microsatellite loci in pop 1
Ksd_2
microsatellite
3.322
7.309 0.463 ‐0.114 0.139 0.070 ‐0.056
0.003 ‐0.011 ‐0.008 stdev of average number of alleles across microsatellite loci in pop 2
mean_K
microsatellite
10.786
38.714 1.690 ‐0.159 0.100 0.066 ‐0.085
0.004 ‐0.016 0.005 Average of K as shown above for both populations
sd_K
microsatellite
4.074
28.217 0.000 0.008 0.188 0.059 0.022
0.002 0.002 ‐0.042 stdev of K as shown above for both poulations
tot_K
microsatellite
14.857
57.048 1.905 ‐0.127 0.140 0.072 ‐0.069
0.004 ‐0.014 ‐0.013 Average of total number of alleles across loci for the two populations combined
H_1
microsatellite
0.704
0.970 0.002 ‐0.180 ‐0.060 0.020 ‐0.055
0.001 ‐0.009 0.075 Average expected Heterozygosity across microsatellite loci for pop 1 H_2
microsatellite
0.869
0.978 0.144 ‐0.119 0.146 0.072 ‐0.060
0.003 ‐0.012 ‐0.009 Average expected Heterozygosity across microsatellite loci for pop 2 Hsd_1
microsatellite
0.176
0.276 0.000 0.102 0.011 ‐0.018 0.109
‐0.004 0.017 0.038 stdev of average expected Heterozygosity across microsatellite loci for pop 1 Hsd_2
microsatellite
0.047
0.257 0.005 0.115 ‐0.142 ‐0.069 0.059
‐0.004 0.013 0.009 stdev of average expected Heterozygosity across microsatellite loci for pop 2
mean_H
microsatellite
0.786
0.971 0.117 ‐0.188 0.005 0.043 ‐0.068
0.000 ‐0.011 0.055 average of H as shown above for both populations
sd_H
microsatellite
0.117
0.671 0.000 0.131 0.140 0.020 0.037
‐0.001 0.007 ‐0.079 stdev of H as shown above for both populations
tot_H
microsatellite
0.818
0.976 0.138 ‐0.179 0.048 0.056 ‐0.076
0.001 ‐0.013 0.034 Average expected heterozygosity across loci for the two populations combined
GW_1
microsatellite
0.645
1.048 0.078 0.134 ‐0.054 ‐0.028 ‐0.120
0.004 ‐0.017 ‐0.163 average Garza and williamson statistic across loci for pop 1 GW_2
microsatellite
0.816
1.000 0.360 0.115 ‐0.142 ‐0.073 0.058
‐0.003 0.013 0.009 average Garza and williamson statistic across loci for pop 2 GWsd_1
microsatellite
0.206
0.685 0.000 ‐0.080 0.021 0.011 0.105
‐0.008 0.013 0.167 stdev of average of Garza and williamson statistic for pop 1
GWsd_2
microsatellite
0.182
0.239 0.000 ‐0.070 0.081 0.055 ‐0.051
‐0.007 ‐0.008 0.016 stdev of average of Garza and williamson statistic for pop 2
mean_GW
microsatellite
0.730
1.000 0.241 0.139 ‐0.110 ‐0.054 ‐0.056
0.002 ‐0.007 ‐0.106 average of GW as listed above for both populations
sd_GW
microsatellite
0.121
0.447 0.000 ‐0.013 0.148 0.040 0.090
‐0.002 0.014 0.038 stdev of average GW as listed above for both populations
tot_GW
microsatellite
0.851
1.000 0.368 0.094 ‐0.157 ‐0.072 0.028
‐0.001 0.008 0.005 average GW across loci for the two populations combined NGW_1
microsatellite
0.467
1.000 0.012 ‐0.060 ‐0.182 ‐0.045 ‐0.043
0.000 ‐0.007 0.050 average new/adjusted Garza and williamson statistic across loci for pop 1
NGW_2
microsatellite
0.800
1.000 0.358 0.129 ‐0.110 ‐0.069 0.096
‐0.005 0.022 0.018 average new/adjusted Garza and williamson statistic across loci for pop 2
NGWsd_1
microsatellite
0.203
0.313 0.000 0.012 ‐0.143 ‐0.035 0.013
‐0.010 0.010 0.032 stdev of average of new/adjusted Garza and williamson statistic for pop 1
NGWsd_2
microsatellite
0.185
0.254 0.000 ‐0.041 0.023 0.030 ‐0.067
‐0.001 ‐0.014 ‐0.002 stdev of average of new/adjusted Garza and williamson statistic for pop 2
mean_NG W
microsatellite
0.633
0.986 0.193 ‐0.012 ‐0.189 ‐0.061 ‐0.013
‐0.002 ‐0.001 0.052 average of NGW as shown above for both populations sd_NGW
microsatellite
0.235
0.587 0.000 0.115 0.145 0.021 0.073
‐0.003 0.015 ‐0.045 stdev of average NGW as shown above for both populations R_1
microsatellite
13.381
112.238 1.000 ‐0.191 0.015 0.040 ‐0.023
0.001 ‐0.007 0.095 average range in allele size across loci for pop 1 R_2
microsatellite
17.143
115.952 1.000 ‐0.120 0.148 0.073 ‐0.060
0.003 ‐0.013 ‐0.011 average range in allele size across loci for pop 2 Rsd_1
microsatellite
11.124
48.790 0.000 ‐0.172 0.042 0.043 0.013
0.000 ‐0.002 0.113 stdev of average range in allele size across loci for pop 1 Rsd_2
microsatellite
9.350
45.380 0.000 ‐0.118 0.143 0.074 ‐0.061
0.003 ‐0.014 ‐0.007 stdev of average range in allele size across loci for pop 2
mean_R
microsatellite
15.262
114.095 1.094 ‐0.154 0.116 0.068 ‐0.060
0.003 ‐0.013 0.021 average of R as shown above for both populations
sd_R
microsatellite
2.660
67.514 0.000 0.029 0.183 0.059 ‐0.016
0.004 ‐0.006 ‐0.076 stdev of average of R as shown above for both populations
tot_R
microsatellite
17.857
117.524 0.905 ‐0.123 0.145 0.074 ‐0.065
0.004 ‐0.014 ‐0.011 average of the total range in allele size across loci of the populations combined
FIS
microsatellite
0.291
0.570 0.028 0.126 0.109 0.018 ‐0.032
0.000 ‐0.001 ‐0.141 average Fis across loci of populations combined
FST
microsatellite
0.099
0.773 ‐0.011 0.142 0.120 0.024 ‐0.017
‐0.003 0.000 ‐0.127 average Fst across loci of populations combined
FIT
microsatellite
0.360
0.867 0.027 0.141 0.121 0.023 ‐0.017
‐0.002 0.001 ‐0.133 average Fit across loci of populations combined
RST_2_1
microsatellite
0.101
0.774 ‐0.008 0.142 0.120 0.024 ‐0.017
‐0.003 0.000 ‐0.127 average Rst between loci between population 1 and 2 DMUSQ_2_ 1
microsatellite
3.946
1145.890 0.004 ‐0.017 0.169 0.065 ‐0.049
0.006 ‐0.013 ‐0.074 average Dmu across loci between population 1 and 3 XPi_1
microsatellite
656.963
9970.960 ‐ 1.00E+1 0 0.044 ‐0.054 ‐0.023 0.001
‐0.013 0.003 0.038 sum of the variance in allele size across loci within pop1
XPi_2
microsatellite
683.477
9985.970 ‐ 1.00E+1 0 0.044 ‐0.054 ‐0.022 0.002
‐0.012 0.004 0.039 sum of the variance in allele size across loci within pop 2
XPi_1_2
microsatellite
745.646
9873.910 ‐ 1.00E+1 0 0.044 ‐0.054 ‐0.023 0.001
‐0.013 0.003 0.038 sum of the variance in allele size across loci between pop1 and 2
K_1
mtDNA
3.000
48.000 2.000 ‐0.043 0.000 ‐0.209 ‐0.156
0.001 ‐0.024 ‐0.100 number of haplotypes for pop 1
K_2
mtDNA
22.000
39.000 2.000 ‐0.043 0.104 ‐0.203 0.051
‐0.006 0.015 0.036 number of haplotypes for pop 2
Ksd_1
mtDNA
0.250
0.577 0.000 ‐0.051 ‐0.098 ‐0.065 ‐0.163
0.003 ‐0.024 ‐0.057 stdev of the number of alleles across bp. for pop 1 Ksd_2
mtDNA
0.315
0.577 0.000 0.035 ‐0.086 0.038 ‐0.177
0.006 ‐0.034 ‐0.129 stdev of the number of alleles across bp. for pop 2
mean_K
mtDNA
12.500
42.500 2.000 ‐0.047 0.072 ‐0.229 ‐0.028
‐0.003 0.000 ‐0.013 average of the number of haplotypes across both populations
sd_K
mtDNA
13.435
26.163 0.000 ‐0.017 0.112 ‐0.090 0.162
‐0.005 0.028 0.122 stdev of average number of haplotypes across both populations
tot_K
mtDNA
24.000
85.000 3.000 ‐0.040 0.078 ‐0.227 ‐0.025
‐0.003 0.000 ‐0.017 total number of haplotypes in the whole sample set H_1
mtDNA
0.112
0.997 0.038 ‐0.050 ‐0.018 ‐0.186 ‐0.168
0.000 ‐0.029 ‐0.110 gene diversity in pop 1 H_2
mtDNA
0.935
1.000 0.051 ‐0.041 0.097 ‐0.195 0.050
‐0.004 0.016 0.045 gene diversity in pop 2 Hsd_1
mtDNA
0.015
0.294 0.000 ‐0.068 ‐0.095 ‐0.083 ‐0.154
0.002 ‐0.026 ‐0.038 stdev of expected heterozygosity across bp for pop 1 Hsd_2
mtDNA
0.164
0.296 0.000 ‐0.003 0.001 ‐0.022 ‐0.002
0.003 0.005 0.003 stdev of expected heterozygosity across bp for pop 2
mean_H
mtDNA
0.524
0.997 0.045 ‐0.052 0.019 ‐0.212 ‐0.113
0.000 ‐0.016 ‐0.067 average of gene diversity across populations
sd_H
mtDNA
0.582
0.680 0.000 0.036 0.062 0.113 0.204
‐0.001 0.037 0.144 stdev of gene diversity across populations
tot_H
mtDNA
0.121
0.469 0.022 ‐0.008 ‐0.004 ‐0.033 ‐0.020
‐0.005 0.000 ‐0.023 total expected heterozyogosity of all populations
S_1
mtDNA
2.000
2537.000 1.000 ‐0.080 ‐0.024 ‐0.186 ‐0.120
‐0.001 ‐0.014 ‐0.039 number of segregating sites in pop 1
prS_1
mtDNA
2.000
375.000 1.000 ‐0.035 0.013 ‐0.209 ‐0.147
0.000 ‐0.022 ‐0.105 number of private segregating sites in pop 1
prS_2
mtDNA
29.000
7185.000 1.000 ‐0.026 0.122 ‐0.187 0.065
‐0.010 0.016 0.005 number of private segregating sites in pop 2
mean_S
mtDNA
15.500
3608.000 1.000 ‐0.053 0.094 ‐0.214 0.028
‐0.008 0.010 0.012 average S across populations
sd_S
mtDNA
19.092
5058.640 0.000 ‐0.022 0.128 ‐0.170 0.084
‐0.011 0.019 0.013 stdev of average S across populations
tot_S
mtDNA
31.000
7216.000 2.000 ‐0.044 0.102 ‐0.211 0.034
‐0.009 0.010 0.007 total number of segregating sites in the sample set
D_1
mtDNA
‐1.313
4.382 ‐2.979 ‐0.050 ‐0.062 0.024 ‐0.023
‐0.001 ‐0.005 0.039 Tajima's D in pop 1 D_2
mtDNA
‐0.133
3.343 ‐2.663 ‐0.001 0.002 ‐0.012 0.015
‐0.002 0.007 0.008 Tajima's D in pop 2
mean_D
mtDNA
‐0.723
3.435 ‐2.434 ‐0.043 ‐0.044 0.003 ‐0.005
‐0.003 0.001 0.039 average Tajima's D for pop 1 and 2
sd_D
mtDNA
0.834
4.016 0.000 ‐0.017 0.014 ‐0.039 0.026
‐0.010 0.008 0.024 stdev of average Tajima's D for pop 1 and 2
FS_1
mtDNA
‐2.369
36.737 ‐27.703 ‐0.062 ‐0.055 0.046 0.049
‐0.001 0.012 0.111 Fu's Fs for pop 1 FS_2
mtDNA
‐6.667
30.639 ‐19.384 ‐0.004 0.004 ‐0.010 0.014
0.000 0.002 ‐0.007 Fu's Fs for pop 2
mean_FS
mtDNA
‐4.518
21.819 ‐15.955 ‐0.060 ‐0.048 0.036 0.050
‐0.001 0.011 0.098 average Fs of pop1 and pop2
sd_FS
mtDNA
3.039
28.115 0.001 ‐0.052 0.020 ‐0.127 ‐0.023
‐0.002 0.007 ‐0.011 stdev of average Fs of pop1 and pop2
Pi_1
mtDNA
0.114
1117.060 0.038 ‐0.089 ‐0.038 ‐0.149 ‐0.087
‐0.001 ‐0.010 0.003 mean number of pairwise differences in pop 1
Pi_2
mtDNA
6.594
1988.640 0.051 ‐0.043 0.107 ‐0.199 0.054
‐0.010 0.014 0.016 mean number of pairwise differences in pop 2
mean_Pi
mtDNA
3.354
1096.780 0.045 ‐0.055 0.091 ‐0.210 0.033
‐0.009 0.011 0.018 average pi of pop 1 and 2
sd_Pi
mtDNA
4.582
1404.880 0.000 ‐0.016 0.127 ‐0.166 0.080
‐0.010 0.017 0.006 stdev of average pi of pop 1 and 2
FST_2_1
mtDNA
0.377
1.000 ‐7.211 0.077 0.062 0.006 ‐0.002
‐0.003 0.000 ‐0.097 FST between pop 1 and 2
PI_2_1
mtDNA
6.318
3164.990 0.000 ‐0.030 0.103 ‐0.195 0.031
‐0.010 0.009 ‐0.012 Average number of pairwise differences between populations (PiXY) K_1
nucDNA L1
4.000
37.000 1.000 ‐0.098 ‐0.055 ‐0.001 0.035
‐0.312 0.073 ‐0.181 number of haplotypes in pop 1
Ksd_1
nucDNA L1
0.277
0.577 0.000 ‐0.075 ‐0.029 0.003 0.071
‐0.313 0.077 ‐0.152 stdev of the number of alleles across bp. in pop 1 H_1
nucDNA L1
0.619
0.989 0.000 ‐0.102 ‐0.053 ‐0.004 0.069
‐0.308 0.078 ‐0.130 gene diversity in pop 1 Hsd_1
nucDNA L1
0.118
0.330 0.000 ‐0.096 ‐0.047 ‐0.004 0.075
‐0.306 0.077 ‐0.121 stdev of expected heterozygosity across bp in pop 1 S_1
nucDNA L1
13.000
1274.000 0.000 ‐0.097 ‐0.034 ‐0.002 0.077
‐0.295 0.080 ‐0.168 number of segregating sites in pop 1
D_1
nucDNA L1
3.144
4.184 ‐2.919 ‐0.046 ‐0.013 ‐0.009 0.095
‐0.086 0.037 0.046 Tajima's D in pop 1 FS_1
nucDNA L1
10.888
36.737 ‐12.934 ‐0.061 0.001 ‐0.007 0.132
‐0.168 0.062 ‐0.020 Fu's Fs for pop 1
Pi_1
nucDNA L1
6.015
435.212 0.000 ‐0.097 ‐0.030 ‐0.003 0.088
‐0.285 0.080 ‐0.152 mean number of pairwise differences as calculated under Tajima's D in pop 1
in pop 1 K_1
nucDNA L2
3.000
39.000 1.000 ‐0.099 ‐0.056 ‐0.010 0.026
0.206 0.244 ‐0.178 number of haplotypes in pop 1
Ksd_1
nucDNA L2
0.000
0.577 0.000 ‐0.077 ‐0.029 ‐0.004 0.066
0.202 0.243 ‐0.155 stdev of the number of alleles across bp. in pop 1 H_1
nucDNA L2
0.202
0.992 0.000 ‐0.107 ‐0.057 ‐0.011 0.059
0.199 0.245 ‐0.126 gene diversity in pop 1 Hsd_1
nucDNA L2
0.025
0.330 0.000 ‐0.099 ‐0.049 ‐0.008 0.070
0.193 0.237 ‐0.120 stdev of expected heterozygosity across bp in pop 1 S_1
nucDNA L2
22.000
1686.000 0.000 ‐0.100 ‐0.030 ‐0.008 0.068
0.183 0.234 ‐0.168 number of segregating sites in pop 1
D_1
nucDNA L2
‐1.014
4.120 ‐2.975 ‐0.048 ‐0.013 ‐0.005 0.090
0.044 0.083 0.043 Tajima's D in pop 1 FS_1
nucDNA L2
8.136
36.737 ‐10.874 ‐0.066 0.002 ‐0.004 0.126
0.097 0.151 ‐0.019 Fu's Fs for pop 1
Pi_1
nucDNA L2
3.452
410.657 0.000 ‐0.100 ‐0.028 ‐0.008 0.081
0.183 0.238 ‐0.154 mean number of pairwise differences as calculated under Tajima's D in pop 1
HH
nucDNA L2
0.803
1.000 0.029 0.110 0.058 0.012 ‐0.058
‐0.198 ‐0.244 0.130 sum of squared frequency of haplotypes in pop 1 K_1
nucDNA L3
3.000
37.000 1.000 ‐0.099 ‐0.053 ‐0.012 0.101
0.097 ‐0.271 ‐0.189 number of haplotypes in pop 1
Ksd_1
nucDNA L3
0.000
0.577 0.000 ‐0.076 ‐0.027 ‐0.008 0.130
0.098 ‐0.267 ‐0.177 stdev of the number of alleles across bp. in pop 1 H_1
nucDNA L3
0.425
0.991 0.000 ‐0.103 ‐0.050 ‐0.012 0.126
0.095 ‐0.268 ‐0.144 gene diversity in pop 1 Hsd_1
nucDNA L3
0.164
0.331 0.000 ‐0.094 ‐0.044 ‐0.012 0.131
0.095 ‐0.266 ‐0.156 stdev of expected heterozygosity across bp in pop 1 S_1
nucDNA L3
2.000
741.000 0.000 ‐0.098 ‐0.033 ‐0.010 0.131
0.089 ‐0.256 ‐0.191 number of segregating sites in pop 1
D_1
nucDNA L3
0.406
4.184 ‐2.849 ‐0.043 ‐0.008 ‐0.003 0.102
0.025 ‐0.083 0.017 Tajima's D in pop 1 FS_1
nucDNA L3
0.554
36.737 ‐9.855 ‐0.060 0.006 ‐0.004 0.146
0.041 ‐0.133 ‐0.044 Fu's Fs for pop 1
Pi_1
nucDNA L3
0.557
225.043 0.000 ‐0.097 ‐0.029 ‐0.009 0.142
0.085 ‐0.251 ‐0.177 mean number of pairwise differences as calculated under Tajima's D in pop 1
HH
nucDNA L3
0.584
1.000 0.030 0.105 0.052 0.012 ‐0.126
‐0.095 0.268 0.148 sum of squared frequency of haplotypes in pop 1 K_1_vs_K_2
microsatellite
‐0.238
0.134 ‐1.573 ‐0.089 ‐0.169 ‐0.034 ‐0.062
0.001 ‐0.010 0.047 Log10(K_1 / K_2) H_1_vs_H_ 2
microsatellite
‐0.091
0.122 ‐2.684 ‐0.148 ‐0.113 ‐0.006 ‐0.036
0.002 ‐0.008 0.085 Log10(H_1 / H_2) R_1_vs_R_ 2
microsatellite
‐0.108
0.172 ‐1.760 ‐0.125 ‐0.144 ‐0.029 0.003
0.000 ‐0.002 0.115 Log10(R_1 / R_2) GW_1_vs_ GW_2
microsatellite
‐0.102
0.374 ‐0.786 0.072 ‐0.003 0.004 ‐0.171
0.001 ‐0.026 ‐0.168 Log10(GW_1 / GW_2) NGW_1_vs _NGW_2
microsatellite
‐0.234
0.137 ‐1.571 ‐0.087 ‐0.171 ‐0.034 ‐0.061
0.000 ‐0.010 0.046 Log10(K_1 / K_2) K_1_vs_K_2
mtDNA
‐0.865
0.929 ‐1.290 ‐0.009 ‐0.094 ‐0.047 ‐0.223
0.003 ‐0.040 ‐0.155 Log10(K_1 / K_2) H_1_vs_H_ mtDNA
‐0.920
1.090 ‐1.415 ‐0.036 ‐0.050 ‐0.113 ‐0.176
0.000 ‐0.036 ‐0.125 Log10(H_1 / H_2)
2
S_1_vs_S_2
mtDNA
‐1.161
1.230 ‐3.560 ‐0.030 ‐0.143 0.026 ‐0.191
0.005 ‐0.033 ‐0.082 Log10(S_1 / S_2) prS_1_vs_p rS_2
mtDNA
‐1.161
1.230 ‐3.560 ‐0.001 ‐0.134 0.038 ‐0.206
0.006 ‐0.037 ‐0.112 Log10(prS_1 / prS_2) prS_1_vs_S _1
mtDNA
0.000
0.000 ‐2.068 0.109 0.088 0.048 0.041
0.000 0.007 ‐0.080 Log10(prS_1 / S_1) prS_2_vs_S _2
mtDNA
0.000
0.000 ‐1.342 0.101 0.096 0.046 0.064
‐0.001 0.011 ‐0.069 Log10(prS_2 / S_2) prS_vs_S
mtDNA
0.000
0.000 ‐1.439 0.104 0.095 0.046 0.058
‐0.002 0.010 ‐0.073 Log10((prS_1 + prS_2) / (S_1 + S_2))
mt_vs_nuc _K
MtDNA / nucDNA
‐0.523
1.061 ‐1.462 0.058 0.058 ‐0.175 ‐0.170
0.008 ‐0.050 0.067 Log10(mt_K_1 / (nuc_L1_K_1 + nuc_L2_K_1 + nuc_L3_K_1)) mt_vs_nuc _H
MtDNA / nucDNA
‐1.045
1.358 ‐1.838 0.079 0.053 ‐0.106 ‐0.194
0.006 ‐0.048 0.010 Log10(mt_H_1 / (nuc_L1_H_1 + nuc_L2_H_1 + nuc_L3_H_1)) mt_vs_nuc _S
MtDNA / nucDNA
‐1.267
2.569 ‐2.666 0.059 0.030 ‐0.151 ‐0.205
0.015 ‐0.068 0.126 Log10(mt_S_1 / (nuc_L1_S_1 + nuc_L2_S_1 + nuc_L3_S_1)) mt_vs_nuc _Pi
MtDNA / nucDNA
‐1.945
3.165 ‐3.452 0.056 0.023 ‐0.131 ‐0.222
0.013 ‐0.065 0.066 Log10(mt_Pi_1 / (nuc_L1_Pi_1 + nuc_L2_Pi_1 + nuc_L3_Pi_1))
Table S4. Microsatellite population genetic measures per locus per population.
Gough
Ireland
Locus
N
A
Ho
He
r
NGW HWE N A Ho He r
NGW HWE
Chr02_01
104
13
0.808
0.833
17
0.591 0.614 20 15 0.900 0.968
20 0.682 0.313 Chr02_02
104
8
0.750
0.718
12
0.444 0.891 20 8 0.900 0.863
15 0.444 0.503 Chr12_05
104
5
0.558
0.674
5
0.227 0.303 20 6 0.600 0.800
5
0.273 0.194 Chr19_08
104
12
0.885
0.888
13
0.800 0.671 20 9 0.700 0.795
10 0.600 0.225 Chr18_08
104
13
0.500
0.770
57
0.203 0.000 20 8 0.600 0.900
11 0.125 0.012 Chr17_09
104
8
0.750
0.793
17
0.381 0.319 20 6 0.700 0.747
20 0.286 0.874 Chr08_11
104
8
0.750
0.748
10
0.571 0.353 20 7 0.900 0.842
7
0.500 0.966 Chr05_15
104
4
0.500
0.523
12
0.267 0.782 20 6 0.600 0.821
6
0.400 0.106 Chr14_16
104
6
0.808
0.813
13
0.353 0.374 20 9 0.800 0.858
11 0.529 0.543 Chr09_20
104
9
0.712
0.788
11
0.643 0.232 20 7 0.800 0.732
8
0.500 0.978 Chr03_21
104
7
0.692
0.779
9
0.700 0.030 20 7 0.700 0.800
9
0.700 0.393 Chr16_21
104
6
0.731
0.658
7
0.462 0.176 20 4 0.500 0.500
4
0.308 0.650 Chr13_22
104
8
0.712
0.774
8
0.800 0.041 20 7 0.900 0.826
6
0.700 0.986 Chr01_23
104
6
0.308
0.327
6
0.300 0.327 20 11 0.900 0.921
19 0.550 0.352 Chr03_24
104
11
0.788
0.757
18
0.440 0.139 20 12 0.900 0.937
18 0.480 0.654 Chr04_31
104
10
0.904
0.855
22
0.400 0.732 20 8 0.800 0.900
20 0.320 0.249 Chr07_38
104
2
0.192
0.176
1
0.118 1.000 20 8 0.600 0.837
10 0.471 0.148 Chr01_45
104
5
0.615
0.630
11
0.238 0.912 20 8 0.900 0.858
12 0.381 0.898 Chr05_45
104
10
0.788
0.799
12
0.714 0.083 20 7 0.700 0.811
10 0.500 0.573 Chr10_45
104
10
0.808
0.851
14
0.625 0.288 20 9 0.700 0.900
9
0.563 0.062 Chr11_64
104
4
0.558
0.625
6
0.308 0.458 20 5 0.400 0.663
6
0.385 0.154 Average
7.86
0.672
0.704
13.38 0.456 0.415 7.95 0.738 0.823
11.24 0.462 0.468 stdev
3.05
0.181
0.176
11.12 0.205 0.312 2.44 0.150 0.103
5.33 0.150 0.327
England
France
Locus
N
A
Ho
He
r
NGW HWE N A Ho He
r NGW HWE
Chr02_01
20
6
0.700
0.768
7
0.273 0.760 10 7 1.000 0.933
13 0.318 1.000 Chr02_02
20
6
0.800
0.858
9
0.333 0.650 10 5 0.400 0.822
10 0.278 0.088 Chr12_05
20
7
0.700
0.821
15
0.318 0.551 10 5 0.600 0.867
14 0.227 0.284 Chr19_08
20
8
0.500
0.832
10
0.533 0.008 10 8 1.000 0.956
14 0.533 1.000 Chr18_08
20
12
0.700
0.942
54
0.188 0.006 10 6 0.400 0.844
29 0.094 0.011 Chr17_09
20
9
0.700
0.753
14
0.429 0.211 10 5 0.800 0.844
13 0.238 0.847 Chr08_11
20
8
0.700
0.884
9
0.571 0.119 10 5 0.800 0.844
4 0.357 0.353 Chr05_15
20
6
0.500
0.516
6
0.400 0.656 10 4 1.000 0.733
11 0.267 0.743 Chr14_16
20
8
0.700
0.837
10
0.471 0.350 10 9 0.800 0.978
14 0.529 0.116 Chr09_20
20
8
0.400
0.747
13
0.571 0.004 10 7 0.800 0.911
10 0.500 0.485 Chr03_21
20
3
0.300
0.668
5
0.300 0.017 10 6 0.800 0.889
7 0.600 0.148 Chr16_21
20
6
0.500
0.784
7
0.462 0.021 10 5 0.800 0.822
8 0.385 0.897 Chr13_22
20
6
0.300
0.726
5
0.600 0.005 10 3 0.200 0.733
2 0.300 0.048 Chr01_23
20
6
0.400
0.816
7
0.300 0.002 10 4 0.400 0.778
4 0.200 0.187 Chr03_24
20
9
0.600
0.900
17
0.360 0.003 10 7 0.600 0.911
12 0.280 0.049 Chr04_31
20
3
0.300
0.279
12
0.120 1.000 10 5 0.800 0.844
14 0.200 0.350 Chr07_38
20
9
0.400
0.795
13
0.529 0.012 10 6 0.600 0.889
9 0.353 0.155 Chr01_45
20
5
0.400
0.753
13
0.238 0.011 10 7 1.000 0.867
15 0.333 1.000 Chr05_45
20
4
0.300
0.700
3
0.286 0.030 10 5 0.600 0.756
10 0.357 0.232 Chr10_45
20
8
0.400
0.905
12
0.500 0.000 10 6 0.800 0.889
10 0.375 0.150 Chr11_64
20
5
0.600
0.758
9
0.385 0.287 10 5 0.400 0.756
4 0.385 0.046 Average
6.76
0.519
0.764
11.90
0.389 0.224 5.71 0.695 0.851
10.81 0.339 0.390 stdev
2.19
0.166
0.145
10.32
0.135 0.312 1.42 0.233 0.070
5.68 0.125 0.362
Spain
Portugal
Locus
N
A
Ho
He
r
NGW HWE N A Ho He
r
NGW HWE
Chr02_01
20
9
0.800
0.905
15
0.409 0.183 10 6 0.800 0.889
9 0.273 0.618 Chr02_02
20
7
0.600
0.863
11
0.389 0.022 10 6 0.800 0.778
9 0.333 0.876 Chr12_05
20
5
0.400
0.784
4
0.227 0.019 10 3 0.200 0.689
2 0.136 0.048 Chr19_08
20
9
0.800
0.921
11
0.600 0.411 10 7 0.800 0.911
11 0.467 0.498 Chr18_08
20
8
0.800
0.884
10
0.125 0.354 10 7 0.600 0.911
9 0.109 0.047 Chr17_09
20
8
0.500
0.868
12
0.381 0.013 10 7 0.800 0.911
14 0.333 0.500 Chr08_11
20
7
0.700
0.811
12
0.500 0.281 10 4 0.400 0.733
3 0.286 0.111 Chr05_15
20
9
0.600
0.832
13
0.600 0.045 10 7 0.800 0.867
13 0.467 0.616 Chr14_16
20
8
0.900
0.879
9
0.471 0.149 10 6 0.800 0.844
14 0.353 0.796 Chr09_20
20
8
0.700
0.889
8
0.571 0.322 10 5 0.800 0.822
9 0.357 0.337 Chr03_21
20
7
0.800
0.789
8
0.700 0.315 10 4 0.800 0.733
6 0.400 0.745 Chr16_21
20
8
0.800
0.868
7
0.615 0.813 10 5 0.600 0.822
4 0.385 0.334 Chr13_22
20
8
0.700
0.879
7
0.800 0.146 10 6 0.800 0.889
5 0.600 0.611 Chr01_23
20
8
0.700
0.853
8
0.400 0.257 10 5 1.000 0.844
6 0.250 0.851 Chr03_24
20
16
1.000
0.974
18
0.640 1.000 10 6 0.800 0.844
14 0.240 0.794 Chr04_31
20
8
0.800
0.884
16
0.320 0.752 10 5 0.200 0.867
10 0.200 0.003 Chr07_38
20
8
0.600
0.811
11
0.471 0.073 10 3 0.200 0.378
4 0.176 0.111 Chr01_45
20
7
0.700
0.879
8
0.333 0.448 10 7 0.600 0.911
17 0.333 0.054 Chr05_45
20
8
0.800
0.884
8
0.571 0.721 10 6 0.400 0.844
8 0.429 0.009 Chr10_45
20
8
0.700
0.889
9
0.500 0.312 10 6 1.000 0.889
6 0.375 0.617 Chr11_64
20
9
0.900
0.874
12
0.692 0.752 10 3 0.200 0.689
3 0.231 0.047 Average
8.24
0.729
0.868
10.33
0.491 0.352 5.43 0.638 0.813
8.38 0.321 0.411 stdev
2.00
0.138
0.044
3.34
0.166 0.295 1.36 0.265 0.122
4.28 0.119 0.320
Scotland
Germany
Locus
N
A
Ho
He
r
NGW HWE N A Ho He r
NGW HWE
Chr02_01
10
4
0.800
0.778
4
0.182 0.071 10 5 0.600 0.756
18
0.227 0.496 Chr02_02
10
5
0.600
0.844
11
0.278 0.353 10 2 0.400 0.533
1
0.111 1.000 Chr12_05
10
4
0.600
0.711
4
0.182 1.000 10 3 0.400 0.622
16
0.136 0.241 Chr19_08
10
5
0.400
0.822
12
0.333 0.083 10 3 0.200 0.378
6
0.200 0.110 Chr18_08
10
3
0.600
0.511
4
0.047 1.000 10 4 1.000 0.778
12
0.063 0.239 Chr17_09
10
7
1.000
0.911
14
0.333 1.000 10 4 0.800 0.778
17
0.190 0.073 Chr08_11
10
5
0.800
0.667
8
0.357 1.000 10 2 0.000 0.356
1
0.143 0.112 Chr05_15
10
5
0.600
0.822
6
0.333 0.341 10 4 0.800 0.711
6
0.267 0.207 Chr14_16
10
3
0.400
0.711
6
0.176 0.187 10 3 0.200 0.689
5
0.176 0.047 Chr09_20
10
4
0.400
0.778
6
0.286 0.047 10 2 0.400 0.356
1
0.143 1.000 Chr03_21
10
2
0.200
0.200
4
0.200 1.000 10 2 0.200 0.467
1
0.200 0.334 Chr16_21
10
3
0.600
0.644
9
0.231 1.000 10 5 0.400 0.756
8
0.385 0.048 Chr13_22
10
3
0.400
0.600
2
0.300 0.623 10 2 0.200 0.200
1
0.200 1.000 Chr01_23
10
5
0.800
0.844
6
0.250 0.351 10 4 0.800 0.711
7
0.200 0.208 Chr03_24
10
4
0.600
0.778
4
0.160 0.693 10 3 0.200 0.511
12
0.120 0.113 Chr04_31
10
5
0.600
0.800
18
0.200 0.466 10 3 0.400 0.622
4
0.120 0.237 Chr07_38
10
5
0.600
0.844
7
0.294 0.349 10 3 1.000 0.644
5
0.176 0.175 Chr01_45
10
3
0.600
0.600
16
0.143 0.618 10 4 0.600 0.644
8
0.190 0.237 Chr05_45
10
5
0.600
0.756
7
0.357 0.490 10 3 0.200 0.378
3
0.214 0.110 Chr10_45
10
4
0.200
0.778
3
0.250 0.010 10 2 0.000 0.356
3
0.125 0.112 Chr11_64
10
2
0.200
0.200
3
0.154 1.000 10 2 0.000 0.356
4
0.154 0.112 Average
4.10
0.552
0.695
7.33
0.240 0.556 3.10 0.419 0.552
6.62 0.178 0.296 stdev
1.22
0.209
0.192
4.48
0.083 0.370 1.00 0.316 0.177
5.44 0.067 0.312
N, number of chromosomes samlped; A, number of alleles; H
o, observed heterozygosity; H
e, expected heterozygosity; r, range of allele sizes; NGW,
Table S5 Microsatellite allele frequencies per locus per country.
Locus
Allele
Gough
Ireland
England France Spain Portugal Scotland
Germany Chr02_01
n=52
n=10
n=10 n=5 n=10 n=5 n=5 n=5 486
0.000
0.050
0.000 0.000 0.000 0.000 0.000 0.000 488
0.000
0.050
0.000 0.000 0.000 0.000 0.000 0.000 490
0.000
0.100
0.000 0.100 0.100 0.000 0.000 0.000 492
0.212
0.100
0.000 0.000 0.000 0.000 0.000 0.200 494
0.000
0.050
0.000 0.100 0.000 0.000 0.000 0.500 496
0.000
0.050
0.000 0.000 0.000 0.100 0.000 0.000 498
0.019
0.000
0.050 0.200 0.050 0.000 0.000 0.000 500
0.000
0.050
0.050 0.000 0.000 0.000 0.200 0.100 502
0.260
0.050
0.400 0.100 0.050 0.200 0.400 0.000 504
0.183
0.150
0.200 0.200 0.100 0.000 0.100 0.000 506
0.010
0.050
0.000 0.000 0.000 0.100 0.000 0.000 508
0.154
0.050
0.000 0.200 0.100 0.300 0.300 0.000 510
0.029
0.100
0.250 0.000 0.250 0.100 0.000 0.000 512
0.010
0.050
0.050 0.000 0.150 0.000 0.000 0.000 514
0.000
0.050
0.000 0.000 0.100 0.200 0.000 0.000 516
0.010
0.000
0.000 0.100 0.000 0.000 0.000 0.000 520
0.019
0.000
0.000 0.000 0.100 0.000 0.000 0.000 522
0.058
0.000
0.000 0.000 0.000 0.000 0.000 0.000 524
0.029
0.000
0.000 0.000 0.000 0.000 0.000 0.100 526
0.010
0.050
0.000 0.000 0.000 0.000 0.000 0.000 528
0.000
0.000
0.000 0.000 0.000 0.000 0.000 0.100
Chr02_02
Gough
Ireland
England France Spain Portugal Scotland
Germany 215
0.000
0.050
0.000 0.000 0.000 0.000 0.000 0.000 225
0.240
0.150
0.150 0.100 0.100 0.000 0.300 0.000 227
0.019
0.200
0.000 0.000 0.000 0.000 0.000 0.000 229
0.000
0.000
0.100 0.000 0.000 0.100 0.000 0.000 231
0.010
0.000
0.000 0.000 0.050 0.100 0.000 0.000 233
0.000
0.000
0.000 0.000 0.250 0.100 0.000 0.000 237
0.000
0.050
0.200 0.200 0.250 0.500 0.000 0.000 239
0.048
0.100
0.200 0.000 0.100 0.000 0.100 0.000 241
0.000
0.050
0.250 0.400 0.150 0.000 0.200 0.000 243
0.442
0.300
0.100 0.100 0.000 0.100 0.300 0.000
245
0.173
0.100
0.000 0.200 0.000 0.000 0.000 0.600
247
0.019
0.000
0.000 0.000 0.100 0.100 0.100 0.400
249
0.048
0.000
0.000 0.000 0.000 0.000 0.000 0.000
Chr12_05
Gough
Ireland
England France Spain Portugal Scotland
Germany 168
0.000
0.000
0.050 0.000 0.000 0.000 0.000 0.000 174
0.000
0.000
0.000 0.200 0.000 0.000 0.000 0.000 178
0.000
0.000
0.000 0.000 0.000 0.000 0.000 0.200 180
0.000
0.000
0.050 0.000 0.000 0.000 0.000 0.000 186
0.144
0.000
0.000 0.000 0.000 0.000 0.000 0.000 188
0.000
0.000
0.100 0.000 0.000 0.000 0.000 0.000 190
0.202
0.050
0.200 0.000 0.000 0.000 0.500 0.000 192
0.500
0.250
0.350 0.000 0.300 0.200 0.000 0.000 194
0.144
0.050
0.200 0.000 0.250 0.500 0.100 0.000 196
0.010
0.350
0.000 0.100 0.300 0.300 0.300 0.200 198
0.000
0.200
0.050 0.200 0.050 0.000 0.100 0.000 200
0.000
0.100
0.000 0.200 0.100 0.000 0.000 0.000 202
0.000
0.000
0.000 0.300 0.000 0.000 0.000 0.000 210
0.000
0.000
0.000 0.000 0.000 0.000 0.000 0.600
Chr19_08
Gough
Ireland
England France Spain Portugal Scotland
Germany
291
0.106
0.000
0.100 0.200 0.000 0.000 0.200 0.000 293
0.000
0.050
0.300 0.000 0.000 0.100 0.000 0.000 295
0.087
0.050
0.000 0.100 0.000 0.000 0.000 0.000 297
0.010
0.000
0.000 0.100 0.150 0.300 0.000 0.000 299
0.029
0.100
0.050 0.100 0.150 0.000 0.000 0.000 301
0.058
0.100
0.050 0.000 0.050 0.100 0.000 0.100 303
0.202
0.050
0.300 0.100 0.150 0.100 0.000 0.000 305
0.000
0.050
0.050 0.000 0.100 0.100 0.400 0.000 307
0.144
0.000
0.000 0.000 0.150 0.200 0.000 0.000 309
0.038
0.050
0.100 0.200 0.100 0.000 0.200 0.100 311
0.125
0.450
0.050 0.100 0.000 0.000 0.000 0.000 313
0.096
0.100
0.000 0.000 0.000 0.000 0.100 0.800 315
0.096
0.000
0.000 0.000 0.100 0.100 0.100 0.000 317
0.010
0.000
0.000 0.000 0.000 0.000 0.000 0.000 319
0.000
0.000
0.000 0.100 0.050 0.000 0.000 0.000 Chr18_08
Gough
Ireland
England France Spain Portugal Scotland
Germany
445
0.000
0.000
0.100 0.000 0.000 0.000 0.000 0.000 447
0.000
0.000
0.000 0.000 0.100 0.000 0.000 0.000 451
0.000
0.000
0.000 0.000 0.000 0.100 0.000 0.000 453
0.000
0.000
0.100 0.000 0.050 0.100 0.000 0.000 455
0.000
0.000
0.100 0.000 0.050 0.100 0.000 0.400 457
0.010
0.150
0.200 0.000 0.000 0.000 0.000 0.100 459
0.298
0.150
0.100 0.000 0.100 0.000 0.000 0.000 461
0.029
0.050
0.050 0.400 0.250 0.100 0.700 0.000 463
0.000
0.000
0.100 0.000 0.100 0.200 0.000 0.000 465
0.000
0.150
0.050 0.000 0.200 0.000 0.200 0.000 467
0.337
0.050
0.050 0.100 0.150 0.300 0.000 0.300 469
0.048
0.150
0.050 0.100 0.000 0.100 0.100 0.000 471
0.000
0.200
0.000 0.000 0.000 0.000 0.000 0.000 473
0.173
0.000
0.000 0.000 0.000 0.000 0.000 0.000 475
0.038
0.000
0.000 0.000 0.000 0.000 0.000 0.000 477
0.000
0.000
0.000 0.200 0.000 0.000 0.000 0.000 479
0.000
0.100
0.000 0.000 0.000 0.000 0.000 0.200 487
0.019
0.000
0.000 0.000 0.000 0.000 0.000 0.000 497
0.010
0.000
0.000 0.000 0.000 0.000 0.000 0.000 515
0.010
0.000
0.000 0.000 0.000 0.000 0.000 0.000 517
0.000
0.000
0.000 0.100 0.000 0.000 0.000 0.000 519
0.000
0.000
0.000 0.100 0.000 0.000 0.000 0.000 521
0.010
0.000
0.000 0.000 0.000 0.000 0.000 0.000 531
0.010
0.000
0.000 0.000 0.000 0.000 0.000 0.000 551
0.000
0.000
0.050 0.000 0.000 0.000 0.000 0.000 553
0.000
0.000
0.050 0.000 0.000 0.000 0.000 0.000 571
0.010
0.000
0.000 0.000 0.000 0.000 0.000 0.000
Chr17_09
Gough
Ireland
England France Spain Portugal Scotland
Germany
244
0.260
0.450
0.500 0.300 0.250 0.100 0.300 0.300 250
0.000
0.000
0.050 0.000 0.000 0.000 0.000 0.000 254
0.000
0.200
0.100 0.200 0.250 0.100 0.000 0.000 256
0.000
0.000
0.050 0.000 0.150 0.200 0.100 0.000 258
0.000
0.000
0.050 0.300 0.050 0.000 0.100 0.000 260
0.212
0.000
0.000 0.000 0.000 0.000 0.100 0.200 262
0.038
0.000
0.000 0.000 0.100 0.000 0.000 0.000
264
0.000
0.000
0.000 0.000 0.050 0.100 0.000 0.000 266
0.000
0.200
0.100 0.100 0.100 0.300 0.100 0.000 268
0.000
0.050
0.050 0.000 0.050 0.100 0.100 0.000 270
0.288
0.000
0.050 0.100 0.000 0.000 0.000 0.400 272
0.038
0.050
0.050 0.000 0.000 0.100 0.200 0.000 274
0.125
0.000
0.000 0.000 0.000 0.000 0.000 0.000 276
0.010
0.000
0.000 0.000 0.000 0.000 0.000 0.000 278
0.029
0.000
0.000 0.000 0.000 0.000 0.000 0.100 284
0.000
0.050
0.000 0.000 0.000 0.000 0.000 0.000 Chr08_11
Gough
Ireland
England France Spain Portugal Scotland
Germany
380
0.000
0.100
0.100 0.200 0.000 0.200 0.100 0.000 382
0.058
0.300
0.000 0.100 0.150 0.100 0.000 0.000 384
0.183
0.150
0.250 0.300 0.400 0.500 0.100 0.200 386
0.394
0.050
0.150 0.300 0.100 0.200 0.000 0.800 388
0.058
0.100
0.050 0.100 0.150 0.000 0.000 0.000 390
0.000
0.250
0.000 0.000 0.050 0.000 0.000 0.000 392
0.000
0.000
0.050 0.000 0.000 0.000 0.600 0.000 394
0.000
0.050
0.200 0.000 0.000 0.000 0.100 0.000 396
0.019
0.000
0.100 0.000 0.000 0.000 0.100 0.000 398
0.250
0.000
0.100 0.000 0.100 0.000 0.000 0.000 400
0.010
0.000
0.000 0.000 0.000 0.000 0.000 0.000 402
0.029
0.000
0.000 0.000 0.000 0.000 0.000 0.000 406
0.000
0.000
0.000 0.000 0.050 0.000 0.000 0.000 Chr05_15
Gough
Ireland
England France Spain Portugal Scotland
Germany
148
0.558
0.000
0.000 0.100 0.000 0.100 0.000 0.000 150
0.000
0.000
0.000 0.000 0.050 0.000 0.000 0.000 154
0.000
0.000
0.000 0.000 0.050 0.000 0.000 0.000 156
0.000
0.000
0.000 0.000 0.050 0.100 0.000 0.000 158
0.000
0.000
0.000 0.000 0.000 0.400 0.000 0.000 160
0.413
0.200
0.700 0.500 0.050 0.000 0.400 0.000 162
0.000
0.000
0.050 0.000 0.250 0.100 0.200 0.000 164
0.000
0.150
0.000 0.000 0.350 0.100 0.000 0.100 166
0.000
0.050
0.050 0.200 0.050 0.000 0.000 0.300 168
0.000
0.350
0.100 0.000 0.100 0.000 0.100 0.100 170
0.010
0.150
0.050 0.200 0.000 0.100 0.100 0.000
172
0.019
0.100
0.050 0.000 0.000 0.000 0.200 0.000 174
0.000
0.000
0.000 0.000 0.000 0.100 0.000 0.000 176
0.000
0.000
0.000 0.000 0.050 0.000 0.000 0.500
Chr14_16
Gough
Ireland
England France Spain Portugal Scotland
Germany
476
0.173
0.000
0.000 0.000 0.000 0.100 0.000 0.000 478
0.000
0.000
0.000 0.100 0.000 0.400 0.000 0.000 480
0.000
0.000
0.050 0.000 0.000 0.100 0.000 0.000 482
0.000
0.050
0.000 0.000 0.000 0.000 0.000 0.000 484
0.000
0.050
0.150 0.000 0.000 0.000 0.400 0.000 486
0.000
0.000
0.050 0.100 0.000 0.000 0.000 0.000 488
0.000
0.000
0.000 0.100 0.100 0.000 0.000 0.000 490
0.096
0.050
0.050 0.000 0.050 0.000 0.000 0.000 492
0.000
0.050
0.100 0.100 0.000 0.100 0.000 0.000 494
0.058
0.300
0.000 0.000 0.300 0.000 0.400 0.000 496
0.000
0.200
0.050 0.200 0.100 0.000 0.200 0.000 498
0.231
0.200
0.350 0.100 0.150 0.000 0.000 0.500 500
0.250
0.050
0.200 0.100 0.100 0.100 0.000 0.000 502
0.192
0.000
0.000 0.100 0.000 0.000 0.000 0.300 504
0.000
0.050
0.000 0.000 0.100 0.200 0.000 0.000 506
0.000
0.000
0.000 0.100 0.100 0.000 0.000 0.000 508
0.000
0.000
0.000 0.000 0.000 0.000 0.000 0.200
Chr09_20
Gough
Ireland
England France Spain Portugal Scotland
Germany 227
0.000
0.000
0.100 0.000 0.000 0.000 0.000 0.000 229
0.000
0.000
0.000 0.000 0.200 0.000 0.000 0.000 231
0.279
0.000
0.500 0.300 0.100 0.400 0.000 0.000 233
0.000
0.000
0.050 0.000 0.000 0.000 0.000 0.000 235
0.048
0.050
0.000 0.100 0.200 0.200 0.300 0.000 237
0.298
0.050
0.000 0.000 0.100 0.000 0.200 0.000 239
0.000
0.000
0.000 0.000 0.200 0.000 0.000 0.000 241
0.000
0.000
0.000 0.000 0.050 0.000 0.000 0.000 243
0.010
0.150
0.050 0.100 0.100 0.000 0.000 0.000 245
0.029
0.500
0.100 0.100 0.050 0.100 0.400 0.800 247
0.038
0.050
0.100 0.200 0.000 0.100 0.100 0.200 249
0.212
0.050
0.050 0.100 0.000 0.200 0.000 0.000 251
0.038
0.150
0.000 0.100 0.000 0.000 0.000 0.000
253
0.048
0.000
0.050 0.000 0.000 0.000 0.000 0.000 Chr03_21
Gough
Ireland
England France Spain Portugal Scotland
Germany
200
0.154
0.300
0.000 0.100 0.400 0.500 0.000 0.000 202
0.163
0.000
0.000 0.000 0.100 0.200 0.000 0.000 204
0.000
0.050
0.350 0.200 0.000 0.000 0.900 0.000 206
0.000
0.050
0.000 0.100 0.050 0.200 0.000 0.000 208
0.000
0.050
0.000 0.000 0.050 0.000 0.000 0.000 210
0.096
0.000
0.000 0.100 0.250 0.000 0.000 0.000 212
0.019
0.000
0.200 0.200 0.100 0.100 0.100 0.700 214
0.048
0.350
0.450 0.300 0.000 0.000 0.000 0.300 216
0.385
0.100
0.000 0.000 0.050 0.000 0.000 0.000 218
0.135
0.100
0.000 0.000 0.000 0.000 0.000 0.000
Chr16_21
Gough
Ireland
England France Spain Portugal Scotland
Germany 218
0.000
0.000
0.200 0.000 0.000 0.000 0.400 0.000 222
0.000
0.000
0.400 0.100 0.050 0.000 0.000 0.000 224
0.067
0.000
0.050 0.200 0.050 0.100 0.000 0.000 226
0.010
0.100
0.000 0.000 0.100 0.400 0.000 0.100 228
0.000
0.000
0.100 0.000 0.150 0.200 0.000 0.000 230
0.413
0.700
0.200 0.400 0.300 0.200 0.500 0.200 232
0.096
0.150
0.050 0.200 0.150 0.100 0.000 0.100 234
0.404
0.050
0.000 0.000 0.150 0.000 0.000 0.100 236
0.000
0.000
0.000 0.000 0.050 0.000 0.100 0.000 238
0.010
0.000
0.000 0.100 0.000 0.000 0.000 0.000 242
0.000
0.000
0.000 0.000 0.000 0.000 0.000 0.500
Chr13_22