HAL Id: hal-03037780
https://hal.umontpellier.fr/hal-03037780
Submitted on 3 Dec 2020
HAL is a multi-disciplinary open access
archive for the deposit and dissemination of
sci-entific research documents, whether they are
pub-lished or not. The documents may come from
teaching and research institutions in France or
abroad, or from public or private research centers.
L’archive ouverte pluridisciplinaire HAL, est
destinée au dépôt et à la diffusion de documents
scientifiques de niveau recherche, publiés ou non,
émanant des établissements d’enseignement et de
recherche français ou étrangers, des laboratoires
publics ou privés.
Distributed under a Creative Commons Attribution| 4.0 International License
wild European and inbred strains of house mouse
Stefanie Hartmann, Natascha Hasenkamp, Jens Mayer, Johan Michaux, Serge
Morand, Camila Mazzoni, Alfred Roca, Alex Greenwood
To cite this version:
Stefanie Hartmann, Natascha Hasenkamp, Jens Mayer, Johan Michaux, Serge Morand, et al..
Endoge-nous murine leukemia retroviral variation across wild European and inbred strains of house mouse.
BMC Genomics, 2015, 16, pp.613. �10.1186/s12864-015-1766-z�. �hal-03037780�
R E S E A R C H A R T I C L E
Open Access
Endogenous murine leukemia retroviral
variation across wild European and inbred
strains of house mouse
Stefanie Hartmann
1, Natascha Hasenkamp
2, Jens Mayer
3, Johan Michaux
4, Serge Morand
5,6,
Camila J. Mazzoni
7,8, Alfred L. Roca
9and Alex D. Greenwood
8*Abstract
Background: Endogenous murine leukemia retroviruses (MLVs) are high copy number proviral elements difficult to comprehensively characterize using standard low throughput sequencing approaches. However, high throughput approaches generate data that is challenging to process, interpret and present.
Results: Next generation sequencing (NGS) data was generated for MLVs from two wild caught Mus musculus
domesticus (from mainland France and Corsica) and for inbred laboratory mouse strains C3H, LP/J and SJL. Sequence
reads were grouped using a novel sequence clustering approach as applied to retroviral sequences. A Markov cluster algorithm was employed, and the sequence reads were queried for matches to specific xenotropic (Xmv), polytropic (Pmv) and modified polytropic (Mpmv) viral reference sequences.
Conclusions: Various MLV subtypes were more widespread than expected among the mice, which may be due to the higher coverage of NGS, or to the presence of similar sequence across many different proviral loci. The results did not correlate with variation in the major MLV receptor Xpr1, which can restrict exogenous MLVs, suggesting that endogenous MLV distribution may reflect gene flow more than past resistance to infection.
Keywords: Murine leukemia virus, Endogenous retrovirus, Xpr1, XMRV, Genomic evolution, Markov cluster algorithm
Background
Murine leukemia viruses (MLVs) are present in the germ line of the house mouse Mus musculus and of related species as endogenous retroviruses [1]. Many are inac-tive and transmitted vertically, but MLVs can also exist as horizontally transmitted exogenous retroviruses (ERVs). Because endogenous MLVs are highly variable in sequence and present in the genome at high copy number, a com-prehensive analysis of their presence and distribution has generally been difficult: low throughput data sets gener-ated by Sanger sequencing may only reveal a small propor-tion of the diversity. Many distinct MLVs are also similar enough so that PCR-based approaches may not be able to distinguish among them. Although using next generation sequencing (NGS) data can be effective for characterizing
*Correspondence: greenwood@izw-berlin.de
8Leibniz Institute for Zoo and Wildlife Research, Alfred-Kowalke-Straße 17, 10315 Berlin, Germany
Full list of author information is available at the end of the article
MLV diversity [2, 3], these datasets are often exception-ally complex, consisting of tens of thousands to many millions of sequence reads. These high-throughput data sets are not amenable to standard phylogenetic analysis, as there are substantial challenges for computing, evaluat-ing, and visualizing alignments and phylogenies for such large data sets. In our analysis of NGS-generated data, we overcome these challenges by using a clustering approach to determine the distribution of MLVs in two wild-caught and three inbred laboratory strains of M. musculus. In addition, we also performed detailed sequence compar-isons to determine the presence of specific viral reference sequences in these mice.
MLVs can be pathogenic, causing cellular transforma-tion or leukemia, a cancer originating in the bone mar-row and producing abnormal white blood cells. Different MLVs are able to infect different hosts, i.e., they have dif-ferent host specificity: xenotropic MLV (Xmv) elements
© 2015 Hartmann et al. Open Access This article is distributed under the terms of the Creative Commons Attribution 4.0 International License (http://creativecommons.org/licenses/by/4.0/), which permits unrestricted use, distribution, and reproduction in any medium, provided you give appropriate credit to the original author(s) and the source, provide a link to the Creative Commons license, and indicate if changes were made. The Creative Commons Public Domain Dedication waiver (http://creativecommons.org/publicdomain/zero/1.0/) applies to the data made available in this article, unless otherwise stated.
have a broad host range but are unable to infect lab-oratory mouse host strains, while polytropic MLV ele-ments have a more restricted host range but are able to infect house mouse strains [4]. Polytropic MLVs can be phylogenetically subdivided into Pmv and modified polytropic retroviruses (Mpmv), which are genetically distinct but retain the same host specificity [4]. One recently reported xenotropic MLV, designated xenotropic like murine retrovirus (XMRV) was thought to be asso-ciated with prostate cancer and with chronic fatigue syndrome [5, 6]. It was subsequently demonstrated that detection of XMRV in cancer tissues was due to contam-ination of some molecular biology reagents with mouse genomic DNA [6] and that XMRV was actually a labo-ratory derived virus that originated from recombination in cell culture between two naturally occurring precursor viruses (PreXMRV-1 and PreXMRV-2, both endogenous retroviruses). XMRV then infected human tissues that had been co-cultured with mouse cells [5]. XMRV is the result of at least six recombination events between PreXMRV-1 and PreXMRV-2 [5] in mouse cells; this generated a virus that subsequently infected human cell cultures. The 3’ region of XMRV is generally homologous to the genome of a virus designated PreXMRV-1, while the 5’ region of XMRV is generally homologous to the 5’ region of PreXMRV-2 [5]. PreXMRV-1 and PreXMRV-2 are natu-rally occurring Xmv-like elements that are present in some but not all house mice [7].
Among exogenous MLVs, host range is affected by dif-ferences in the viral envelope protein that allow retro-viruses to bind to host cellular receptors and enter host cells. Host range may also be affected by polymorphisms in the host receptor gene that codes for cellular receptors. In the case of MLVs, the host receptor is the xenotropic and polytropic retrovirus receptor 1 (XPR1) protein, an 8-transmembrane G protein-coupled receptor [8]. Non-synonymous variation in ECL 3 and 4 is associated with MLV Pmv and Xmv subtype restriction [9, 10]. Substi-tution of specific residues in ECL 3 is associated with xenotropic retroviral restriction in vitro. The Xpr1 gene is polymorphic in mice, and specific alleles of Xpr1 have been associated with restriction of the horizontal trans-fer of exogenous Xmv, Pmv or Mpmv retroviruses. For example the Xpr1n allele allows infection of mouse cells by Pmv but not Xmv MLVs [11]. Exogenous retroviral restriction is thus strongly influenced by receptor differ-ences in host cells. By contrast, endogenous MLVs are transmitted through vertical (parent-to-offspring) trans-mission, which could generate a phylogeographic pattern distinct from that of an infectious agent.
MLVs have previously been examined comprehensively primarily in the inbred laboratory mouse strain C57BL6/J yielding many groups of genetically distinct proviruses that are the result of infection of the germ lines of mice
ancestral to C57BL6/J by various MLV lineages [1]. The presence and absence of retroviruses has generally been determined by Southern blot [12–14]. However, Southern blot may not be sensitive or specific enough to distin-guish among closely related viruses or viruses that exist in low copy. Each individual in an inbred strain would be expected to carry the same fixed ERV integrations, although they could share different specific proviral loci depending on the laboratory strain genealogy [12–14]. By contrast, feral mice are from outbred populations where ERV insertional patterns will vary across individuals [15]. Absence of a specific proviral integration would not mean that a given mouse or mouse strain was free of a retroviral lineage, which could be present at other loci. In addition,
Xpr1can only inhibit infection by exogenous retroviruses but cannot prevent the same viral lineages from being inherited as ERVs.
In order to comprehensively examine the presence or absence of Xmv, Pmv and Mpmv, we relied on Roche 454 FLX generated sequences of various MLV genome regions from different mice. We targeted five different regions of the MLV genome that cover the 6 puta-tive recombination sites that generated XMRV from PreXMRV-1 and PreXMRV-2; these regions also allow
Xmv, Pmv and Mpmvs elements to be distinguished from one another. These data allowed us to compare the dis-tribution of proviral sequences identical or closely related to proviruses identified in C57BL6/J using low through-put methods, and to determine their distribution in wild mice. Our analyses show that various MLV subtypes are more widespread than expected among the mice, which may be due to the higher coverage of NGS, or to the presence of similar sequence across many proviral loci. The results were unrelated to variation in the major MLV receptor Xpr1, which can restrict exogenous MLVs, sug-gesting that endogenous MLV distribution reflects gene flow unrelated to exogenous infection.
Results
Mouse strains and MLV target regions
MLV was examined in laboratory mouse strains C3H, LP/J and SJL, and in two wild caught M. m. domesticus; Mmd1 from the French island of Corsica and Mmd2 from main-land France. The inbred mouse strains C3H, LP/J and SJL were utilized because each strain exhibits multiple copies of gag leader sequences that resemble PreXMRV-2/XMRV, as had been previously determined using a DNA panel of laboratory and wild mice [3]. Thus, these strains were expected to carry xenotropic MLVs and Xmv-like elements. They also represent the major laboratory mouse groups: the C3H strain is part of the Lathrop/Castle lin-eage, the SJL strain belongs to the Swiss laboratory mouse lineage, and LP/J represents a third lineage of indepen-dent origin. The outbred mice represent two different feral
populations, since gene flow is unlikely between main-land France and Corsica. The studied feral specimens correspond to the subspecies Mus musculus domesticus according to their distribution as well as based on previous phylogeographic studies performed on these animals [16]. Five regions of the MLV genome, each approximately 400 bp in length (total of approximately 1.6 kb), were ampli-fied using PCR. One primer pair targeted part of the LTR (region 6, Fig. 1), while the other pairs each targeted one of the retroviral gene regions gag, pol, env, or the env-3’LTR boundary (regions 5, 2, 3, and 1, respectively, Fig. 1). The amplicons also included previously identified recom-bination breakpoints for XMRV [5]. The relative positions of the amplified regions are shown in Fig. 1. PCR prod-ucts were sequenced using GS FLX technology, which generated ca. 100,000 reads across the amplified MLV regions.
Cluster analysis of MLV diversity
To determine the diversity of MLVs and their distribu-tion in the different mice, we used the Markov Cluster Algorithm as implemented in the TRIBE-MCL software [17]. In this approach, sequences are grouped (“clustered”) based on pairwise similarity measures such as BLAST E-values [18]. Filtered NGS reads and selected reference sequences from the C57BL6/J genome of Xmv, Pmv and
Mpmv ([4] were grouped into 7,041 sequence clusters, 5,815 of which were singletons. We further analyzed all clusters that contained at least 50 reads; smaller clusters were only considered if the clustering process assigned at least one of the reference sequences to it.
For each of these clusters, we determined which of the MLV target region it corresponded to. We also deter-mined which mouse samples were represented in each of these groups. No cluster contained data from more than one MLV target region, which is as expected since each target region is in a different, non-overlapping part of the MLV genome (Fig. 1). The different regions of the MLV genome yielded quite different numbers of clusters, which was due to a combination of the number and variabil-ity of sequence reads per target region and per sample. Specifically, MLV target region 1 yielded the most clus-ters (n= 41; Fig. 1) and MLV target region 4 in the env gene the fewest (n = 4; data not shown). The number of clusters appeared to depend on the overall variabil-ity across MLVs at each genomic region targeted, with regions of greater variability generating a larger number of clusters (Additional file 1: Table S1). There were also different levels of sequence coverage per mouse, with the wild M. m. domesticus from Corsica (Mmd1) yielding the poorest coverage, and also displaying the lowest num-ber of clusters. However, thousands of sequences were obtained for every mouse, and thus coverage for each target region was much higher than reported for Sanger
sequence approaches [7]. Due to the relatively low cover-age in general for MLV target region 4, located within the
envgene, it was not included in subsequent analysis. We then determined whether clusters shared identity with specific proviral insertion, such as have been clas-sified for Pmv, Mpmv or Xmv. Sequences matching Pmv and Mpmv elements were generally found for each mouse for each MLV region targeted by PCR, and for XMRV in targeted regions 2, 3, and 1 (Fig. 1). Xmv sequence clus-ters were more variable regarding presence or absence, with many clusters absent in SJL and Mmd1 for all PCR products targeted (Fig. 1). The cluster profiles of SJL and Mmd1 were generally similar to each other but different from the C3H, LP/J and Mmd2 (Fig. 1). Most Xmv clus-ters were absent from SJL and Mmd1 for all PCR targeted regions. For Xmv/XMRV clusters, two were absent or rare for PCR target 6, one cluster for target 5, one cluster for target 2, 3 and six clusters for target 1. Although C3H, LP/J and Mmd2 were very similar in profiles, LP/J had five unique Xmv clusters one Mpmv, Xmv, XMRV and two
Xmv/XMRV clusters in target region 6. Overall, the mice fell into two different groupings based on similarity of clusters: one grouping consisted of C3H, LP/J and Mmd2, which shared similar cluster profiles, and another group consisting of SJL and Mmd1.
Assignment of sample sequences to Xmv, Pmv and Mpmv reference sequences
Although the clustering approach is an efficient way to get a broad overview of the similarities and differences of MLV sequences found in the mice, we also wanted to determine which of the specific MLVs (Xmv, Pmv, Mpmv elements) were present in which of the mice sampled. This analysis was independent of the assignment of sequences to clusters.
Each Pmv, Mpmv and Xmv provirus described in Jern et al. [1] is genetically distinct and can be distinguished from one or all of the approximately 400 bp PCR targeted regions in this study (Additional file 1: Table S1). Thus, when a sequence matched a specific proviral sequence we are not stating that the exact proviral insertion is present in a given mouse, but that the viral lineage that gave rise to that provirus is present.
For each of the Xmv (including the exogenous xenotropic MLV XMRV and its endogenous precursors PreXMRV-1 and PreXMRV-2), Pmv and Mpmv reference sequences reported previously [4, 7], we identified the sequence read in each sample that had the highest pair-wise match to each of these reference sequences. This was done separately for each MLV target region. While it is clear that each endogenous retrovirus reported in Bamunusinghe et al. 2013 [4] represents a single fixed locus in C57BL6/J mice for a distinct retroviral element, such data does not indicate whether Mus in general
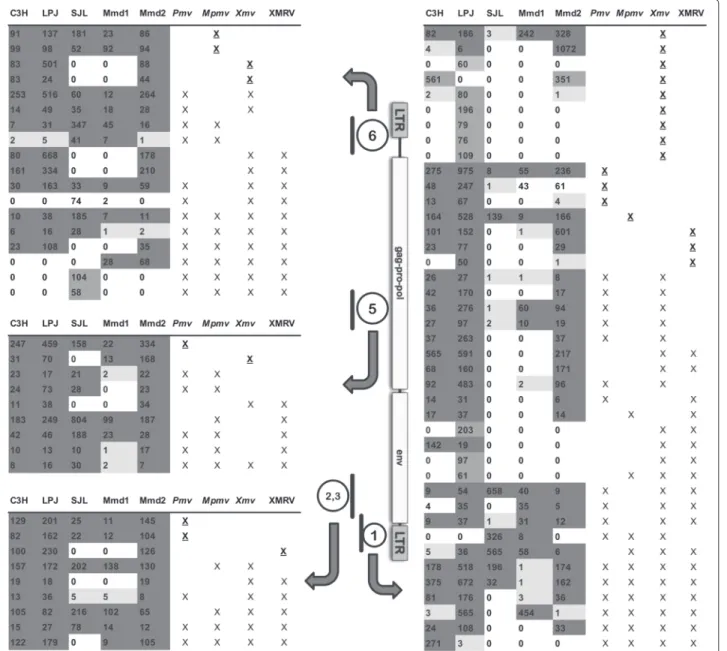
Fig. 1 MLV regions sequenced and summary of sequence cluster information. The structure of the MLV genome is shown between two data tables,
with the locations of retroviral regions that were amplified and sequenced indicated by the thick lines. The numbers with which these regions are labeled (1, 2,3, 5, 6 ) indicate the positions of the regions targeted by PCR, which covered 5 of the 6 recombination sites that created XMRV from PreXMRV-1 and PreXMRV-2 [5]. The target region labeled “2,3” was a single PCR product that included recombination sites 2 and 3. Note that there is no line segment numbered 4, since the PCR targeting the fourth recombination region yielded far fewer reads for all mice tested and was therefore excluded from further analyses. Block arrows point from the analyzed MLV regions to the corresponding table summarizing the clusters identified and analyzed for that genome region. Within the tables, each row represents one cluster of related sequences. A cluster is defined as sequences sharing sufficient identity with each other and with the chosen reference sequences to form a group distinct from other sequences. The first five columns in each table represent the number of sequences in a given cluster for the samples from inbred laboratory mouse strains C3H, LP/J, SJL and two wild caught mice Mmd1 (Corsica) and Mmd2 (mainland France). Shading of these cells correspond to the number of sequences per cluster that were identified per mouse: white for no sequences matching a cluster, light gray for 1-6 sequences, dark gray for more than 6 sequences. Cells shaded in intermediate gray indicates that a cluster was unique to a single mouse. The last four table columns list four different types of MLV (Xmv, XMRV, Pmv or Mpmv), each of which was compared to the mouse sequences generated by the current study. An “X” in these table cells indicates that one or more of the corresponding reference sequences were assigned to the given cluster. When only a single type of MLV reference sequence was assigned to the cluster, the “X” is underlined
was infected with identical or closely related strains with integration occurring elsewhere in the genome. Each of the retroviruses examined is genetically distinct
(Additional file 1: Table S1). However, in some cases, even over 400 bp (the average sequence length targeted) some sequences are identical or are equally different
from several proviruses. Such high identity proviruses are not distinct enough to examine individually by PCR based approaches that do not link all polymorphisms present in phase. The presence of a specific element was examined for each MLV target region based on sequence similarity to the characterized C57BL6/J ERV loci. A confounding factor for the Pmv and Mpmv groups was that, for several of the MLV regions targeted, the different reference proviruses shared very similar sequence identities (Additional file 1: Table S1). How-ever, overall, individual elements could be distinguished by comparing all 4 regions for each retroviral lineage. It was also not possible to determine whether reads from different target regions represented the same or different proviral loci, as NGS approaches for sequenc-ing PCR products over 1 kb with high accuracy were not yet commercially available at the time of sequence data generation.
To score a specific reference MLV as present in a mouse, we used a strict criterion of 100 % identity between a sequence read and the reference sequence. Generated MLV sequences had to match with 100 % identity to the reference virus for all of the MLV target regions, in order for the reference virus to be scored as present in a mouse. The env region with at least two-thirds lower coverage than for the other PCR products was removed from this analysis because the low coverage would likely bias the results to negative findings. How-ever, upon scoring it, the results generally supported the results based on the remaining 4 PCR products. This scor-ing revealed the presence of Pmv8, Pmv10 and Pmv19, which were identified in C3H and LP/J (Table 1). Pmv14 was detected in C3H. Pmv7, Pmv11 and Pmv24 were detected in LP/J. Mmd2 carried sequences identical to
Pmv1, Pmv5, Pmv13, Pmv14, Pmv16, Pmv19and Pmv24. SJL and Mmd1 did not carry any Pmv reference sequences under the criteria applied, except for Pmv19 found in SJL. These results are consistent with the overall sequence clustering profiles (Fig. 1), in which SJL and Mmd1 tended to share one set of clusters, while C3H, LP/J and Mmd2 shared a different set of clusters and similarly lack or carry specific retroviral lineages.
C3H and LP/J both carried sequences identical to
Mpmv10 for all of the MLV genomic regions examined (Table 2). However, targeted region 5 could not be exam-ined, as this region is deleted in the Mpmv10 reference sequence. C3H carried regions with 100 % identity to
Mpmv4, while LP/J carried Mpmv1 and Mpmv7, and Mmd2 carried Mpmv9. SJL and Mmd1 did not carry any
Mpmvunder the criteria used. It is possible that some mice carried elements that were similar to but not 100 % identical to a given Mpmv, and the clustering analysis sug-gests that such similar elements were present in all mice tested.
Xmv elements have greater sequence variability than
Pmv or Mpmv elements. This likely reflects a younger age and more frequent exogenous replication cycles of both endogenous and exogenous Xmvs that will tend to diversify elements at a much higher rate than stable endogenous elements that evolve at the relatively slower mutational rate of the mammalian host. Thus, the criteria for classifying a specific Xmv as present were made less stringent, so that sequences were judged to be a match if they were more similar to a specific Xmv reference than they were to any other reference sequence (Table 3 and Additional file 1: Table S1). For example, among the reads of MLV target region 1 in C3H, the closest match to the Xmv17 reference sequence had 99.5 % identity. Among the reference Xmv sequences, the closest match had 96.5 % identity to Xmv17. Thus the sequence in C3H was scored as a slightly divergent Xmv17 since the C3H sequence had a greater similarity to Xmv17 than the per-cent similarity of any other reference sequence to Xmv17. In a few instances, a target region of the MLV genome was very similar across two or more reference Xmvs, e.g.
Xmv17 and Xmv12 were highly similar in several of the MLV genomic regions sequenced, and thus both were scored as present (Additional file 1: Table S1), although it is possible that only one of the proviruses was actually present.
Using the above criteria, Xmv42 was identified in all individuals examined, and it was the only Xmv detected in SJL and Mmd1 (Table 3). Xmv17 was found in C3H and Mmd2. Using similar criteria, there was evidence for the presence of the Xmv group PreXMRV-2 in all five mice tested (Table 4).
The reference sequences Xmv8, Xmv13, Xmv15, Pmv11,
Pmv20, Mpmv2, Mpvm9and Mpmv12 had been derived from distinct proviral loci present in C57BL6/J mice, for which the integration sites are known. We examined if any of these specific previously characterized proviral sequences were present in our mouse DNA samples. This investigation was not meant to be comprehensive as the expectation, particularly for feral mice, was that identi-cal proviral insertions would not be identified. Published primer pairs [4], with one primer based on the 5’ flank-ing region and one in the 5’ LTR, were used to determine if each individual proviral locus was present or absent in the mice. C3H, LP/J and SJL carried the integration site for Pmv11, in contrast with results reported in Frankel et al. 1989 [14]. C3H and SJL carried the Pmv20 inte-gration, consistent with Frankel et al. 1989 [14]. LP/J was positive for Xmv8 and SJL for Pmv20. None of the 5’ integration sites tested was identified as containing a provirus in either of the two wild mice, consis-tent with the absence of sequences with identity to these elements among the reads (data not shown). The exception was Mpmv9, which was present in
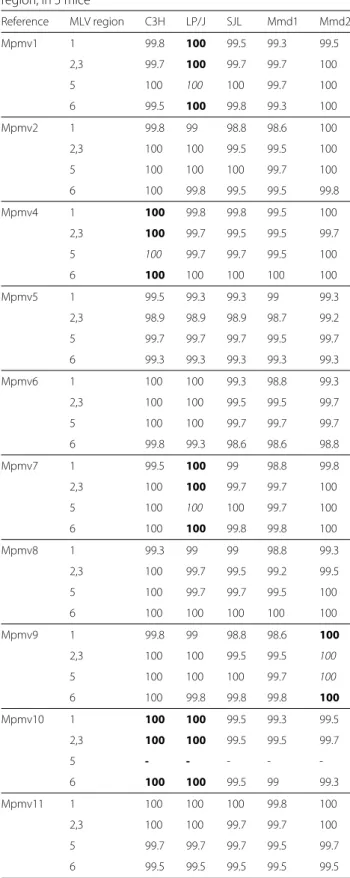
Table 1 Maximum match between polytropic murine leukemia
retrovirus (Pmv) and each next generation sequenced MLV region, in 5 mice Reference MLV region C3H LP/J SJL Mmd1 Mmd2 Pmv1 1 100 100 100 99.5 100 2,3 100 100 99.7 99.7 100 5 100 100 100 99.5 100 6 99.8 99.8 99.8 99.8 100 Pmv5 1 100 100 100 99.5 100 2,3 100 100 99.7 99.7 100 5 100 100 100 99.5 100 6 99.8 99.8 99.8 99.8 100 Pmv7 1 99.8 100 99.3 99.1 99.5 2,3 100 100 100 100 100 5 100 100 100 99.5 100 6 100 100 100 99.8 100 Pmv8 1 100 100 96.4 99.3 99.8 2,3 100 100 99.7 99.7 99.7 5 100 100 100 99.5 100 6 100 100 100 99.8 100 Pmv9 1 100 100 100 99.5 100 2,3 99.7 99.7 99.5 99.5 99.7 5 100 99.5 100 99.7 99.5 6 99.3 99.3 99.5 98.8 99.3 Pmv10 1 100 100 99.5 99.1 100 2,3 100 100 99.7 99.7 100 5 100 100 100 99.5 100 6 100 100 99.8 99.5 99.8 Pmv11 1 100 100 100 99.5 100 2,3 100 100 99.7 99.7 100 5 100 100 100 99.5 100 6 99.8 100 99.5 99.5 99.8 Pmv12 1 100 100 99.8 99.3 100 2,3 99.5 99.7 99.5 99.5 99.5 5 100 100 100 99.5 100 6 100 100 100 99.8 100 Pmv13 1 100 99.5 99.3 98.8 100 2,3 100 100 100 100 100 5 100 100 100 99.5 100 6 99.8 99.8 99.5 99.5 100 Pmv14 1 100 99.8 99.5 99.3 100 2,3 100 100 99.7 98.9 100 5 100 100 99.7 99.2 100 6 100 99.8 99.8 99.5 100
Table 1 Maximum match between polytropic murine leukemia
retrovirus (Pmv) and each next generation sequenced MLV region, in 5 mice (Continued)
Reference MLV region C3H LP/J SJL Mmd1 Mmd2 Pmv15 1 99.8 100 99.5 99.3 99.5 2,3 99.5 99.5 99.5 99.5 99.5 5 100 100 100 99.5 100 6 100 100 100 99.8 100 Pmv16 1 100 100 100 99.5 100 2,3 100 100 100 100 100 5 100 100 100 99.5 100 6 99.8 99.8 99.8 99.8 100 Pmv18 1 100 100 100 99.5 100 2,3 99.5 99.7 99.5 99.5 99.5 5 100 100 100 99.5 100 6 99.8 100 99.8 99.5 99.8 Pmv19 1 100 100 100 99.5 100 2,3 100 100 100 100 100 5 100 100 100 99.5 100 6 100 100 100 99.8 100 Pmv20 1 100 100 99.8 99.3 100 2,3 100 99.5 99.5 99.2 99.5 5 100 100 100 99.5 100 6 99.8 100 99.5 99.5 100 Pmv21 1 99.5 99.8 99.3 98.8 99.5 2,3 99.5 99.5 99.7 99.5 99.7 5 100 100 100 99.5 100 6 99.8 99.8 99.8 99.8 100 Pmv22 1 100 100 100 99.5 100 2,3 99.7 99.7 99.7 99.7 99.7 5 100 100 100 99.5 100 6 99.8 100 99.8 99.5 99.8 Pmv23 1 99.3 100 99.5 98.6 99.1 2,3 98.9 98.9 99.2 98.9 99.2 5 99.7 100 99.7 99.2 99.7 6 99.8 100 99.3 99.3 99.8 Pmv24 1 100 100 99.8 99.3 100 2,3 100 100 100 100 100 5 100 100 100 99.5 100 6 99.8 100 99.5 99.5 100
The use of boldface indicates that sequences with 100 % identity to a reference were detected for all MLV target regions in a mouse. The Pmv reference sequences are those of Bamunusinghe et al. [4]
Mmd2 (Table 2) suggesting that an identical provirus is located in a different genomic location in this feral mouse.
Table 2 Maximum match between polytropic murine leukemia
retrovirus (Mpmv) and each next generation sequenced MLV region, in 5 mice Reference MLV region C3H LP/J SJL Mmd1 Mmd2 Mpmv1 1 99.8 100 99.5 99.3 99.5 2,3 99.7 100 99.7 99.7 100 5 100 100 100 99.7 100 6 99.5 100 99.8 99.3 100 Mpmv2 1 99.8 99 98.8 98.6 100 2,3 100 100 99.5 99.5 100 5 100 100 100 99.7 100 6 100 99.8 99.5 99.5 99.8 Mpmv4 1 100 99.8 99.8 99.5 100 2,3 100 99.7 99.5 99.5 99.7 5 100 99.7 99.7 99.5 100 6 100 100 100 100 100 Mpmv5 1 99.5 99.3 99.3 99 99.3 2,3 98.9 98.9 98.9 98.7 99.2 5 99.7 99.7 99.7 99.5 99.7 6 99.3 99.3 99.3 99.3 99.3 Mpmv6 1 100 100 99.3 98.8 99.3 2,3 100 100 99.5 99.5 99.7 5 100 100 99.7 99.7 99.7 6 99.8 99.3 98.6 98.6 98.8 Mpmv7 1 99.5 100 99 98.8 99.8 2,3 100 100 99.7 99.7 100 5 100 100 100 99.7 100 6 100 100 99.8 99.8 100 Mpmv8 1 99.3 99 99 98.8 99.3 2,3 100 99.7 99.5 99.2 99.5 5 100 99.7 99.7 99.5 100 6 100 100 100 100 100 Mpmv9 1 99.8 99 98.8 98.6 100 2,3 100 100 99.5 99.5 100 5 100 100 100 99.7 100 6 100 99.8 99.8 99.8 100 Mpmv10 1 100 100 99.5 99.3 99.5 2,3 100 100 99.5 99.5 99.7 5 - - - - -6 100 100 99.5 99 99.3 Mpmv11 1 100 100 100 99.8 100 2,3 100 100 99.7 99.7 100 5 99.7 99.7 99.7 99.5 99.7 6 99.5 99.5 99.5 99.5 99.5
Table 2 Maximum match between polytropic murine leukemia
retrovirus (Mpmv) and each next generation sequenced MLV region, in 5 mice (Continued)
Reference MLV region C3H LP/J SJL Mmd1 Mmd2 Mpmv12 1 100 99.3 99 98.8 99.8 2,3 100 99.7 99.5 99.2 99.7 5 100 100 100 99.7 100 6 99.8 99.5 99.5 99.5 99.5 Mpmv13 1 99.8 99.8 99.8 99.5 99.8 2,3 99.5 99.5 99.5 99.2 99.7 5 99.5 99.5 99.5 99.2 100 6 100 100 100 100 100
The use of boldface indicates that sequences with 100 % identity to a reference were detected for all MLV target regions in a mouse. The use of italics indicates that more than one Mpmv sequence in a cluster was 100 % identical. Mpmv reference sequences are those of Bamunusinghe et al. [4]. A dash indicates that for a target MLV region, the region is deleted in the reference sequence relative to other MLV sequences
Xpr1 haplotypes
The mouse Xpr1 gene codes for the receptor for MLVs, which is an unusual G protein-coupled transmem-brane protein with 8 transmemtransmem-brane domains and four extracellular loops (ECLs) [8]. The C3H haplotype was similar to the Xpr1nhaplotype, which provides resistance to Xmv infection [19]. All other mice in this study carried an Xpr1svx haplotype which is generally permissive to exogenous MLV infection. We note here that infection by an exogenous retrovirus involves binding to a host cell receptor. This is distinct from the spread of endogenous retroviruses which, in some cases, can be transmitted hor-izontally by infection if the proviral loci are capable of producing infectious virus but generally are transmitted vertically by inheritance. Sequencing of coding sequences for ECL 3, ECL 4 and Exon 4 in the 5 mice revealed that, relative to the other 3 mice, C3H and LP/J shared a haplotype in Exon 4 that changes an amino acid each at positions 103 (A/G) and 106 (A/T), with a synony-mous substitution at position 105 (Table 5). C3H differed from LP/J and the other mice in ECL 3 by a unique non-synonymous substitution at position 500 (K/E). C3H had a unique ECL 4 sequence exhibiting a one amino acid dele-tion at posidele-tion 583 and a unique substitudele-tion at posidele-tion 590 (D/N). Thus, while LP/J and C3H were most similar to each other relative to the other mice in terms of clus-ter content, they still exhibited divergent Xpr1 haplotypes. SJL, Mmd1 and Mmd2 shared the same Xpr1 haplotype, with the exception of a substitution at position 503 (K/N) in SJL relative to Mmd1 and Mmd2 (Table 5). Thus the
Xpr1haplotype did not correspond to MLV cluster pat-terns, in which Mmd1 and SJL were similar in sequence cluster profile with a few exceptions across the MLV target regions, while Mmd2 exhibited a unique profile relative to SJL and Mmd1.
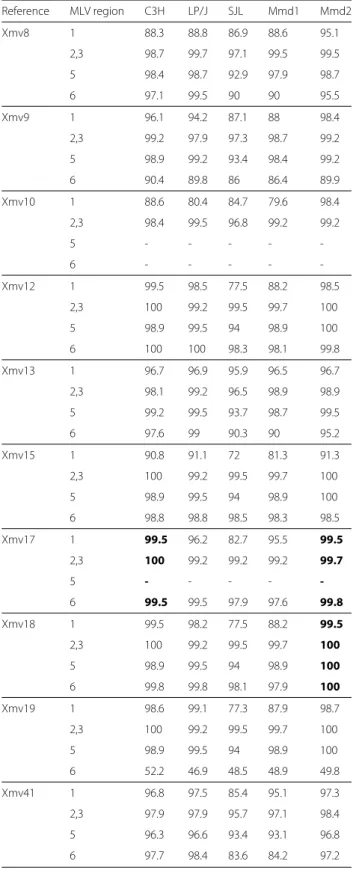
Table 3 Maximum match between xenotropic murine leukemia
retrovirus (Xmv) and each next generation sequenced MLV region, in 5 mice Reference MLV region C3H LP/J SJL Mmd1 Mmd2 Xmv8 1 88.3 88.8 86.9 88.6 95.1 2,3 98.7 99.7 97.1 99.5 99.5 5 98.4 98.7 92.9 97.9 98.7 6 97.1 99.5 90 90 95.5 Xmv9 1 96.1 94.2 87.1 88 98.4 2,3 99.2 97.9 97.3 98.7 99.2 5 98.9 99.2 93.4 98.4 99.2 6 90.4 89.8 86 86.4 89.9 Xmv10 1 88.6 80.4 84.7 79.6 98.4 2,3 98.4 99.5 96.8 99.2 99.2 5 - - - - -6 - - - - -Xmv12 1 99.5 98.5 77.5 88.2 98.5 2,3 100 99.2 99.5 99.7 100 5 98.9 99.5 94 98.9 100 6 100 100 98.3 98.1 99.8 Xmv13 1 96.7 96.9 95.9 96.5 96.7 2,3 98.1 99.2 96.5 98.9 98.9 5 99.2 99.5 93.7 98.7 99.5 6 97.6 99 90.3 90 95.2 Xmv15 1 90.8 91.1 72 81.3 91.3 2,3 100 99.2 99.5 99.7 100 5 98.9 99.5 94 98.9 100 6 98.8 98.8 98.5 98.3 98.5 Xmv17 1 99.5 96.2 82.7 95.5 99.5 2,3 100 99.2 99.2 99.2 99.7 5 - - - - -6 99.5 99.5 97.9 97.6 99.8 Xmv18 1 99.5 98.2 77.5 88.2 99.5 2,3 100 99.2 99.5 99.7 100 5 98.9 99.5 94 98.9 100 6 99.8 99.8 98.1 97.9 100 Xmv19 1 98.6 99.1 77.3 87.9 98.7 2,3 100 99.2 99.5 99.7 100 5 98.9 99.5 94 98.9 100 6 52.2 46.9 48.5 48.9 49.8 Xmv41 1 96.8 97.5 85.4 95.1 97.3 2,3 97.9 97.9 95.7 97.1 98.4 5 96.3 96.6 93.4 93.1 96.8 6 97.7 98.4 83.6 84.2 97.2
Table 3 Maximum match between xenotropic murine leukemia
retrovirus (Xmv) and each next generation sequenced MLV region, in 5 mice (Continued)
Reference MLV region C3H LP/J SJL Mmd1 Mmd2 Xmv42 1 99.1 99.1 98.6 98.8 99.5 2,3 99.2 98.9 99.2 99.5 99.5 5 - - - - -6 99 99.3 99 99 99.3 Xmv43 1 98.3 98.5 86.3 96.3 98.3 2,3 98.4 98.4 96.3 97.6 98.9 5 98.7 99.2 93.7 98.7 99.7 6 98.6 98.4 84.6 84.7 98.4
The use of boldface indicates that across all MLV target regions, the generated sequence read was more similar to the Xmv reference than were other Xmv references. Xmv reference sequences are those of Bamunusinghe et al. [4]. A dash indicates that for a target MLV region, the region is deleted in the reference sequence relative to other MLV sequences
Discussion
In this study we generated approximately 100,000 NGS reads covering five different proviral regions found in most MLVs. The approach applied here identified clus-ters of similar sequences that were present in just a single mouse from different mouse strains, as well as clusters and patterns of clusters that were shared across mice. For an inventory and description of retroviral vari-ants based on NGS-derived sequence data, this approach had advantages over a conventional approach of align-ing the generated sequence reads together with reference sequences, inferring a phylogeny, and analyzing the result-ing clades with respect to the presence and absence of ref-erence sequences and reads from specific samples of mice. Given sufficient computational resources [20], this type of standard phylogenetic analysis is possible using NGS-derived data sets consisting of thousands of sequence reads, although not without significant challenges. These include difficulties of aligning massive data sets to pro-duce accurate phylogenies [21] and the interpretation of phylogenetic trees that are so large that individual clades are obscured and tracking individual samples is difficult. Clustering is computationally less taxing than alignment and tree building, and the results are easy to compare across mice (Fig. 1).
Results of clustering sequences showed that most of the MLV variation was in the LTRs, and thus the sequences from target regions 1 and 6 (which each included part of an LTR) formed the greatest number of clusters (Fig. 1). Overall, the C3H, LP/J and Mmd2 mice were similar among all the MLV target regions in the clusters they shared, while SJL and Mmd1 formed a second group (Fig. 1). These two groupings of mice are consistent with the patterns observed previously, when MLV inser-tional patterns were compared among mouse strains [4].
Table 4 Identity to XMRV-like sequences
MLV Target C3H LP/J SJL Mmd1 Mmd2 PreXMRV1 PreXMRV2 XMRV
PreXMRV1 1 96.6 96.6 84.9 96.3 94.1 100 90.8 98.3 2,3 99.7 99.2 92 99.2 95.2 100 91.2 92.3 5 98.7 98.9 92.9 99.2 92.6 100 91.1 92.2 6 96.5 97.4 83.4 96.5 83.3 100 78.7 86.5 PreXMRV2 1 100 100 96.6 100 97.2 90.8 100 92.4 2,3 100 100 99.5 100 99.5 91.2 100 98.9 5 100 100 99.7 100 99.5 91.1 100 89.8 6 99.5 100 95.4 99.7 95.1 78.7 100 91.6 XMRV 1 97.3 97.3 86.5 97.3 95.6 98.3 92.4 100 2,3 98.9 98.9 98.4 98.9 98.9 92.3 98.9 100 5 95.8 95.8 92.8 95.5 92.6 92.2 89.8 100 6 93.1 96.8 88.6 94.9 90 86.5 91.6 100
The use of boldface indicates that across all MLV target regions, a generated sequence read was more similar to the reference than were other XMRV references. Although in this table, PreXMRV1 could be predicted to be present in C3H, LP/J and Mmd1, Xmv43 exhibited higher identity to several breakpoints than the sequences obtained from the mice in this study. Thus, we cannot conclude that any of these mice carry PreXMRV1
The dissimilar MLV sequences detected between Mmd1 (Corsica) and Mmd2 (mainland France) likely reflect the lack of gene flow between their populations. ERVs are transmitted by gene flow, their presence or absence depending on population structure. Xpr1 allelic differ-ences may strongly affect infectious exogenous MLVs, as replication would depend on successful cell entry by individual viruses. However, endogenous MLVs inherited genetically would not face cellular restriction by Xpr1.
XMRV was not identified in any sample, as expected of a virus that is a laboratory artifact. However, our results only partially overlap with work previously published on C3H examining specific integration sites by Southern blot [14]. Pmv8, Pmv10, and Pmv14 were detected in C3H in both studies and Pmv1, Pmv5, Pmv7, Pmv9, Pmv11,
Pmv12, Pmv18, Pmv21, Pmv22and Pmv23 were absent
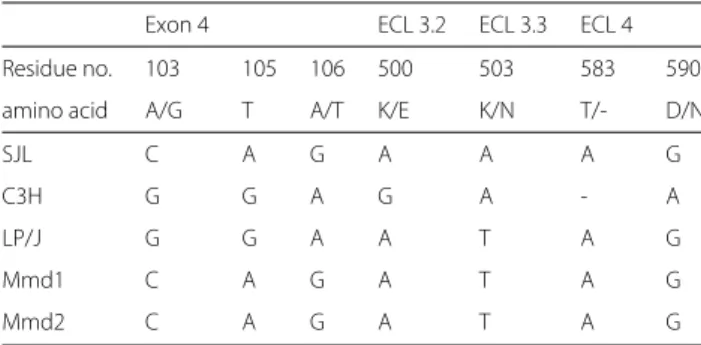
Table 5 Haplotype diversity of the Xpr1 gene across five mice
Exon 4 ECL 3.2 ECL 3.3 ECL 4 Residue no. 103 105 106 500 503 583 590
amino acid A/G T A/T K/E K/N T/- D/N
SJL C A G A A A G
C3H G G A G A - A
LP/J G G A A T A G
Mmd1 C A G A T A G
Mmd2 C A G A T A G
ECL3 and 4 stand for the third and forth extracellular loop of Xpr1. The residue numbers indicate the positions in the primary sequence of the XPR1 protein, whereas the row below (amino acid) shows which kind of change occurs. The nucleotide changes are also shown below to give an impression on the amount of synonymous and nonsynonymous variation among the five analyzed mice. A dash stands for a missing nucleotide at the respective position relative to all other shown sequences
in both studies, although in the case of Pmv1 and Pmv9, distinguishing the individual ERVs was difficult from the results of Frankel et al. 1989 [14]. However, Pmv13,
Pmv15, Pmv20 and Pmv24 were detected using Southern blot [14] but were not detected in our study under the criterion applied. Pmv19 was detected in the present study but not found by Frankel et al. 1989 [14]. It should again be emphasized that Frankel et al. 1989 [14] determined the presence of specific ERV integrations, while the cur-rent study determines the presence or absence of a specific viral lineage. For C3H the results were in agreement with a previous study [12] for presence of Mpmv10. Simi-larly, Mpmv1, Mpmv2, Mpmv5, Mpmv8, and Mpmv9 were absent in both data sets. In contrast, Mpmv4 was present in the current study and Mpmv6 and Mpmv7 were iden-tified in Frankel et al. 1990 [12] but not in the current study. The presence of Xmv17 and the absence of Xmv8,
Xmv9, Xmv13, Xmv15, and Xmv41 is consistent between our study and previously reported results [13]. However, the absence of Xmv12 and the presence of Xmv42 in the current study are not.
Other findings were surprising in light of previous reports. SJL and Mmd1 both shared sequences resembling
Xmv42, which was the only Xmv identified in these two mice. This is surprising as Southern blot hybridization and restriction fragment length results have previously sug-gested that Xmv42 derived from M. m. molossinus [22], yet the current results showed it to be also present in feral
M. m. domesticus. Substantial numbers of Xmv, Pmv or
Mpmvelements were detected in the mice, whereas pre-vious reports have suggested that these elements should be rare among European mice based on Southern blot and restriction digestion experiments [9], or based on analy-sis of specific loci known to carry Xmv, Pmv or Mpmv
[4]. In fact, C3H, the only strain examined in common with the current study and previous work performed by Southern blot looking at specific ERV integrations while demonstrating some common sequences, contrasted in several cases for Pmv, Mpmv and Xmv elements. This extended to the PCR based amplification of two Pmvs where Pmv20 was identified in both studies but Pmv11 was only identified in the current study in C3H [14]. This suggests that C3H integrations may be polymorphic within the strain. These results also suggest determina-tion of presence or absence of a specific ERV lineage cannot be achieved by examining specific integrations alone. Identical or closely related sequences may have entered individual mice or mouse lineages by separate integration events and thus, the same sequences may be located in different parts of the genome.
PreXMRV-2 was found in all samples. Using hybridiza-tion and integrahybridiza-tion-specific PCR, a previous study [7] suggested that none of these three types of mice should have co-occurring PreXMRV-1 and 2, and that European
Mus would be expected to carry PreXMRV-2, consis-tent with the results here. In each case where the results may seem surprising, they may be attributed either to the much higher coverage provided by NGS, or to sim-ilar sequences being shared across many proviral loci. Even if a particular locus may not be present in a given mouse or population as established by Southern blot or locus-specific PCR, similar MLV sequences may be present across multiple loci. Thus strains and populations of mice are more likely to share similar sequences (com-mon to many loci) than to share particular integration sites (single locus). As mentioned above, Xpr1 alleles may effectively inhibit specific retroviral lineages from infect-ing cells when transmitted horizontally, but are ineffec-tual at inhibiting viral introgression when transmission is vertical.
Conclusions
Cluster analysis of sequence data provided both com-putational and visualization advantages for a large and complex endogenous retroviral data set, compared to standard phylogenetic analysis. As much of the genome of multicellular species is composed of complex repeti-tive elements, this approach allowed us to analyze similar high-copy genomic elements even when identity among them is high. Analysis of sequence clusters and interroga-tion of the data with specific references revealed that MLV composition is highly variable among both inbred and wild mice. Elements identical or closely related to fixed integration sites in the C57BL6/J genome were found to be more widespread and variable in distribution in both laboratory mice and wild mice than expected. The discord between the MLV tropism determining Xpr1 gene haplo-types and MLV distribution suggests that gene flow plays
a more important role in MLV genomic colonization in mice than infection.
Methods Mouse DNA
Genomic DNA from C3H/HeJ, LP/J, and SJL/J was kindly provided by John L. Goodier (McKusick-Nathans Institute of Genetic Medicine, Johns Hopkins School of Medicine, Baltimore MD, USA). The DNA had been originally obtained from the Jackson Laboratory. DNA from Mus
musculus domesticus wild caught in Corsica (Mmd1) and mainland France (Mmd2) was generated as part of research by Johan Michaux and Serge Morand on mammals from the western Mediterranean islands [23, 24]. All animal experiments were performed accord-ing to the directive 2010/63/EEC on the Protection of Animals Used for Experimental and Other Scientific Purposes. The animal work also complied with French law (nu 2012 ˝U10 dated 05/01/2012 and 2013-118 dated 01/02/2013). The rodents, Mus musculus domesticus, were captured using Sherman traps and the study of mice did not require the approval of an ethics commit-tee (European directives 86-609 CEE and 2010/63/EEC).
Mus musculus is not protected, and no experiment was performed on living animals. No permit approval was needed as this species was trapped outside any pre-serve areas (national parks or natural repre-serves). The rodents were euthanized by vertebrate dislocation imme-diately after capture, in agreement with the legislation and the ethical recommendations (2010/63/EEC annexe IV) (see also protocol available on http://www.ceropath. org/references/rodent_protocols_book). All experimental protocols involving animals were carried out by qualified personnel (accreditation number of the Center of Biology and Management of the Populations (CBGP) for wild and inbred animal manipulations: A34-1691).
PCR
Primer pairs for five MLV target regions were designed such that each primer pair generated PCR products of approximately 400 bp in length to match but not exceed the maximum read length of the GS FLX chem-istry available at the time of sequence data generation. XMRV is the result of at least 6 recombination events between PreXMRV-1 and PreXMRV-2 [5] in mouse cells that infected human cell cultures. To avoid biasing the amplification for or against any one provirus type, all primers were designed in regions conserved in all known XMRV, PreXMRV-1 and PreXMRV-2 sequences and most MLVs in general. The primers were also designed so that the putative XMRV recombination crossover sites were in the middle of the PCR products, to maximize the number of informative differences up- and down-stream of the crossovers. The four target regions on the
MLV proviral genome for which sufficient coverage was obtained are shown in Fig. 1. Target position 2 included a region of the gag leader sequence containing a 24 bp deletion characteristic of XMRV and PreXMRV-2. Primer sequences were as follows: PCR product 1 (recombination site 1) (Forward 5’ ATT CTC AAC CGC TTG GTC CA 3’, Reverse 5’ TAA GGC TTG GGG TAT TTC CC 3’), PCR product 2 and 3 (recombination sites 2 and 3) (Forward 5’ AAA TCA GTC AGT GCC CTA GA 3’, Reverse 5’ TGA GTT GGT GAT ACT GTT GG 3’), PCR product 4 (crossover site 4) (Forward 5’ AGT TCC CAA AAC CCA TCA GG 3’, Reverse 5’ TTT TCT AAG GCC CCA AGG TC 3’), PCR product 5 (recombination site 5) (Forward 5’ AAG CAG GGC TAC GCC AAA GG 3’, Reverse 5’ TGG TCC GTG AGG TCC GGT CT 3’), PCR product 6 (recombination site 6) (Forward 5’ TCC TTG GGA GGG TCT CCT CA 3’, Reverse 5’ CGG TTT CGG CGW AAA ACC GA 3’). PCR was performed using Invitrogen Taq Polymerase using standard supplied buffers. Cycling con-ditions were 3 minutes 94 °C followed by 40 cycles of 30 sec 94 °C, 45 sec 54 °C and 45 sec 72 °C with a final 10 minute 72 °C extension. Water controls were always run as negative controls for PCR (data not shown). Contam-ination, especially from PCR reagents, was not detected at any point. Triplicate PCR products were pooled and purified using the QIAquick PCR Purification Kit (Qiagen).
Sequencing
PCRs were performed in triplicate to minimize the inherent amplification bias of any given PCR of multicopy loci. The PCR products were verified by gel electrophore-sis and, based on the intensity of the products, pooled in equal amounts for each of the three reactions. Each pool had a unique multiplex identifier (MID) (Roche Life Sciences) ligated to the products, which allowed for com-putational sorting of reads by animal post-sequencing. A 1/8 plate 454 FLX Titanium run was used to gener-ate sequence data. The 454 sequence reads genergener-ated in this study were separated by MID using sfftools (Roche Life Sciences) for standard MIDs. Low quality reads were excluded from the analysis, resulting in a data set of approximately 103,761 reads.
Xpr1 amplifications and sequencing
Five primer pairs were used to amplify and Sanger sequence several coding subregions of Xpr1. Primer sequences were as follows: exon 4 Forward 5’ GGG CCA AAA TGC TTT CTC TT 3’, Reverse 5’ TGA TTT CAA TCT TTA GAG GAT TCA GT 3’; ECL3.1 (part of exon 10) Forward 5’ TCC ATA AGG TAG GCT TTG CTG 3’, Reverse 5’ TCT TGG TTT ATG CTG GCA ATC 3’; ECL3.2 (exon 11) Forward 5’ CAC ACA CTG ATG GGG AGT TG 3’, Reverse 5’ GCA AAG TCC AGG AAA GCA
GA 3’; ECL3.3 (part of exon 12) Forward 5’ TGG GCA CTA TGA AGA ATC CA 3’, Reverse 5’ GAG ACC CCA GTC CAT CTT GA 3’; ECL4 (part of exon 13) Forward 5’ AAC GCT TCT CCA TGA GTC TTT G 3’, Reverse 5’ GAT CAG ACT TGG TAT AAG TGT CT 3’. PCR was performed using the Qiagen Multiplex PCR Kit. For the reaction, 5 ng genomic DNA was applied to a reaction mix containing 1x Qiagen Multiplex PCR Mastermix and 0.2μM of each primer (Metabion) in a final volume of 10μl. The cycling conditions were 95 °C for 15 min fol-lowed by 40 cycles of 30 sec 95 °C, 1:30 min 60 °C, 1 min 72 °C with a final 10 min 72 °C extension. Water controls were run for each primer pair to control for contamina-tion. An aliquot of the PCR product was visualized on a 1 % agarose gel, and the remaining product was purified. Cycle sequencing was carried out with the Big Dye Ter-minator v3.1 Cycle Sequencing Kit. For the sequencing, 1
μl PCR product was used in a reaction mix of the
stan-dard kit supplies and 0.5μM primer in a final volume of 10μl. The cycling conditions were 96 °C for 1 min, fol-lowed by 25 cycles of 10 sec 95 °C, 15 sec 55 °C and 4 min 60 °C. Samples were purified by means of the BigDye XTerminator Purification Kit (Applied Biosystems) and then run on a 3730 DNA Analyzer (Applied Biosystems). Sequences were visualized and edited using CodonCode Aligner (CodonCode Corporation).
Clustering analysis
For each mouse, cd-hit-est [25] was used to remove redun-dant reads at 100 % sequence identity, resulting in a reduc-tion from 103,761 to 69,201 sequence reads. In addireduc-tion, sequences shorter than 250 bp were removed, resulting in a final data set of 55,979 sequence reads. This data was combined with a set of 204 unique reference sequences from representative Xmv, Pmv and Mpmv MLVs (target region 1: 47 reference sequences, targets 2-3: 46, target 4: 37, target 5: 30, target 6: 44) into a single file and used to generate a matrix of pairwise BLASTN E-values [18]. The software Tribe-MCL [17] was then used to cluster sequences into families with an inflation value of 9. Tribe-MCL uses a Markov cluster (Tribe-MCL) algorithm. In this approach, pairwise sequence similarity information for a set of sequences is used to construct a weighted graph, which is then converted into a Markov matrix. Next, sim-ulation of stochastic flow in graphs is used to iteratively expand and inflate this matrix, with the goal of adjusting the edges until discrete and fully connected clusters are evident.
Sequence clusters that contained reference sequence matches for target regions 1, 2, 3, 4, 5 and 6 were directly used for further analysis. BLAST was used to assign ref-erence sequences to all families with at least 50 sequences to which no reference was assigned during the cluster-ing step. Specifically, each sequence in these families was
compared to a database of the reference sequences, and the single best match with an E-value of at least 1-20 was recorded. This information was combined for each family, resulting in an assignment of reference sequences to families to which no reference was assigned during clustering.
Assignment of sample sequences to specific reference sequences
For two separate sets of reference sequences (1. XMRV consensus, PreXMRV-1, PreXMR-2 [7]; 2. Xmv, Pmv and Mpmv sequences [4]), we computed the pairwise sequence identity among the reference sequences as well as between the reference sequences and the most similar sample sequence from each mouse. For the latter values, the single most similar sample sequence to each reference from each mouse for each MLV target region was first identified using BLASTN. Subsequently, pairwise iden-tities were computed from pairwise optimal alignments using the water program of the EMBOSS package [26]. Computational analyses were implemented using custom Perl scripts that made use of BioPerl [27].
Availability of supplementary material and data
Supplementary material is available as additional files through BioMed Central. The set of 55,979 sequence reads used for the analysis has been submitted to Dryad (http://datadryad.org).
Additional file
Additional file 1: Pairwise distances for all reference sequences. For
the PCR products 1, 2,3, 5, and 6, percentage of pairwise sequence identity was computed from optimal pairwise global alignments for the reference sequences from Kozak et al. [9] and the XMRV consensus, PreXMRV-1, and PreXMR-2 sequences. The XMRV consensus represents the majority consensus sequence of all avaialable XMRV sequences in GenBank for the regions covered by the PCR products. “DEL” indicates that for the specific provirus, this region of the genome is deleted in the region covered by the PCR product.
Abbreviations
ERV: Endogenous Retrovirus; NGS: Next generation sequencing; M. m.
domesticus: Mus musculus domesticus; Mmd1: M. m. domesticus from Corsica;
Mmd2: M. m. domesticus from mainland France; MLVs: Murine leukemia retroviruses; Mpmv: Modified polytropic MLVs; Pmv: Polytropic MLVs; Xmv: Xenotropic MLVs; XMRV: Xenotropic like murine retrovirus; XPR1: Xenotropic and polytropic retrovirus receptor 1.
Competing interests
The authors declare that they have no competing interests.
Authors’ contributions
Conceived and designed experiments: SH, JMa, DT, ADG. Organized and performed experiments: JMa, NH. Analyzed data: SH, CM. Caught and provided feral mouse samples: JMi, SM Wrote the paper: SH, ALR, ADG. All authors read and approved the final manuscript.
Acknowledgements
The authors thank Diethard Tautz, Pin Cui, Kyriakos Tsangaras, Karin Hönig, Susan Mbedi, and Esther Maldener for excellent advice and technical support, and John L. Goodier (McKusick-Nathans Institute of Genetic Medicine, Johns Hopkins School of Medicine, Baltimore MD, USA) for providing DNA from mouse inbred strains. The high-throughput sequencing was performed at the Berlin Center for Genomics in Biodiversity Research (BeGenDiv). Funding for the project came from a seed funding program from University of Saarland (JM). JM is furthermore supported by grants from DFG. ADG and ALR were supported by Grant Number R01GM092706 from the National Institute of General Medical Sciences (NIGMS). The content is solely the responsibility of the authors and does not necessarily represent the official views of the NIGMS or the National Institutes of Health.
Author details
1Institute of Biochemistry and Biology, University of Potsdam,
Karl-Liebknecht-Str 22-24, 14476 Potsdam, Germany.2Department of Evolutionary Genetics,
Max-Planck-Institute for Evolutionary Biology, August-Thienemann-Str. 2, 24306 Plön, Germany.3Department of Human Genetics, Center of Human and
Molecular Biology, Medical Faculty, University of Saarland, Building 60, 66421 Homburg, Germany.4Centre de Biologie et de Gestion des Populations,
Campus International de Baillarguet, CS 30016, 34988 Montferrier-le-Lez, France.5Conservation Genetics Unit, Institute of Botany (B. 22), University
Liège, 4000 Liège, Belgium.6CIRAD TA C- 22 / E - Campus international de
Baillarguet, 34398 Montpellier Cedex 5, France.7Berlin Center for Genomics in
Biodiversity Research, Königin-Luise-Str. 6-8, 14195 Berlin, Germany.8Leibniz
Institute for Zoo and Wildlife Research, Alfred-Kowalke-Straße 17, 10315 Berlin, Germany.9Department of Animal Sciences, University of Illinois at
Urbana-Champaign, 1207 W. Gregory, 61801 Urbana, IL, USA. Received: 8 December 2014 Accepted: 10 July 2015
References
1. Jern P, Stoye JP, Coffin JM. Role of apobec3 in genetic diversity among endogenous murine leukemia viruses. PLoS Genet. 2007;3(10):2014–2. doi:10.1371/journal.pgen.0030183.
2. Hué S, Gray ER, Gall A, Katzourakis A, Tan CP, Houldcroft CJ, et al. Disease-associated xmrv sequences are consistent with laboratory contamination. Retrovirology. 2010;7(1):111. doi:10.1186/1742-4690-7-111.
3. Mayer J, Mazzoni CJ, Greenwood AD. Comparing prexmrv-2 gag sequence diversity in laboratory and wild mice using deep sequencing. Virus Res. 2012;169(1):30–7. doi:10.1016/j.virusres.2012.06.026. 4. Bamunusinghe D, Liu Q, Lu X, Oler A, Kozak CA. Endogenous
gammaretrovirus acquisition in Mus musculus subspecies carrying functional variants of the xpr1 virus receptor. J Virol. 2013;87(17):9845–55. doi:10.1128/JVI.01264-13.
5. Paprotka T, Delviks-Frankenberry KA, Cingöz O, Martinez A, Kung HJ, Tepper CG, et al. Recombinant origin of the retrovirus xmrv. Science. 2011;333(6038):97–101. doi:10.1126/science.1205292.
6. Kearney MF, Spindler J, Wiegand A, Shao W, Anderson EM, Maldarelli F, et al. Multiple sources of contamination in samples from patients reported to have xmrv infection. PLoS One. 2012;7(2):30889. doi:10.1371/journal.pone.0030889.
7. Cingöz O, Paprotka T, Delviks-Frankenberry KA, Wildt S, Hu WS, Pathak VK, et al. Characterization, mapping, and distribution of the two xmrv parental proviruses. J Virol. 2012;86(1):328–8. doi:10.1128/JVI.06022-11. 8. Tailor CS, Nouri A, Lee CG, Kozak C, Kabat D. Cloning and
characterization of a cell surface receptor for xenotropic and polytropic murine leukemia viruses. Proc Natl Acad Sci USA. 1999;96(3):927–32. 9. Kozak CA. The mouse “xenotropic” gammaretroviruses and their xpr1
receptor. Retrovirology. 2010. 1990;7:101. doi:10.1186/1742-4690-7-101. 10. Yan Y, Liu Q, Kozak CA. Six host range variants of the
xenotropic/polytropic gammaretroviruses define determinants for entry in the xpr1 cell surface receptor. Retrovirology. 2009;6:87. doi:10.1186/ 1742-4690-6-87.
11. Yan Y, Liu Q, Wollenberg K, Martin C, Buckler-White A, Kozak CA. Evolution of functional and sequence variants of the mammalian xpr1
receptor for mouse xenotropic gammaretroviruses and the human-derived retrovirus xmrv. J Virol. 2010;84(22):11970–80. doi:10.1128/JVI.01549-10.
12. Frankel WN, Stoye JP, Taylor BA, Coffin JM. A linkage map of endogenous murine leukemia proviruses. Genetics. 1990;124(2):221–36. 13. Frankel WN, Stoye JP, Taylor BA, Coffin JM. Genetic analysis of
endogenous xenotropic murine leukemia viruses: association with two common mouse mutations and the viral restriction locus fv-1. J Virol. 1989;63(4):1763–74.
14. Frankel WN, Stoye JP, Taylor BA, Coffin JM. Genetic identification of endogenous polytropic proviruses by using recombinant inbred mice. J Virol. 1989;63(9):3810–21.
15. Belshaw R, Watson J, Katzourakis A, Howe A, Woolven-Allen J, Burt A, et al. Rate of recombinational deletion among human endogenous retroviruses. J Virol. 2007;81(17):9437–42. doi:10.1128/JVI.02216-06. 16. Cucchi T, Auffray JC, Vigne JD. History of house mouse synanthropy and
dispersal in the Near East and Europe In: Macholán M, Baird SJE, Munclinger P, Piálek J, editors. Evolution in Our Neighbourhood: The House Mouse as a Model in Evolutionary Research. Cambridge, UK: Cambridge University Press; 2015.
17. Enright AJ, Van Dongen S, Ouzounis CA. An efficient algorithm for large-scale detection of protein families. Nucleic Acids Res. 2002;30(7):1575–84.
18. Altschul SF, Gish W, Miller W, Myers EW, Lipman DJ. Basic local alignment search tool. J Mol Biol. 1990;215(3):403–10. doi:10.1016/ S0022-2836(05)80360-2.
19. Baliji S, Yan Y, Nishimura Y, Liu Q, Martin C, Lafont B, et al. Mouse "xenotropic" gammaretroviruses, xmrv and their xpr1 receptor. Retrovirology. 2011;8(Suppl 2):017.
20. Liu K, Linder CR, Warnow T. Raxml and fasttree: comparing two methods for large-scale maximum likelihood phylogeny estimation. PLoS One. 2011;6(11):27731. doi:10.1371/journal.pone.0027731.
21. Liu K, Linder CR, Warnow T. Multiple sequence alignment: a major challenge to large-scale phylogenetics. PLoS Curr. 2010;2:1198. doi:10.1371/currents.RRN1198.
22. Tomonaga K, Coffin JM. Structure and distribution of endogenous nonecotropic murine leukemia viruses in wild mice. J Virol. 1998;72(10):8289–300.
23. Michaux JR, Goüy De Bellocq J, Sarà M, Serge M. Body size increase in insular rodent populations: a role for predators? Global Ecol. Biogeography. 2002;Vol 11(Vol 11):427–36.
24. Nieberding C, Libois R, Morand S, Michaux JR. Parasites and the island syndrome : the colonisation of the western Mediterranean islands by heligmosomoides polygyrus (Dujardin, 1845). J Biogeography. 2006;10:1365–1376.
25. Fu L, Niu B, Zhu Z, Wu S, Li W. Cd-hit: accelerated for clustering the next-generation sequencing data. Bioinformatics. 2012;28(23):3150–2. doi:10.1093/bioinformatics/bts565.
26. Rice P, Longden I, Bleasby A. Emboss: the European Molecular Biology Open Software Suite. Trends Genet. 2000;16(6):276–7.
27. Stajich JE, Block D, Boulez K, Brenner SE, Chervitz SA, Dagdigian C, et al. The bioperl toolkit: Perl modules for the life sciences. Genome Res. 2002;12(10):1611–8. doi:10.1101/gr.361602.
Submit your next manuscript to BioMed Central and take full advantage of:
• Convenient online submission
• Thorough peer review
• No space constraints or color figure charges
• Immediate publication on acceptance
• Inclusion in PubMed, CAS, Scopus and Google Scholar
• Research which is freely available for redistribution
Submit your manuscript at www.biomedcentral.com/submit