HAL Id: hal-02317438
https://hal.inria.fr/hal-02317438
Submitted on 16 Oct 2019
HAL is a multi-disciplinary open access archive for the deposit and dissemination of sci-entific research documents, whether they are pub-lished or not. The documents may come from teaching and research institutions in France or abroad, or from public or private research centers.
L’archive ouverte pluridisciplinaire HAL, est destinée au dépôt et à la diffusion de documents scientifiques de niveau recherche, publiés ou non, émanant des établissements d’enseignement et de recherche français ou étrangers, des laboratoires publics ou privés.
Dynamical synapses in the retina
Simone Ebert
To cite this version:
HAL Id: hal-02289415
https://hal.inria.fr/hal-02289415
Submitted on 16 Sep 2019
HAL is a multi-disciplinary open access archive for the deposit and dissemination of sci-entific research documents, whether they are pub-lished or not. The documents may come from teaching and research institutions in France or abroad, or from public or private research centers.
L’archive ouverte pluridisciplinaire HAL, est destinée au dépôt et à la diffusion de documents scientifiques de niveau recherche, publiés ou non, émanant des établissements d’enseignement et de recherche français ou étrangers, des laboratoires publics ou privés.
DYNAMICAL SYNAPSES IN THE RETINA
Simone Ebert, Bruno Cessac, Olivier Marre, Romain Veltz
To cite this version:
Simone Ebert, Bruno Cessac, Olivier Marre, Romain Veltz. DYNAMICAL SYNAPSES IN THE RETINA. [Research Report] Inria - Sophia Antipolis; Universite Cote d’Azur. 2019. �hal-02289415�
DYNAMICAL SYNAPSES IN THE RETINA
Simone EbertMSc. Mod4NeuCog, UCA
BIOVISON, Inria Sophia Antipolis Mediteraneé
07.06.2019
Supervised by
Inhaltsverzeichnis
INTODUCTION ... 3
THE RETINA –STRUCTURE,CIRCUITRY AND COMPUTATIONS ... 3
THE OMITTED STIMULUS RESPONSE ... 5
RELEVANT RETINAL CIRCUITRY AND EXISTING MODELS ... 6
AIM OF THIS STUDY ... 7
METHODS ... 7
DUAL LINEAR-NONLINEAR MODEL ... 8
From input to bipolar cell response ... 8
From Ganglion cell input to output ... 9
CALCIUM-TUNED OSCILLATOR MODEL ... 10
IMPLEMENTATION OF EXISTING MODELS ... 13
RESULTS ... 14
DUAL LINEAR NONLINEAR MODEL ... 14
Mechanisms of the model ... 14
Differences to the publication ... 15
CALCIUM-TUNED OSCILLATOR MODEL ... 15
Differences in functioning stimulus frequencies ... 16
Differences in the latency timing of the OSR ... 17
Differences in the calcium concentration ... 17
Additional simulations ... 18
Modifications of the model ... 19
DISCUSSION ... 21 OUTLOOK ... 22 CONCLUSION ... 22 REFERENCES ... 23 SUPPLEMENTARY FIGURES ... 24 1. LINEAR FILTERING ... 24
2. APPROXIMATION OF LINEAR FILTER ... 25
3. SOLVING THE LRC CIRCUIT SYSTEM OF DIFFERENTIAL EQUATIONS ... 25
INTODUCTION
The Retina – Structure, Circuitry and Computations
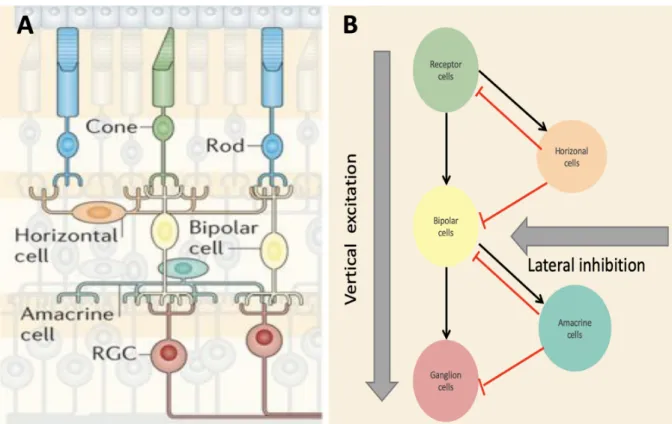
The retina is the interface between our brain and the visual environment around us. As the first step in the perception of visual information, it translates the sensory input into trains of action potentials (spikes trains) that are transmitted to the rest of the brain. It is a sensory organ of fascinating complexity and relatively well known anatomical connectivity (Masland, 2001). Considering the vast amount of visual information that we are constantly exposed to, it becomes obvious that our visual system needs to constantly extract relevant features from the incoming light signal. The first processing steps of the visual signal, taking place within the retina, have been found to already combine a high content of information in the spiking rate, which is transferred to the brain. The remarkable computations that feature this ability to pre-process the visual input and filter relevant information about the visual scene will be a focus of this study. The Retina consists of 5 cell types that are organized in 3 cellular layers, interconnected in 2 synaptic layers (Figure 1A). The first cellular layer is composed of photoreceptor cells (Rods and Cones) which translate a visual input stimulus from the environment into a biochemical signal. This signal is then transferred into the second layer consisting of bipolar cells, which then synapse onto the third nuclear layer consisting of ganglion cells. Within this direct ‘vertical’ pathway from photoreceptor to bipolar to ganglion cells, all synapses are excitatory, activating the following cells upon a visual input. Additionally, the visual signal can be modulated through two types of cells which connect to the direct pathway via inhibitory synapses. This indirect ‘lateral’ contribution to the signal transmission takes place at two stages: Horizontal receive input from receptor cells and in turn act in the first synaptic layer synapsing back on receptor and bipolar cells, whereas amacrine cells modulate signal transmission in the second layer, receiving input from and synapsing onto bipolar and ganglion cells (Kolb H,
1995-2019). Especially amacrine cells can act through various different neurotransmitter and have very diverse roles in shaping the information transmission, which are not completely understood yet. They can also serve to transmit signals between bipolar cells (Kolb H, 1995-2019). Ultimately, ganglion cells translate the modulated signal they receive via the direct and indirect pathway (Figure 1B) into a spike train that is further transported into the brain. At this stage, the spiking pattern already contains pre-processed information about the visual scene.
Figure 1: Five cell types in the retina and their connectivity. A. The direct signal is transferred vertically from Receptor cells
to bipolar cells to Retinal Ganglion cells (RGC). This signal is modulated laterally via horizontal and amacrine cells. In ganglion cells, the pre-processed signal is translated into a spike train and sent to the brain via the optic nerve.1 B. Schematic view of
excitatory and inhibitory impact on signal transmission. The main signal is transported directly over excitatory synapses and modulated via inhibitory synapses indirectly transporting lateral information. A from: https://media.nature.com/m685/nature-assets/nrn/journal/v15/n9/images/nrn3767-f1.jpg
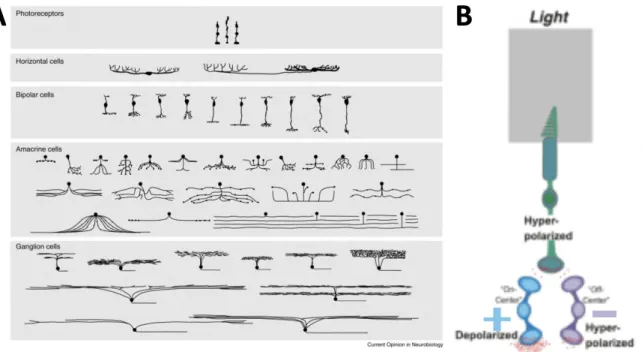
Notably all 5 cell types exhibit vast heterogeneity and can be divided in various sub-types (Figure 2A). Especially ganglion cells can be divided in up to 20 different types that constitute parallel representation of the visual world in a way that each cell type carries information about a specific feature of the visual scene (Baden & Euler, 2013) and can respond very differently to the same visual stimulus. In general, this is achieved through different bipolar cell types and thus distinct sub-types of cells with different physiological properties and temporal dynamics connect into distinct parallel pathways (Figure 2B). To major pathways are constituted by ON and OFF cells, which respond to the same visual signal in the opposite way: ON bipolar cells are activated – or depolarized- by a bight stimulus whereas OFF bipolar cells are activated in the absence of light (Kolb H, 1995-2019). Hence, two parallel pathways arise from this, the ON and OFF pathway (Figure 2).
Figure 2 Diversity and Pathways in the retina A. From top to bottom: Diversity of sub-types within photoreceptor cells,
horizontal cells, bipolar cells, amacrine cells and ganglion cells2. B.ON and OFF pathway and different cell types involved. The
same signal from the receptor cell layer activates one type of bipolar cells ( here ON ) and not the other one. ON and OFF bipolar cells innervate distinct ON and OFF ganglion cell. Notably, some ganglion cells can receive input from bot ON and OFF pathways.3
The Omitted Stimulus Response
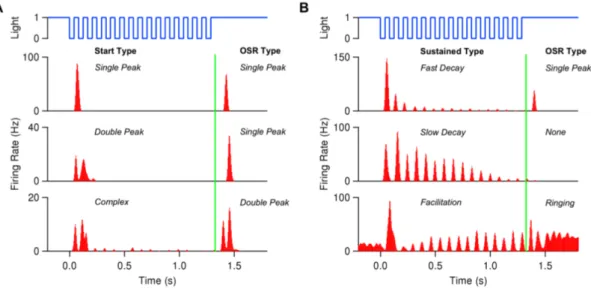
A very sophisticated example of the computations within the retina is observed when the visual system is exposed to a periodic stimulus, such as a regular series of flashes. If the retina would simply respond proportionally to the stimulus input, one might expect that ganglion cells would become entrained into a periodic activity, responding to each flash. When the stimulus sequence ends, the activity would end as well. However, ganglion cells can exhibit various different kinds of response patterns to this form of stimulation shown in Figure 3. At the beginning of the stimulus, cells typically respond to the first flash of this new stimulus with a peak of activity, but then very rapidly decay in the amplitude of their response to the following flashes. Most remarkably, when the flash sequence ends ganglion cells do not just stop to respond, but in fact may generate a pulse of activity signaling the missing stimulus. This property of indicating a deviation from an expected pattern has been termed the Omitted Stimulus Response (OSR) (Schwartz, Harris, Shrom, & Berry, 2007). In order to classify the different response patterns observed to a limited periodic flash sequence, the corresponding ganglion cell response timeline can be divided in 3 epochs: The Start response at the beginning of the flash sequence, sustained response during the continuous presentation of the periodic stimulus and OSR response after the stimulus has ended. The different response types observed in each epoch are summarized in Figure 3.
Figure 3: Experimentally observed Omitted Stimulus Response types. Divided in 3 epochs: Start response (A), sustained
response (B) and OSR response. Start responses can be ‘single peak’, ‘double peak’ or complex, sustained responses can exhibit a fast or slow decay, or can facilitate into a continuous response. OSR types are be ‘single peak’, ‘double peak’ or ‘ringing’ with ongoing activity. from (Gao, Schwartz, Berry, & Holmes, 2009)
This behavior can be observed over different stimulus frequencies ranging from 6-20 Hz, but individual ganglion cells typically exhibit an OSR only to a narrow range of frequencies. Surprisingly, when the stimulus period increases and thus the time until the next flash increases, the latency of the OSR increases as well. This suggests that the response is precisely timed to the frequency of the presented stimulus, and not just signals the missing flash, but also indicates the expected time of the pattern violation. This implies that the retina already contains temporal expectations about visual world and informs the brain rather about a violation of this expectation than about sustained visual features. This level of prediction is quite remarkable and extends the list of complex computations performed within the retina, whose underlying mechanisms we are only beginning to understand (Gollisch & Meister, 2010). Thus studying this dynamic from of pattern recognition at a well-defined neuronal circuit may provide valuable insights in basic cellular mechanisms involved in pattern recognition and prediction. Relevant Retinal Circuitry and Existing Models
In order to further identify the relevant retinal circuitry involved, pharmacological experiments were carried out applying several substances to selectively block responses of different cell types. It has been shown that blocking ON bipolar cells completely eliminates the OSR to dark flashes (Schwartz & Berry, 2008). Furthermore, blocking inhibitory signaling from amacrine cells only slightly changes the shape of the OSR (Schwartz & Berry, 2008).Thus, the ON pathway is thought to be essential to cause a dark flash OSR, and the structure of the neuronal
circuit involved primarily focuses on the convergence of excitatory signals from direct ON and OFF pathways.
In attempting to further identify the origin of Omitted Stimulus Response, computational models have been designed and explain the OSR through different mechanisms potentially involved. This study focused on two different models for the OSR, one explaining the observation simply as an result of the interaction between different pathways in the retina (Werner, Cook, & Passaglia, 2008), whereas a second model explains the OSR through an oscillatory intrinsic bipolar cell property observed in the ON pathway (Gao et al., 2009). Aim of this Study
The aim of this study was to implement and compare the two existing models mentioned above, as well as exploring potential mechanisms that may be involved in generating an Omitted Stimulus Response. Especially synaptic mechanisms may provide an explanation here, but the integration of such a mechanism into an OSR model has not been explored yet. A potential synaptic property that provides an interesting candidate to test here would be short-term plasticity (STP), which modulates synaptic efficacy depending on the previous activity in a short time interval (Blitz, Foster, & Regehr, 2004). STP thus modulates signal transmission and a consecutive spike pattern and has been found to take place within the retina (Dunn & Rieke, 2008).
Examining the models’ underlying mechanisms, advantages and disadvantages as well as similarities and differences will provide a good foundation to modify existing models by adding potential mechanisms and exploring their effect on a ganglion cell response to a periodic stimulus. Ultimately, this may help shedding light on cellular properties in a neuronal circuit as of as few as 3 cells can contribute to already interpreting information from the environment.
METHODS
The two models mentioned above were implemented in Python using the methodological framework explained in the publications as described below. Both models follow the general structure of two parallel feedforward circuits representing the ON- and OFF pathway with opposing responses in bipolar cell dynamics and focus on the response to a series of dark flashes.
Dual Linear-Nonlinear Model – General Structure
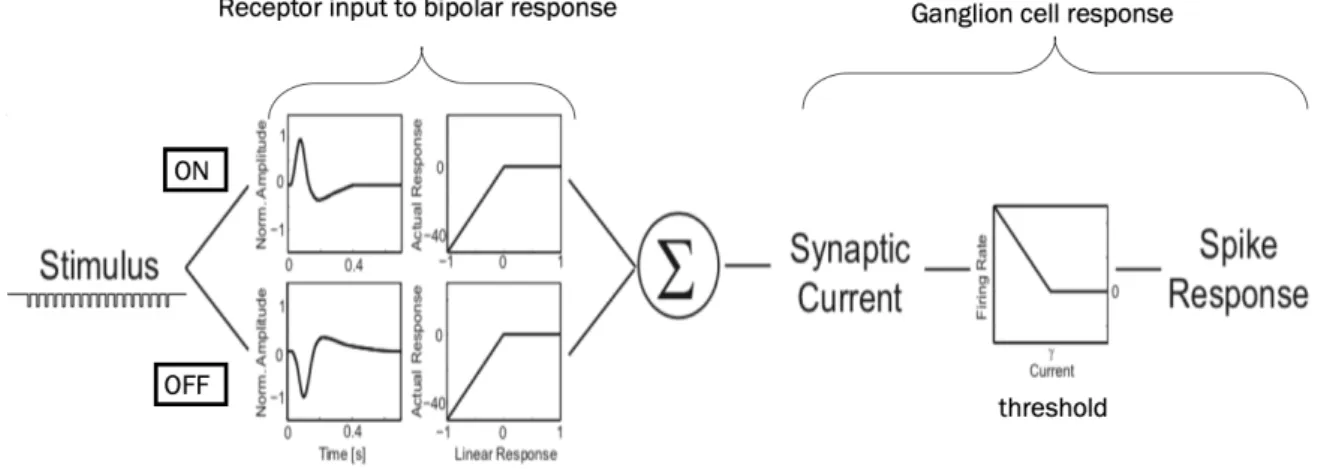
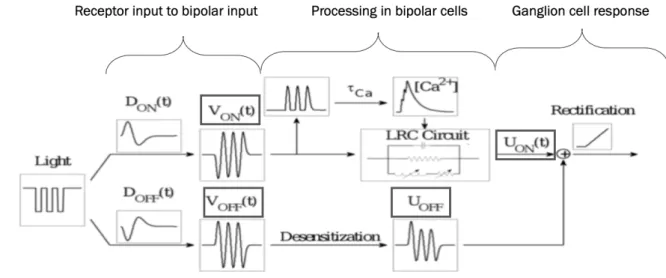
The first model designed by Werner et al. (Werner et al., 2008) can produce an Omitted Stimulus Response merely through the combination of inputs from ON and OFF bipolar cells and thus explains the OSR response to a series of dark flashes as essentially the offset response to a dark stimulus. First, processing steps from receptor to bipolar response in each pathway are simulated and follow standard ‘linear-nonlinear’ models explained in the next section. Both ON and OFF bipolar responses are then combined to represent an input received by ganglion cells, and a spike threshold is applied to transform this input into a corresponding firing rate (see Fig. 4).
Figure 4 Schematic description of the dual LN-Model. The stimulus is passed through a ‘linear-nonlinear’ processing step
existing in two parallel versions to simulate bipolar cell responses corresponding to the stimulus. The output of both pathways is then combined into a synaptic current resembling what is passed on from bipolar to ganglion cells. A spiking threshold is then applied to translate the synaptic current input into a firing rate. from (Werner et al., 2007)
From input to bipolar cell response
The first step in modeling signal processing in the visual system is to translate the stimulus input into a cellular response (Figure 4). Therefore, the stimulus is passed through a ‘linear filter’, which represents the temporal processing of an input within the retina (Baccus & Meister, 2002). More precisely, the shape of the linear filter indicates how a cell reacts to the stimulus. Thus by convolving the incoming light stimulus s(t) with a linear filter F(t) (Eq. 1), a cell voltage V(t) can be obtained, simulating a cells response to the stimulus.
𝑉(𝑡) = & 𝑠(𝜏) ∗ 𝐹(𝑡 − 𝜏) 𝑑𝜏.
/
In standard models, the filter is generated by experimentally measuring spike responses from a cell and then calculating the correlation between the measured response and the stimulus input. As no experiments were performed in this internship, linear filter were fitted according to the
graphs in respective publications (Gao et al., 2009; Schwartz et al., 2007; Werner et al., 2008) ( see Supplementary Figure 1).
ON and OFF bipolar cell responses are modelled in two distinct pathways, hence the input
stimulus is convolved with two different filter FON and FOFF to generate ON and OFF bipolar
voltage responses VON and VOFF. As ON and OFF bipolar cells coarsely respond oppositely to
the same stimulus input, the linear filter for the OFF pathway was calculated as sign reversed ON filter (Eq. 2).
𝐹011(𝑡) = −𝐹02(𝑡)
Before the bipolar voltage response V(t) is passed on to ganglion cells, several intrinsic and synaptic processing steps may occur, transforming the initial voltage response into a synaptic output that will be understood by ganglion cells.
Therefore, the obtained voltage response V(t) is passed through a piecewise linear transformation N(t) to obtain a synaptic response U(t), which is not linear to the input stimulus anymore (Eq. 3). Here, two functions with two gain parameters a and b are applied that scale the weight of the voltage response below and above zero, respectively (Eq. 4). This step describes how the synapse generally reacts on voltage changes and translates these into a signal that is understood by ganglion cells. The scale factors a and b can differ between the ON and OFF pathway.
𝑈(𝑡) = 𝑁5𝑉(𝑡)6
𝑁(𝑡) = 7𝛼𝑥,𝛽𝑥, 𝑥 < 0𝑥 ≥ 0
Altogether, this first step simulates the bipolar cell synaptic response to an input stimulus and summarizes all involved processing steps.
From Ganglion cell input to output
The current responses of both ON and Off bipolar cells jointly govern the firing rate of ganglion cells. Thus both current responses are combined (Eq.5) and subsequently passed through a spike threshold function f(t) (Eq.6) to transform the current input into a spiking rate output of the ganglion cell. In this rectification step, only values above and equal to a defined threshold g are
(2)
(3)
translated into a spike, all values below are set to 0. The parameter 𝑓@ is a scale factor that can be adjusted to increase or decrease the global firing rate.
𝑈(𝑡) = 𝑈02(𝑡) + 𝑈011(𝑡)
𝑓(𝑡) = 7𝑓̅(𝑈(𝑡) − 𝛾), 𝑈(𝑡) ≥ 𝛾
0, 𝑈(𝑡) < 𝛾
The output functions after each step are illustratively shown in Figure 5. Calcium-tuned Oscillator Model – General Structure
A second model designed by Gao et al. (Gao et al., 2009) is based on a similar feedforward circuit, but additionally incorporates more complex intrinsic properties to transform the bipolar cell voltage V(t) into a synaptic bipolar terminal voltage U(t). Moreover, these properties differ between ON and OFF pathways. In the ON pathway, the incoming periodic stimulus causes calcium-induced voltage oscillations due to a specific ion channel composition in the membrane of ON bipolar cell terminals. More specifically, the interplay of voltage-gated calcium and calcium-gated potassium channels induce fluctuations in the intracellular calcium concentration which in turn cause voltage oscillations in the terminal region (Burrone & Lagnado, 1997). When the periodic stimulation ends, the internal oscillation continues and thus results in a response after the offset of the stimulus. OFF- bipolar cells do not exhibit voltage oscillations but merely undergo desensitization to the sustained stimulus, which is caused by a certain type of ion channels not present in the ON bipolar cells. This results in a reduced sustained response that ends with the stimulus.
A linear filtering approach similar to the one described above is used to begin with in both the ON and OFF pathway (Eq.1 & 2), but without further adding a piecewise linear transformation. Instead, the following mechanisms are introduced in the two different pathways prior to
combining bipolar current responses: In the OFF pathway, bipolar soma voltage VOFF(t)
undergoes desensitization following the first peak to create a reduced bipolar terminal voltage
UOFF(t). In the ON pathway, a calcium-tuned oscillator is simulated by an electrical LRC circuit
(Figure 6A) that transforms the soma voltage VON(t) into an oscillating terminal voltage UON(t).
Details are described below. The resulting terminal voltages are then added and transformed into a spiking rate (Eq.5&6). A schematic depiction of the model is given in Figure 5.
(5)
Figure 5 Schematic description of the calcium-tuned Oscillator model. The stimulus is passed through a linear filtering step
existing in two parallel versions to simulate somatic bipolar cell responses corresponding to the stimulus. In the OFF pathway, bipolar soma voltage VOFF(t) undergoes desensitization resulting in a reduced bipolar terminal voltage UOFF(t). In the ON
pathway, the rectified soma voltage VON(t) produces a fluctuating calcium concentration in the ON bipolar cell terminal. The
terminal voltage UON(t) is then produced by passing the soma voltage through the LRC circuit while the calcium concentration
adjusts variable components of the circuit, resembling gated ion channels. Both terminal voltages are added and determine the current input to a ganglion cell, which is passed through a spike threshold to create a firing rate. from (Gao et al., 2009)
OFF bipolar cell intrinsic properties: Desensitization
In OFF bipolar cells, the voltage response is reduced from VOFF(t) to 0.7 VOFF(t) after the first
depolarizing peak at time 𝜏DEFG, as shown in Eq. 7. This simulates desensitization in the OFF
pathway. 𝑈011 = ⎩ ⎪ ⎨ ⎪ ⎧ & 𝑠(𝜏) ∗ 𝐹. 011(𝑡 − 𝜏) 𝑑𝜏 / , 𝑡 ≤ 𝜏DEFG 0.7 & 𝑠(𝜏) ∗ 𝐹. 011(𝑡 − 𝜏) 𝑑𝜏 / , 𝑡 > 𝜏DEFG
ON bipolar cell intrinsic properties: Voltage Oscillations
In the ON bipolar cell pathway, the bipolar soma voltage VON(t) is modulated by an oscillatory
mechanism caused by specific ion-channels that are sensitive to the intracellular calcium concentration. The periodic stimulus causes periodic membrane depolarizations simulated by a
rectified version VON(t), given by max [𝑉02, 0] (Figure 6C, upper panel). This in turn causes
the calcium concentration to fluctuate accordingly (Figure 6C, lower panel). The calcium concentration 𝜑 depending on the rectified soma voltage thus varies in time, as described by
the differential equation in Eq. 8. The characteristic time constant 𝜏VF that scales the decay of
the calcium concentration without further input.
𝜏VF𝜑̇ + 𝜑 = max [𝑉02, 0]
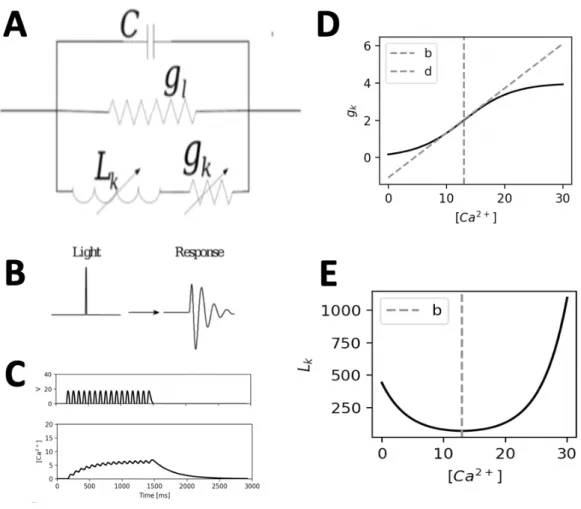
Ultimately, this leads to voltage oscillations in the bipolar cell terminal. These voltage dynamics can be modelled as an electrical circuit (Koch, 1984) where an ion channel is modeled as an conductance g in the membrane with a capacitance C. Here, the circuit consists of a constant
membrane capacitance C and a passive conductance gl in parallel (Figure 6A). In a third parallel
branch, a calcium-dependent potassium conductance gk and Inductance Lk represent the
influence of calcium concentration on ion-channel dynamics in the circuit. The voltage flowing through this circuit resembles the bipolar terminal voltage U(t) and can then be described by the differential equation in Eq.9 :
𝐶𝑈̈ + Z 𝐶 𝐿G𝑔G+ 𝑔]^ 𝑈̇ + Z 𝑔G+ 𝑔] 𝐿G𝑔G ^ 𝑈 = 𝐼̇ 𝐼 𝐿G𝑔G
The input current I is proportional to the bipolar soma voltage VON in a way that 𝐼 = 𝛽 ∗ 𝑉02.
This composition of an electrical circuit is generally known as an LRC circuit (Figure 6A), which can exhibit an oscillatory response upon a single input (see Figure 6B). Here the LRC
circuit has a conductance gk and an inductance Lk depending on Ca2+ which thus regulates the
oscillations. In detail, these calcium dependencies are described as functions of the calcium
concentration 𝑔G(𝜑) and 𝐿G(𝜑) (Eq. 10 & 11), where parameters b and d determine the shape
of the functions ( see Figure 6 D & E).
𝑔G(𝜑) = 𝑔̅
1 − 𝑒bcd(ebf)
𝐿G(𝜑) = 𝐿g51 + 𝑒bcd(ebf)6
h
4𝑑 𝑒bcd(ebf)
Finally, as the Omitted Stimulus Response is caused by the ongoing internal oscillation caused by the LRC circuit, and the timepoint of the OSR is determined by the period of the voltage oscillations (Figure 9 A & B).
(8)
(9)
(10)
Figure 6. The LRC circuit and its properties. A. Schematic description of the LRC circuit with a parallel capacitance C, a passive
conductance g and a series of a time varying conductance gk and Lk. B. LRC circuit response to an input. C. Upper panel
:Rectified soma voltage for a 12 Hz stimulus (upper panel) and corresponding calcium concentration φ(t) (lower panel). D.
Voltage-gated conductance gk plotted against calcium concentration. gk can be described by a sigmoidal function of the
calcium concentration. Here, the parameter d and b determine the slope and the offset, respectively. E. The inductance Lk is
described as the reciprocal of the derivative of gk
Implementation of existing models
In order to implement these existing models, the steps described above were coded in Python to perform simulations. The following parameters were used in this study:
Werner et al. : • 𝛼02 = 1, 𝛽02 = 0, 𝛼011 = 1, 𝛽011 = 0, 𝛾 = −18, f̄ = 1 Hz/mV Gao et al. : • f̄ = 15 Hz/mV, 𝛾 = 8 mV, C = 2 pF, L̄ = 4.3 MH, d = 0.06, b = 9.5, gl = 0.01 nS, ḡ = 4 nS , β = 1 pA/V , τCa = 300 ms.
• The spike threshold 𝛾 (35mV) and LRC input scaling factor β (28pA/V) had to be changed, all other parameters are adopted from Gao et al.
RESULTS
Dual Linear Nonlinear Model
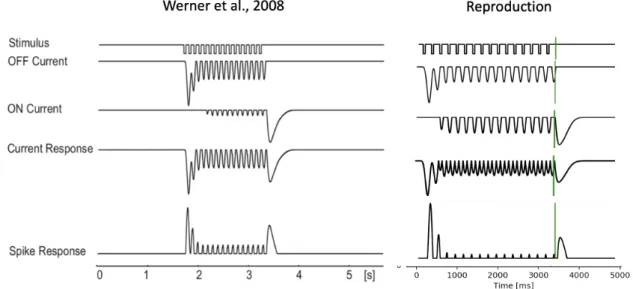
Figure 5 shows the simulated responses in the ON and OFF pathway for the model of Werner et al., obtained after linear filtering and rectification (ON and OFF Current), the combined current from both pathways (Current Response) and the resulting spiking response in ganglion cell output (Spike Response). The simulated responses obtained with the implementation of this study (5B) match the results from the publication (5A), indicating that the mechanisms generating an OSR could successfully be reproduced.
Figure 7 Origin of the Omitted Stimulus Response in the Dual-LN-model. Simulated responses published in Werner et al (A)
and reproduced in this study (B). Vertical green lines indicate the omitted stimulus. Mechanisms of the model
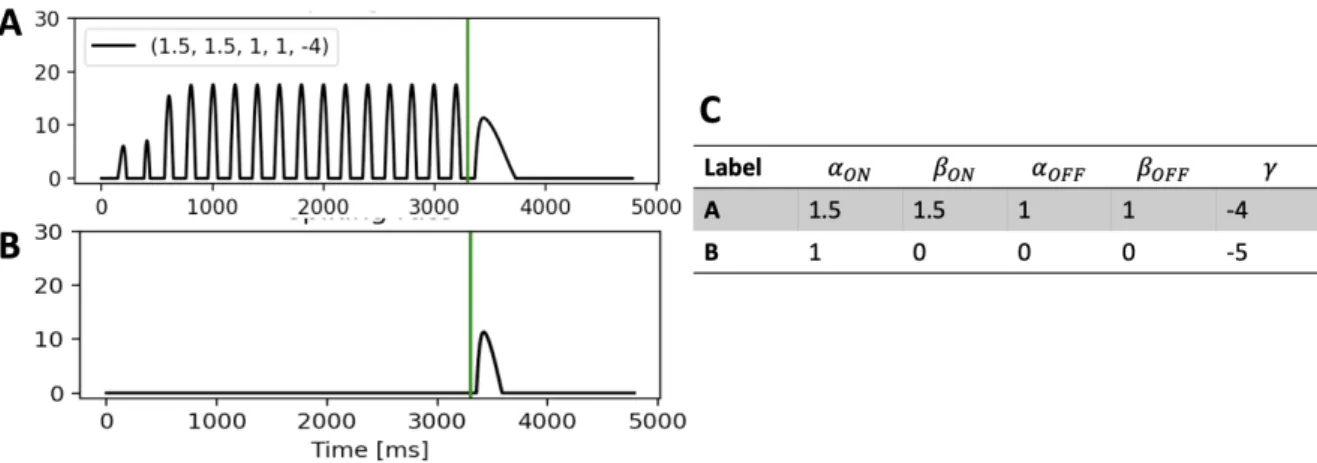
As the spiking response of ganglion cells thus depends linearly on the combined current input from both pathways, the OSR is effectively caused by the ON pathway response to the offset of the dark periodic stimulus. Before summing the voltage responses of ON and OFF bipolar cells, the responses are transformed by applying scale factors to the ON and OFF pathway (Eq.
3 & 4). By scaling each pathway with a different factor, more complex spoking responses may
be obtained, as ON and OFF pathway then contribute differently to the ganglion cell spiking rate.
Figure 8: Example of different spiking rate responses obtained by using different scale factors .A,B. Top: simulated response
when assigning more weight to the ON than the OFF pathway. Bottom: simulated response when weighting only negative responses from the ON pathway. B. Parameter used for panels A and B.
Differences to the publication
A difference between the reproduction in this study and the publication is that the combined response exhibits a period doubling behavior ( Figure 7, ‘Current Response’), as each flash results in two current peaks with slightly different amplitudes. This behavior may be explained by the fact that ON and OFF filter used here are exactly similar with opposite orientation. As ON and OFF may have different temporal dynamics, using different filter shapes as in the publication would be more accurate. Furthermore, the existence of an OSR depends precisely of the interplay between filter shape and stimulus frequency. If the stimulus frequency increases, the same filter is not fast enough to react to each flash and thus fails to create an response that corresponds to the stimulus. While using the same filter, only a narrow range of frequencies will produce a realistic response. Comparing the filter used in the study of Werner et al. to other linear filter used in other retina models (Baccus & Meister, 2002; Gao et al., 2009), it seems to be very slow.
Altogether, the OSR is effectively produced by the rebound period of the ON filter and can be altered by scaling the ON-current response before summation with the OFF pathway response. Calcium-tuned Oscillator Model
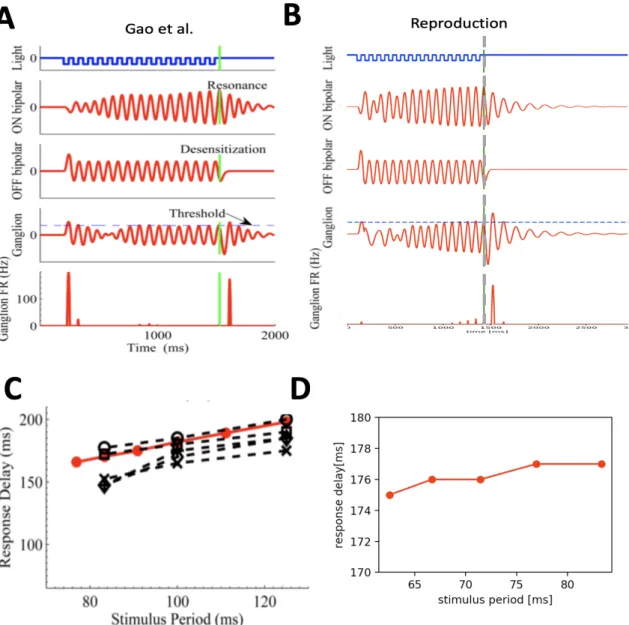
Figure 9 shows a representative simulation of an OSR for a frequency of 12 Hz as presented in the publication by Gao et al. (9A) and the reproduction made in this study (9B). The OSR is produced by a prolonged damped oscillation, caused by the LRC circuit in the ON bipolar cell terminal. During the sustained stimulus, ON and OFF currents partially cancel each other out, because the similar filter dynamics lead to a phase locked voltage responses in both ON and OFF bipolar cells, which is maintained by calcium tuning in the ON pathway throughout the
LRC circuit. This results in a reduced combined current and a comparably strong OSR when
Figure 9: Origin and properties of the OSR in the Calcium-tuned Oscillator Model. Upper panel : Simulations of the OSR and
latencies as published in Gao et al. (A) and the reproduction made in this study (B). From top to bottom: light intensity, ON and OFF bipolar cell voltages, ganglion cell voltages, and ganglion cell firing rates for a 12 Hz stimuli. Vertical green lines indicate omitted flash onset. Lower pane: latencies from last flash to OSR for the models above (in red) and for data from eight ganglion cells (in black ) in the publication (C) and in this study (D). A and C from (Gao et al., 2009).
Differences in functioning stimulus frequencies
The reproduction of this study works for a different range of frequencies (12-16 Hz) than stated in the publication (8-13Hz) when using approximately similar liner filter dynamics (Supplementary Figure 1). Here, below 12 Hz the oscillatory frequency of the LRC output current does not match the incoming soma voltage frequency anymore, resulting in an increased sustained response and a comparably weaker OSR.
Differences in the latency timing of the OSR
A remarkable feature of the OSR is that it’s latency to the omitted stimulus is precisely timed to the frequency of the presented stimulus. The latency is defined by the time lapse between the last flash and the peak in the corresponding OSR. Depending on the presented stimulus frequency, the latency of the OSR is observed to shift in correlation with the presented period, inferring a predictive timing of the OSR. As published in Gao et al. the model produces a latency curve closely to what was observed experimentally when plotting the OSR delay against the stimulus period (Figure 9C). Figure 9D show the latency curves obtained from this study. Here, the same tendency can be observed for the different frequency range (12-16 Hz), but notably the latencies only vary very slightly (175-177 ms) compared to the publication (~160-200 ms). Additionally, the latency curve for lower frequencies than 12 Hz does not match the experimental observations anymore (not shown). The differences between the publication and the results in this study may be explained by differences in the calcium concentrations obtained corresponding to rectified soma voltages (Figure 3C).
Differences in the calcium concentration
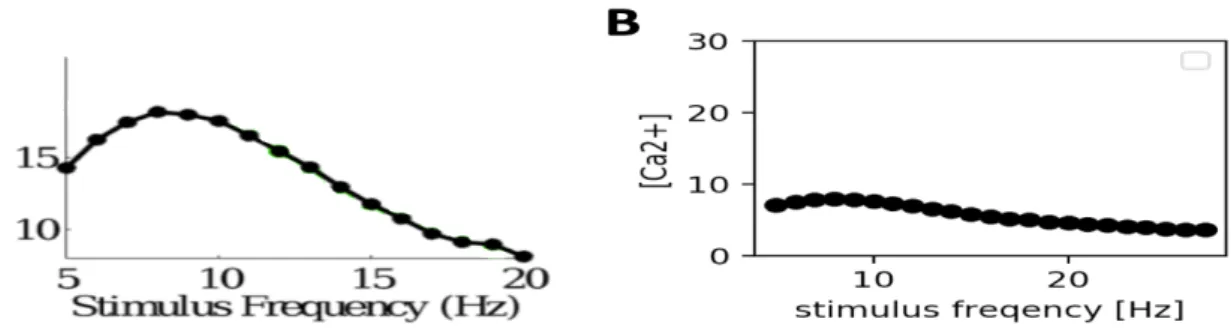
The latency of the OSR is determined by the period of the oscillation following the last flash.
As the oscillatory frequency of the LRC output is determined by gk and Lk (Gao et al.,2009),
which vary depending on the Ca2+ concentration, the value of [Ca2+] at the end of the flash
sequence is essentially what is responsible for the latency timing. As shown in Figure 10, the calcium concentration for different frequencies ranges from almost 20 nM to 5 nM (10 A) in the publication from Gao et al., whereas the calcium concentrations in this study ranges only between 10 and 3 nM (10 B).
Figure 10.Calcium concentration varies for different stimulus frequencies. A calcium concentrations plotted against stimulus
frequency in the publication. Here, time-averaged calcium concentrations φe were calculated for different frequencies. B. Reproduction in this study, showing the maximum calcium concentration at the end of the presented stimulus.
Altogether, the OSR is effectively a feature of the ON pathway and its oscillatory response to the stimulus in this model, and it can account for an OSR that matches experimental
observations throughout a wider range of frequencies. However, to account for the entire range of frequencies observed experimentally, different filter speeds need to be used and parameters need to be slightly changed in order to fit the model to experimental observations (Gao et al., 2009).
Additional simulations
Thus far, the publications focused on the response to a dark flash sequence, however, bright flash OSRs are also observed and show differences interesting in magnitude, responsive frequency and response delay to the flash (Weidmann, 2009). Differences and similarities are summarized in table 1. Notably, contradictory observations have been reported on the abundance bright and dark flash OSR. One study reported that individual ganglion cells respond only to dark or to light flash sequences (Schwartz & Berry, 2008), whereas another study found that 56% of cells exhibited an OSR to both flash types (Weidmann, 2009).
Table 1 Differences in bright and dark flash OSR responses
Going beyond what has been shown in the publication, this study additionally tested whether the calcium-tuned oscillator in the ON pathways would also be able to produce an OSR to bright flashes. By changing the input to a periodic series of bright flashes of the same frequency of 12 Hz and without any other changes in parameters, the model can produce an OSR to a bright flash sequence as well, which is distinguishable from the dark flash OSR (Figure 8). The response to the missing flash appears to peak earlier for bright than for dark flashes, and the amplitude of the OSR peak is bigger for the same spiking threshold. This generally matches some of the differences between the bright and dark flash OSR observed experimentally.
Figure 11: The Omitted Stimulus Response to bright and dark flashes. Simulation for dark (A) and bright (B) periodic flash
stimuli. From top to bottom : light intensity, ON and OFF bipolar cell voltages, ganglion cell voltages, and ganglion cell firing rates for a 12 Hz stimuli. Vertical green lines indicate omitted flash onset.
Modifications of the model
However, blocking the ON pathway in the simulation for both dark and bright flashes clearly abolishes the OSR. This stands in contrast to the experimental observation that the ON pathway has been shown to only be crucial for generating a dark flash OSR, but a bright flash OSR is not abolished when ON bipolar cells are pharmacologically blocked (Weidmann, 2009). As no experimental findings precisely point out that bipolar voltage oscillations are exclusively observed in ON cells, one might suggest that a similar oscillatory behavior in OFF bipolar cell terminals is responsible for the bright flash OSR. A model containing a similar oscillator in both ON and OFF cell pathways without desensitization can produce an OSR to both dark and bright flashes is shown in Figure 9. However, when keeping the spiking threshold constant, the OSR shape consists of 5 peaks with the first one being smaller than the second one, what has not been observed experimentally.
Figure 12 Variation of the model with an LRC circuit implemented in both ON and OFF pathway. Simulation for dark (A) and
bright (B) periodic flash stimuli. From top to bottom : light intensity, ON and OFF bipolar cell voltages, ganglion cell voltages, and ganglion cell firing rates for a 12 Hz stimuli. Vertical green lines indicate omitted flash onset.
Figure 13 A. Variation of the model with the calcium concentration depending on the ON bipolar cell terminal voltage. B.
Corresponding calcium concentration.
Further modifications were performed to explore a potential recurrent effect of terminal voltage oscillations on the calcium concentration. In the model designed by Gao et al. the calcium concentration depends on the rectified soma voltage, however, as the voltage-sensitive calcium channels are mainly located in the axon terminals (Baden, Berens, Bethge, & Euler, 2013), it
might be more accurate to pass the terminal voltage UON(t) through the calcium filter. As shown
lower in order to generate a spiking response ( 𝛾 = 3). Notably, as the calcium concentration within the cell terminals would not actively decrease upon a negative terminal voltage, it may
be more realistic to rectify UON(t) prior to passing it through the calcium concentration function,
which remains to be tested.
DISCUSSION
The omitted stimulus response in the retina is an example of highly sophisticated pattern recognition taking place in a tractable neural circuit and resembles the retinas’ ability to adapt to changes in the stimulus pattern. A curial feature of the response is its predictive response to the precise timing of the expected flash. Existing models can successfully produce a simulated response resembling different properties of the OSR response, however, the complexity of the various OSR types cannot fully be covered.
The dual LN model designed by Werner et al. can generate an OSR to different frequencies in various different shapes by changing the parameters and filter properties, but fails to reproduce a predictive latency peak timing. Furthermore, as all intrinsic cellular mechanisms and processing steps are either summed up within the filter or the parameter, this model cannot identify potential aspects involved in the OSR response.
The calcium-tuned oscillator model provides an elegant explanation with a biologically plausible mechanism that generates an OSR over various frequencies and can potentially reproduce a correct latency timing that matches experimental observations. Even though this could not be replicated in this study, this deviation is most likely due to the fact that linear filter used to generate a voltage response corresponding to the stimulus were only approximated and thus resulted in different voltage response amplitudes (supplementary 2). In order to correct for this, the relevant parameter would need to be tuned to match the response of the LRC circuit to the temporal dynamics of the filter. As bipolar cells in general exhibits quite different temporal dynamics (Awatramani & Slaughter, 2000), this would mean that each sell would need to have slightly different potassium channels with a precisely adjusted conductance in order to exhibit
a predictive latency timing. Thus the model is not very stable to small perturbations of
parameters. Changing d from 0.06 to 0.1 and b from 13 to 9.5, results in a remarkably different spiking rate (supplementary 4).
Outlook
Nevertheless, the model designed by Gao et al. provides a stable functional basis to generate an Omitted Stimulus Response, even when structural components are altered. In future studies, it would be interesting to further refine the mechanisms of the model and add additional components in order to approach a more realistic representation of the structure and connectivity in the retina. Even though experimental results showed that an inhibitory signal modulation via amacrine cells is not crucial to generate an OSR, it would be interesting to test the effect of additional connections between the ON and OFF pathways, as well as feedback mechanisms.
Thus far, the model explains the OSR essentially via intrinsic properties of bipolar cells, and synaptic mechanisms potentially involved were not explored yet. Interestingly, signal modulation through short-term plasticity has been shown to play a role in other complex computations taking place within the retina, such as light adaptation (Dunn & Rieke, 2008). Here, a persistent flash sequence results synaptic depression in a way that the synaptic efficacy is lowered when already activated within the previous 200 ms. This time window fits quite accurately to the frequency range in which an OSR is observed, as the minimum frequency of 6 Hz corresponds to a period of 200 ms. Exploring the effect of a plasticity mechanism at the bipolar terminal synapses involved in the OSR would thus be interesting to study.
Conclusion
Altogether, the OSR response proofs that an expectation of the environment can be explicitly represented in the neural code as early as the retina. It thus provides a very interesting phenomenon to study, as it emphasizes the computational capabilities of local circuits. Much more complex predictions made by the brain may result from very similar computations carried out in higher cortical regions and could help to identify fundamental mechanisms that help us to interact with our environment.
References
Awatramani, G. B., & Slaughter, M. M. (2000). Origin of transient and sustained responses in ganglion cells of the retina. J Neurosci, 20(18), 7087-7095.
Baccus, S. A., & Meister, M. (2002). Fast and slow contrast adaptation in retinal circuitry.
Neuron, 36(5), 909-919.
Baden, T., Berens, P., Bethge, M., & Euler, T. (2013). Spikes in mammalian bipolar cells support temporal layering of the inner retina. Curr Biol, 23(1), 48-52. doi:10.1016/j.cub.2012.11.006
Baden, T., & Euler, T. (2013). Early vision: where (some of) the magic happens. Curr Biol,
23(24), R1096-1098. doi:10.1016/j.cub.2013.10.066
Blitz, D. M., Foster, K. A., & Regehr, W. G. (2004). Short-term synaptic plasticity: a comparison of two synapses. Nat Rev Neurosci, 5(8), 630-640. doi:10.1038/nrn1475
Burrone, J., & Lagnado, L. (1997). Electrical resonance and Ca2+ influx in the synaptic terminal of depolarizing bipolar cells from the goldfish retina. J Physiol, 505 ( Pt 3), 571-584. Dunn, F. A., & Rieke, F. (2008). Single-photon absorptions evoke synaptic depression in the
retina to extend the operational range of rod vision. Neuron, 57(6), 894-904. doi:10.1016/j.neuron.2008.01.031
Gao, J., Schwartz, G., Berry, M. J., 2nd, & Holmes, P. (2009). An oscillatory circuit underlying the detection of disruptions in temporally-periodic patterns. Network, 20(2), 106-135. doi:10.1080/09548980902991705
Gollisch, T., & Meister, M. (2010). Eye smarter than scientists believed: neural computations in circuits of the retina. Neuron, 65(2), 150-164. doi:10.1016/j.neuron.2009.12.009 Koch, C. (1984). Cable theory in neurons with active, linearized membranes. Biol Cybern, 50(1),
15-33.
Kolb H, F. E., Nelson R, editors. (1995-2019). Webvision: The Organization of the Retina and Visual System [Internet]. Salt Lake City (UT): University of Utah Health Sciences Center. Masland, R. H. (2001). The fundamental plan of the retina. Nat Neurosci, 4(9), 877-886.
doi:10.1038/nn0901-877
Schwartz, G., & Berry, M. J., 2nd. (2008). Sophisticated temporal pattern recognition in retinal ganglion cells. J Neurophysiol, 99(4), 1787-1798. doi:10.1152/jn.01025.2007
Schwartz, G., Harris, R., Shrom, D., & Berry, M. J., 2nd. (2007). Detection and prediction of periodic patterns by the retina. Nat Neurosci, 10(5), 552-554. doi:10.1038/nn1887 Weidmann. (2009). Exploring the Cellular Mechanism of the Omitted Stimulus Response.
Bachelor Thesis Report.
Werner, B., Cook, P. B., & Passaglia, C. L. (2008). Complex temporal response patterns with a simple retinal circuit. J Neurophysiol, 100(2), 1087-1097. doi:10.1152/jn.90527.2008
1.
https://media.nature.com/m685/nature-assets/nrn/journal/v15/n9/images/nrn3767-f1.jpg, 02.06.2018
2. http://wiki.eyewire.org/images/7/77/Cells_of_the_Retina.jpg, 02.06.2018
3.
Supplementary Figures
1. Linear filtering and Convolution Linear-Nonlinear Model
Figure 14: Schematic description of the LN mode approach to predict a cells response to an input stimulus. The stimulus
s(t) is passed through a linear filter F(t) via a convolution, and then the result g(t ) is passed through a fixed transformation N(g ) to produce the predicted response.
Convolution
In order to generate a cell voltage response V(t) corresponding to a stimulus s(t), the stimulus function s(t) is convolved with a linear filter F(t). A convolution is a mathematical operation where two functions are combined to produce a third one, which shows how the shape of one function is modified by the other one. Thus V(t) is a represents the stimulus s(t) modified by the filter F(t).
𝑉(𝑡) = & 𝑠(𝜏) ∗ 𝐹(𝑡 − 𝜏) 𝑑𝜏.
2. Approximation of linear filter
Figure 15 Approximation of the linear filter used in the ON pathway. Upper row: Filter shapes given in the publications of
Werner et al. (A) and Gao et al. (B) Bottom row: Corresponding filter shapes used in this study.
3. Solving the LRC circuit system of differential equations
In order to solve for the ON bipolar cell terminal voltage, a system of differential equations can be generated, which combines Eq. 8 and Eq. 9, where both the LRC circuit response and the calcium concentration depend on the soma voltage as input (Eq. 10).
𝑢̇ = 𝑦 𝑦̇ = − Z 1 𝐿G𝑔G+ 𝑔]^ 𝑦 − Z 𝑔G+ 𝑔] 𝐿G𝑔G𝐶^ 𝑢 + Z 1 𝐿G𝑔G𝐶^ 𝐼 + 𝐼̇ 𝐶 𝜑̇ = − 1 𝜏VF𝜑 + max [𝑉, 0] 𝜏VF
4. Parameter stability of the Calcium-tuned Oscillator Model