Open Archive TOULOUSE Archive Ouverte (OATAO)
OATAO is an open access repository that collects the work of Toulouse researchers and makes it freely available over the web where possible.
This is an author-deposited version published in : http://oatao.univ-toulouse.fr/
Eprints ID : 5212
To link to this article : DOI : 10.2166/wst.2010.929 URL : http://dx.doi.org/doi:10.2166/wst.2010.929
To cite this version :
Sablayrolles, Caroline and Vialle, Claire and Vignoles, Christian and Montrejaud-Vignoles, Mireille Impact of carwash discharge on stormwater quality (Toulouse, France). (2010) Water Science
1/13
Impact of carwash discharge on stormwater quality
(Toulouse, France)
C. Sablayrolles *,**, C. Vialle *,**, C. Vignoles *** and M. Montrejaud-Vignoles *,**
*Université de Toulouse; INP; LCA (Laboratoire de Chimie Agro-Industrielle); ENSIACET, 4, allée Emile
Monso BP-74233 31432 Toulouse Cedex 4, France
(E-mail : caroline.sablayrolles@ensiacet.fr; claire.vialle@ensiacet.fr; mireille.vignoles@ensiacet.fr)
**INRA; LCA (Laboratoire de Chimie Agro-Industrielle); F-31029 Toulouse, France
***VEOLIA EAU, Direction Régionale Sud-Ouest, 22 avenue Marcel Dassault BP-5873 31506 Toulouse
Cedex 5, France
(E-mail: christian.vignoles@veoliaeau.fr)
Abstract The contribution of discharge from carwashes to pollutant levels in stormwater was evaluated. Five carwashes and two outlets in the city of Toulouse (France) were selected. Water samples were collected from December 2006 to December 2007. Concentrations and loadings of classical water quality parameters (conductivity, pH, turbidity, chemical oxygen demand, nitrogen, phosphorus, ammonium, nitrate, suspended solid and volatile suspended solid) and five groups of organic compounds (polycyclic aromatic hydrocarbons, polychlorinated biphenyls, lauryl alkyl benzene sulphonates, methyl tert-butyl ether and total hydrocarbons) were determined. The results suggest that the wastewater derived from carwashes was negligible compared to the volume and flow rates within the stormwater network. However, high concentrations of polycyclic aromatic hydrocarbons, phosphorus and lauryl alkyl benzene sulphonates in liquid waste from carwashes, and the impact of these pollutants on stormwater quality could not be neglected.
Keywords Organic pollutants; pollutant loading; separated sewer system; urban stormwater
INTRODUCTION
Stormwater, is known to be an important source of received water pollution in many municipalities (Clark et al., 1971). Pollution from urban runoff water comprises many sources, including heavy and light industry, road runoff, illicit connections and illegal dumping (Walker et al., 1999). The European Water Directive (European Commission, 2000), whose aim is to better ecological and environmental quality, has mandated water quality assessment of a wide range of organic pollutants in addition to classical water quality parameters.
Specific sources for several chemical classes are listed below, along with their observed concentration in urban runoff (Table 1). Organic micropollutants in the environment originate from both domestic and industrial anthropogenic activities and are transferred to the atmosphere, soil, and surface water via specific point sources or more diffuse inputs. The main sources of polycyclic aromatic hydrocarbons (PAHs) originate from pyrolysis of organic matter at high temperature (Moilleron et al., 2006). Polychlorinated biphenyls (PCBs) have been used extensively in many industrial applications, including in fire-resistant transformers and insulating condensers (Waid, 1996). PCBs have contaminated the environment due to inconvenient storage practices, industrial incidents or handling oversights. Urban surfaces can receive deposits of PAHs and PCBs from different sources such as car traffic, industries, waste incinerators, and domestic heating via both atmospheric transport and local activity (Cailleaud et al., 2007). Methyl tert-butyl ether (MTBE) is a volatile organic compound produced from natural gas. It is commonly selected by petroleum refiners and distributors to aid the oxygenation of fuel to reduce carbon monoxide emissions. It is introduced to the environment by leaking petroleum storage tanks, urban runoff, and motorised watercraft (Achten et al., 2001). Linear alkylbenzene sulphonates (LAS) are the most important synthetic anionic surface active agents, and they are the principal constituents of commercial detergents used for institutional cleaning and industrial purposes. LAS are significant environmental pollutants as the bio-degradation of these compounds consumes bio-available oxygen. LAS are not
only toxic, but also contribute to the permeation of other pollutants into aquatic animals (Sanderson et al., 2006).
The case of Toulouse, France is particularly interesting because the town has a separated sewer system where organic compounds in the wastewater system cannot mix with the stormwater system (Xaumier et al., 2004). The stormwater sewer discharges into the Garonne River, whereas wastewater is routed to the wastewater treatment plant. However, water in the stormwater system comes not only from roof and road runoff but also from carwash discharges after a standard, on-site pre-treatment process. Previous studies have questioned the efficiency of these pre-treatment processes. The aim of this work was to analyse the wastewater from carwashes upstream of the stormwater network to evaluate the impact of this source of pollution on the quality of stormwater.
3/13 Table 1. Reported concentrations of organic pollutants in water reservoirs
Concentrations
Organic pollutants Water type n Origin
Min. Max. Mean Median References
PCBs (µg/L) PCBs (Σ12) River water Potable water Raw wastewater Treated wastewater 52 - - - France 0.020 0.025 0.380 0.150 0.990 0.220 1.300 0.390 0.115 0.079 0.650 0.280 - - - - (Chevreuil et al., 1990)
PCBs (Σ7) Raw wastewater 5 France 0.020 0.036 0.029 0.031 (Blanchard et al., 2001)
PCBs (Σ7) Raw wastewater Primary effluent Secondary effluent 20 20 20 Greece 0.470 0.320 0.130 1.800 1.700 0.390 1.000 0.631 0.250 1.000 0.570 0.250 (Katsoyiannis et al., 2004)
PCBs (Σ12) Runoff water 89 Switzerland 0.11 10-3 0.403 - - (Rossi et al. 2004)
PCBs (Σ13) Sea water 10 Italy 0.45.10-3 2.1.10-3 - - (Manodori et al., 2006)
PAHs (µg/L)
PAHs (Σ11) Surface water 6 France 4.10-3 0.036 0.020 - (Fernandes et al., 1997)
PAHs (Σ15) Sea water - UK 1.10-3 24.821 1.002 - (Law et al., 1997)
PAHs (-) Runoff water 35 France 0.011 0.474 0.096 0.074 (Legret et al., 1999)
PAHs (Σ16) Raw wastewater 4 France 1.277 3.240 1.998 1.737 (Blanchard et al., 2001)
PAHs (Σ15) Underground water Surface water Rainwater 1 1 1 Germany - - - - - - 9.4.10-3 0.280 0.079 - - - (Popp et al., 2001)
PAHs (Σ14) Runoff water 33 France - - 0.149 0.063 (Moteley-Massei et al., 2006)
PAHs (Σ12) Surface water 27 Spain 2.10-3 0.336 0.042 0.013 (Olivella et al., 2006)
PAHs (Σ15) Rainwater 6 France 0.031 0.105 0.060 0.061 (Bourdat-Deschamps et al., 2007)
PAHs (Σ11) Surface water 10 France 0.123 0.407 0.227 0.211 (Cailleaud et al., 2007)
Total hydrocarbons (mg/L)
TH Runoff water 56 France 0.1 4.9 2.3 - (Daligault et al ., 1999)
TH Runoff water 44 France 0.14 4.2 1.2 0.86 (Legret et al., 1999)
LAS (µg/L)
LAS (Σ C10-C13) Treated wastewater Raw wastewater 24 24 - 3400 21 10700 290 6329 68 5850 56 (Crescenzi et al., 1996)
LAS (Σ C10-C13) River water downstream a WWTP 8 UK 5 416 147 106 (Fox et al., 2000)
LAS (Σ C10-C13) Raw wastewater Treated wastewater Seawater 16 16 - Spain 104 11 0.67 1920 595 26 837 90 - - - - (Gonzalez et al., 2004)
LAS (Σ C10-C13) Seawater 3 Spain 11.7 64.4 22.7 17.7 (Lara-Martin et al, 2006)
MTBE (µg/L)
MTBE Runoff water Rainwater 35 12 Germany <0.010 0.030 0.085 1.174 0.032 0.204 0.024 0.114 (Achten et al, 2001) MTBE Potable water River water 5 3 Italy 0.05 0.10 0.40 0.15 0.17 0.12 0.08 0.10 (Piazza et al., 2001)
5/13
MATERIALS AND METHODS Sampling sites
Three carwashes were selected in Toulouse with the help of Veolia Water operators: Site 1 was a manual wash station that only serviced trucks; Site 2 was a self-service, high-pressure water jet carwash that serviced cars and motorcycles; Site 3 was located in a petrol station that offered a self-service high-pressure water jet and washing roller brushes. These three sites discharged wastewater into the stormwater network downstream of a pre-treatment system composed of a scrubber and an oil separator.
The two main stormwater outlets of Toulouse were selected to evaluate the stormwater quality. The “Boulevards” outlet corresponds to an urbanised catchment area of 439 hectares. The “Mirail” outlet drains water from a more rural catchment area of 1428 hectares.
Sampling method
Samples were collected and analysed between December 2006 and December 2007. Five 15 L samples were collected manually at each carwash from a pipe at the pre-treatment process exit, and they were homogenised to obtain a representative sample. Two automatic samplers were used to sample the two stormwater outlets during two dry events and eight rainy events over 24 hours. Amber glass bottles were filled to 1 L and stored at -25 °C until analysis.
Analysis
Routine classical parameters, including conductivity, pH and turbidity of total water samples were measured. Commercial tests (Spectroquant ®, Merck) were used to analyse chemical oxygen demand (COD), nitrogen (tot-N) and phosphorus (tot-P) on raw samples and to determine ammonium (N-NH4) and nitrate (N-NO3) in filtered samples. Suspended solid (SS) and volatile suspended solid (VSS) were investigated by filtration using NF-T90-105-1 and NF-T90-029, respectively.
Trace organic compounds were also analysed to complete the common characterisation procedures. Polycyclic aromatic hydrocarbons (PAHs) were analysed using liquid-liquid extraction and gas spectrometry with fluorescence detection according to NF EN ISO 17993. The 16 PAHs from the Environmental Protection Agency were measured: Naphthalene, Acenaphthylene, Acenaphthene, Fluorene, Phenanthrene, Anthracene, Fluoranthene, Pyrene, Benzo(a)anthracene, Chrysene, Benzo(b)fluoranthene, Benzo(k)fluoranthene, Benzo(a)pyrene, Indeno(1,2,3-cd)pyrene, Dibenzo(a,h)anthracene, Benzo(g,h,i)perylene. The limit of quantification (LOQ) for individual PAHs was 0.01 µg/L. Polychlorinated biphenyls (PCBs) were analysed with gas chromatography-mass spectrometry after a liquid-liquid extraction. Seven PCB congeners (from three to seven chlorines) with IUPAC numbers 28, 52, 101, 118, 138, 153, 180 were analysed. The limit of quantification for individual PCBs was 0.05 µg/L. Methyl tert-butyl ether (MTBE) was analysed with gas chromatography-mass spectrometry after head-space extraction with a limit of quantification of 1 µg/L. Total hydrocarbons (TH) were analysed using liquid-liquid extraction and gas chromatography equipped with a flame ionisation detector according to NF EN ISO 9377-2; the limit of quantification was 0.10 mg/L. Lauryl Alkyl Benzene Sulphonates (LAS) were quantified with liquid-liquid extraction and liquid chromatography coupled with diode array detector; the limit of quantification for the sum C10-C13 was 1 µg/L.
RESULTS AND DISCUSSION
Pollutant concentrations in carwash samples
For the five samples collected at each carwash station, the minimum, maximum, mean, median and standard deviation values were calculated and are reported in Table 2. Values less than the quantification limit were considered to be zero for statistical calculations.
Table 2. Water quality statistics determined for the three investigated carwashes. *Environmental
standards noted on the discharge licences of the three carwashes **Environmental standards decided by French legislation for surface water (Decree April 20th, 2005)
Units n Min. Max. Mean Median Standard
deviation Environmental standards Site 1: truck carwash
COD mg /L 5 539 1 506 949 654 462 125* Tot-P mg/L 5 16.5 53.2 35.5 29.6 15.6 10* Tot-N mg/L 5 8 19 12 11 4 30* NH4+ mgN/L 5 0.1 1.9 0.6 0.1 0.8 - NO3- mgN/L 5 0.5 1.6 1.1 1.0 0.4 - pH - 5 4.9 6.9 6.0 5.8 0.8 - Conductivity µS/cm 5 687 8450 4357 3849 2884 - Turbidity NTU 5 60 152 126 133 38 - SS mg/L 5 46 518 302 236 208 35* VSS % SS 5 10 40 22 13 14 - ΣΣΣΣ PAHs (16) µg/L 5 1.002 2.740 1.778 1.726 0.638 - Anthracene µg/L 5 <LOQ 0.037 0.014 0.016 0.015 0.1** Naphthalene µg/L 5 0.290 0.710 0.524 0.550 0.165 2.4** Benzo(a)pyrene µg/L 5 <LOQ 0.140 0.048 0.025 0.055 0.05** Benzo(b)fluoranthene µg/L 5 <LOQ 0.150 0.054 0.034 0.058 0.05** ΣΣΣΣ PCBs (7) µg/L 5 0.17 2.26 1.16 0.93 0.82 0.001** ΣΣΣΣ LAS mg/L 5 <LOQ 0.053 0.014 <0,001 <LOQ 0,023 0,023 - MTBE µg/L 5 <LOQ 12.0 2.4 <LOQ 5.4 -
TH mg/L 5 <LOQ 0.92 0.56 0.58 0.34 10*
Site 2: self-service carwash
COD mg/L 5 80 421 239 185 145 125* Tot-P mg/L 5 4.0 99 28 5.4 41 10* Tot-N mg/L 5 6 14 9 8 3 30* NH4+ (filtered) mgN/L 5 0.1 0.5 0.3 0.1 0.2 - NO3 - (filtered) mgN/L 5 0.5 1.1 0.7 0.7 0.2 - pH - 5 8.6 9.6 9.1 9.2 0.4 - Conductivity µS/cm 5 562 2880 1457 1273 958 - Turbidity NTU 5 42 203 100 80 68 - SS mg/L 5 35 223 130 124 67 35* VSS % SS 5 24 89 50 47 26 - ΣΣΣΣ PAHs (16) µg/L 5 0.016 0.826 0.372 0.361 0.318 - Anthracene µg/L 5 <LOQ <LOQ <LOQ <LOQ - 0.1** Naphthalene µg/L 5 <LOQ 0.210 0.079 0.075 0.087 2.4** Benzo(a)pyrene µg/L 5 <LOQ 0.038 0.010 <LOQ 0.016 0.05** Benzo(b)fluoranthene µg/L 5 <LOQ 0.041 0.013 0.010 0.017 0.05** ΣΣΣΣ PCBs (7) µg/L 5 0.01 1.21 0.41 0.11 0.52 0.001** ΣΣΣΣ LAS mg/L 5 8.10 64.00
24,542 20.12 9,800 9.80 24.54 - MTBE µg/L 5 <LOQ 1.5 0.3 <LOQ 0.7 -
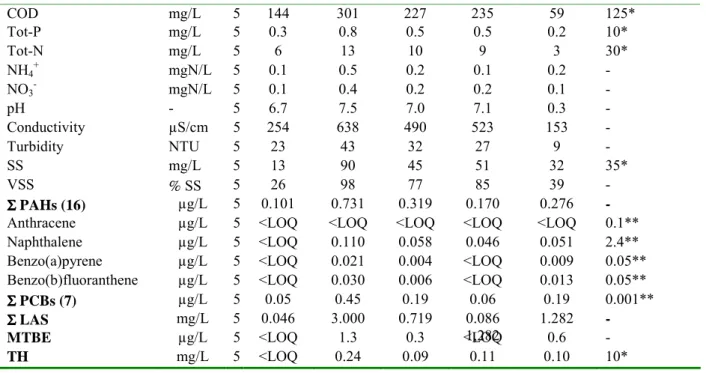
7/13 Site 3: petrol station carwash
COD mg/L 5 144 301 227 235 59 125* Tot-P mg/L 5 0.3 0.8 0.5 0.5 0.2 10* Tot-N mg/L 5 6 13 10 9 3 30* NH4+ mgN/L 5 0.1 0.5 0.2 0.1 0.2 - NO3- mgN/L 5 0.1 0.4 0.2 0.2 0.1 - pH - 5 6.7 7.5 7.0 7.1 0.3 - Conductivity µS/cm 5 254 638 490 523 153 - Turbidity NTU 5 23 43 32 27 9 - SS mg/L 5 13 90 45 51 32 35* VSS % SS 5 26 98 77 85 39 - ΣΣΣΣ PAHs (16) µg/L 5 0.101 0.731 0.319 0.170 0.276 - Anthracene µg/L 5 <LOQ <LOQ <LOQ <LOQ <LOQ 0.1** Naphthalene µg/L 5 <LOQ 0.110 0.058 0.046 0.051 2.4** Benzo(a)pyrene µg/L 5 <LOQ 0.021 0.004 <LOQ 0.009 0.05** Benzo(b)fluoranthene µg/L 5 <LOQ 0.030 0.006 <LOQ 0.013 0.05** ΣΣΣΣ PCBs (7) µg/L 5 0.05 0.45 0.19 0.06 0.19 0.001** ΣΣΣΣ LAS mg/L 5 0.046 3.000 0.719 0.086
1,282 1.282 - MTBE µg/L 5 <LOQ 1.3 0.3 <LOQ 0.6 -
TH mg/L 5 <LOQ 0.24 0.09 0.11 0.10 10*
Pollutant concentrations in outlets samples
Mean and standard deviation values were calculated from the ten values for each parameter measured at the two outlets (Table 3). Values less than the quantification limit were considered to be zero for statistical calculations.
Table 3. Water quality statistics of the two investigated outlets. *Environmental standards noted on
the discharge licences of the three carwashes **Environmental standards decided by French legislation for surface water (Decree April 20th, 2005)
Units n Min. Max. Mean Median Standard
deviation Environmental standards Outlet 1: Boulevard COD mg /L 10 80 31 156 80 67 43 125* Tot-P mg/L 10 0.6 1.2 0.8 0.7 0.2 10* Tot-N mg/L 10 6 54 18 10 19 30* NH4+ mgN/L 10 0.1 4.9 1.0 0.1 2.0 - NO3- mgN/L 10 2.7 6.5 4.1 4.0 1.1 - pH - 10 7.1 8.3 7.5 7.4 0.3 - Conductivity µS/cm 10 202 620 398 398 122 - Turbidity NTU 10 3.1 21.0 12.0 11.8 4.4 - SS mg/L 10 7.7 50.2 30.1 35.8 17.4 35* VSS % SS 10 20.5 94.7 56.2 48.6 30.4 - ΣΣΣΣ PAHs (16) µg/L 10
80 <LOQ 0.067 <LOQ <LOQ - -
Anthracene µg/L 10
80 <LOQ <LOQ <LOQ <LOQ - 0.1** Naphthalene µg/L 10 <LOQ 0.018 <LOQ <LOQ - 2.4** Benzo(a)pyrene µg/L 10 <LOQ <LOQ <LOQ <LOQ - 0.05** Benzo(b)fluoranthene µg/L 10 <LOQ <LOQ <LOQ <LOQ - 0.05** ΣΣΣΣ PCBs (7) µg/L 10 0.06 0.51 0.28 0.30 0.001**
ΣΣΣΣ LAS µg/L 10 43 590 252 87 -
MTBE µg/L 10
80 <LOQ 1.9 0.2 <LOQ -
Outlet 2: Mirail COD mg/L 10 80 29 146 61 46 37 125* Tot-P mg/L 10 0.1 0.2 0.2 0.2 0.0 10* Tot-N mg/L 10 4.0 38 14 10 13 30* NH4+ mgN/L 10 0.1 1.0 0.2 0.1 0.3 - NO3- mgN/L 10 2.3 4.5 3.1 2.7 0.8 - pH - 10 7.1 8.1 7.5 7.4 0.3 - Conductivity µS/cm 10 235 489 317 303 81 - Turbidity NTU 10 4.0 22.1 12.3 11.3 6.1 - SS mg/L 10 7.6 46.5 26.9 32.0 14.5 35* VSS % SS 10 25.8 80.9 50.7 46.3 18.8 - ΣΣΣΣ PAHs (16) µg/L 10 80
<LOQ 0.15 <LOQ <LOQ - - Anthracene µg/L 10 <LOQ <LOQ <LOQ <LOQ - 0.1** Naphthalene µg/L 10 <LOQ 0.14 <LOQ <LOQ - 2.4** Benzo(a)pyrene µg/L 10 <LOQ <LOQ <LOQ <LOQ - 0.05** Benzo(b)fluoranthene µg/L 10 <LOQ <LOQ <LOQ <LOQ - 0.05** ΣΣΣΣ PCBs (7) µg/L 10 <LOQ 0.56 0.27 0.27 0.1 0.001** ΣΣΣΣ LAS µg/L 10
80
6.2 920 245 30 56 -
MTBE µg/L 10 <LOQ 30 3.3 <LOQ 2.5 -
TH mg/L 10 <LOQ <LOQ <LOQ <LOQ - 10*
The pH and Tot-P levels measured at the two outlets were lower than levels suggested by the carwash licences. Conductivity values were highly variable throughout the year and ranged between 200 and 600 µS/cm. Two events led to high concentrations in COD and Tot-N. Half of the samples had SS values higher than the threshold value.
Globally, trace organic compound levels measured in this study were consistent with previous reports (Cailleaud et al., 2007; Mateley-Massei et al., 2006; Xaumier et al., 2004; Achten et al., 2001; Piazza et al., 2001; Legret et al., 1999). TH, MTBE and PAH levels were quite low and difficult to quantify. PCBs and LAS were detectable in every sample. These levels were similar in magnitude to that found in runoff water (Rossi et al., 2004; Blanchard et al., 2001). Concentrations of PAHs, PCBs, MTBE and LAS were higher at the Mirail outlet than at the Boulevard outlet.
Pollutants loads
The carwashes consumed water at rates of 5 226 m3/year, 3 800 m3/year, 1 372 m3/year for sites 1, 2 and 3, respectively. Water flow rates at the outlets are presented in Table 4. These data indicate that the year-averaged hourly water consumption rate of a single carwash was less than 0.6 m3/h. This flow is negligible compared to the flow at the outlet during a rain event, which can reach 6507 m3/h.
Table 4. Statistical data on flows (m3/h) of the two outlets over the ten sampling periods
n Minimum Maximum Mean Median Standard deviation
Dry period 2 26 201 61 61 9
“Boulevards”
outlet Rainy period 8 14 6 507 194 164 365
Dry period 2 7 75 36 36 2
“Mirail”
outlet Rainy period 8 6 418 66 72 38
The yearly pollutant loading for carwashes was calculated according to the equation presented in Equation 1, which gives a mass of pollutant per year.
9/13
Equation 1. Yearly pollutant loadings for a carwash (j). xp,j is the average load of a pollutant (p)
over a year for the carwash (j). xi,p,j is the average concentration of a pollutant (p) for the sampling event (i) for the carwash (j). yj is the water consumption of the carwash (j) for one year.
j p x , = j n i j p i y x n
∑
=1 , , × 1The yearly pollutant loadings for each parameter measured at the outlets were calculated for 2 dry events and 8 rainy events according to Equation 2. Values less than the quantification limit were considered to be zero for the calculation.
Equation 2. Yearly pollutant loading for an outlet (o). Lp,o is the load of a pollutant (p) over one
year for the outlet (o).
∑
= n d d o p L 1 , ,is the load of a pollutant (p) for the outlet (o) in dry periods (d) (in this case n=2).
∑
= m r r o p L 1 , ,is the load of a pollutant (p) for the outlet (o) in rainy periods (r) (in this case m=8). xp,o,d represents the concentration of the pollutant (p) at the outlet (o) during the dry periods studied (d). fo,d is the water flow at the outlet (o) during the dry periods studied (d). t is the
duration of dry periods over a year. xp,o,r represents the concentration of the pollutant (p) at the outlet (o) during the rainy period (r). fo,r is the water flow rate at the outlet (o) during the rainy
period (r). tr is the duration of the rainy period (r). w is the yearly precipitation. Lp,o =
∑
∑
= = + m r r o p n d d o p L L 1 , , 1 , , with∑
= n d d o p L 1 , , =∑
(
)
= × × n d d o d o p f t x n 1 , , , 1 and∑
= = m r r o p L 1 , ,∑
= × × m r or r o r o r o p w t f x m 1 , , , , , 1 w ×Table 5 presents the calculated yearly pollutant loadings.
Table 5. Calculated pollutant loads for the three carwashes and the two outlets over a year
Parameter unit Site 1 Truck carwash Site 2 Self-service carwash Site 3 Petrol station carwash Outlet 1 Boulevard Outlet 2 Mirail COD kg/year 4962 907 311 100 612 32 538 Tot-P kg/year 186 106 0.7 1 099 65 Tot-N kg/year 65 33 13 23 961 7 765 NH4-N kg/year 3 1 0.3 1 185 197 NO3-N kg/year 6 3 0,3 4 457 1 555 SS kg/year 1578 419 61 40 656 9 494 VSS kg/year 234 142 39 15 692 3 291 ΣPAHs (16) g/year 9.3 1.4 0.44 15 - ΣPCBs (7) g/year 6.1 1.6 0.26 322 64 DEHP g/year 211 27.8 7.88 14 359 10 186 ΣLAS (4) g/year 73 76456 986 324 142 52 992 HT g/year 2916 91 126 - - MTBE g/year 13 1.1 0.36 416 5 271
Impact of carwashes on stormwater quality
As carwashes are allowed to drain their liquid waste into the stormwater system, it is interesting to compare loads from carwashes to the total pollution loads at outlets.
An inventory of the organisations that own discharges licences was determined for each catchment area: 22 licenced establishments contributed to the “Boulevards” outlet, compared to 8 for the “Mirail” outlet. These included residences, car parks, garage/workshop. We decided to represent all carwash organisations by one of the three carwashes studied. The configuration finally chosen for the two outlets studied was two self-service carwashes, two petrol station carwashes and one truck carwash. Figures 1 and 2 compare the pollutant loads derived from this configuration and that calculated for the two outlets.
Figure 1. Contribution of carwashes to pollution loading at the “Boulevards” outlet
0% 10% 20% 30% 40% 50% 60% 70% 80% 90% 100% COD Tot-P Tot-N NH4+ NO3 -SS VS S PA Hs PC Bs LAS TH MTB E Carwash contribution
-Figure 2. Contribution of carwashes to pollution loadings at the “Mirail” outlet
0% 10% 20% 30% 40% 50% 60% 70% 80% 90% 100% CO D Tot-P Tot-N NH 4+ NO 3- SS VS S PA Hs PC Bs LAS TH MTB E Carwash contribution
-11/13 The results indicate that the pollution derived from carwashes is variable between the outlets studied; the “Mirail” outlet seems to be more sensitive to carwash pollution. For both outlets, the pollution parameters that were broadly attributable to carwash stations were LAS, phosphorus and PAHs. During dry periods, the bulk of these pollutants appeared to derive from carwash stations.
CONCLUSIONS
This study evaluated the impact of carwash discharge on the quality of stormwater in a city equipped with separated stormwater and wastewater sewer systems. We screened classical pollutant parameters and organic pollutants in carwash wastewater and outlet runoff. The results suggest that, for at least one of the three carwashes studied, the measured pollutant concentrations in carwash discharge was more similar to the levels found in wastewater than in runoff stormwater. We also compared the pollutant loadings of carwash discharge to that of two stormwater outlets. Water consumption of carwashes was negligible compared to the volume and flow rate of the stormwater system. However, high concentrations of total phosphorus, PAHs and LAS were identified as contaminants in liquid waste from carwashes. The negative impact of carwash discharge in stormwater sewers was identified, and it is completely dependent on the number of carwashes.
ACKNOWLEDGMENTS
This work was supported by Veolia Water Technical Direction (Toulouse, France) with the grant n° 20040101. We would like to thank Bernard Sentenac for his technical support.
REFERENCES
Achten C., Kolb A. and Püttman W. (2001). Methyl tert-butyl ethet (MTBE) in urban and rural precipitation in Germany. Atmospheric Environment, 35, 6337-6345.
Barraud S., Gautier A., Bardin J.P. and Riou V. (1999). The impact of intentional stormwater infiltration on soil and groundwater. Water Science & Technology, 39(2), 185-192.
Blanchard M., Teil M.J., Ollivon D., Garban B., Chesterikoff C. and Chevreuil M. (2001). Origin and distribution of polyaromatic hydrocarbons and polychlorobiphenyls in urban effluents to wastewater treatment plants of the Paris area (France). Water Research, 35(15), 3679-3687.
Bourdat-Deschamps M, Daudin J-J. and Barriuso E. (2007). An experimental design approach to optimise the determination of polycyclic aromatic hydrocarbons from rainfall water using stir bar sorptive extraction and high performance liquid chromatography-fluorescence detection. Journal of
chromatography A. 1167, 143-153.
Cailleaud K., Forget-Leray J., Souissi S., Lardy S., Augagneur S. and Budzinski H. (2007). Seasonal variations of hydrophobic organic contaminant concentrations in the water-column of the Seine estuary and their transfer to a planktonic species Eurytemora affinis (Calanoïd, copepod). Part 1: PCBs and PAHs. Chemosphere, 70, 270-280.
Chevreuil M., Granier L., Chersterikoff A. and Letolle R. (1990). Polychlorinated biphenyls partitioning in water from river, filtration plant and wastewater plant: the case for Paris (France).
Water Research, 24, 1325-1333.
Clark J. W., Viessman W. and Hammer M. J. (1971). Water supply and pollution control, 2nd ed., International Textbook Company, pp. 44-45.
Crescenzi C., Di Corcia A., Marchiori E., Samperi R. and Marcomini A. (1996). Simultaneous determination of alkylbenzenesulfonates and dialkyltetralinsulfonates in water by liquid chromatography. Water Research, 30(3), 722-730.
Daligault A., Meaudre D., Arnaud D., Duc D., Bardin N., Aires N., Biau D., Schmid J., Clement P. and Viau J.Y. (1999). Stormwater and lamella settlers: efficiency and reality. Water Science and
Technology, 39(2), 93-101.
Decree April 20th (2005). National action program on aquatic pollution by selected dangerous substances. Environmental standards given in May 7th, 2007 reinforced version of April 20th, 2005 Available : http://texteau.ecologie.gouv.fr/texteau/ServletUtilisateurAffichageTexte?idTexte=858 (Accessed 15 february 2010)
European Commission (2000) Water Framework Directive 2000/60/EC. Available: http://eur-lex.europa.eu/pri/en/oj/dat/2000/l_327/l_32720001222en00010072.pdf (Accessed 15 february 2010)
Fernandes M.B., Sicre M.A., Boireau A. and Tronszynski J. (1997). Polyaromatic hydrocarbon (PAH) distributions in the Seine River and its estuary. Marine Pollution Bulletin, 34, 857-867. Fox K., Holt M., Daniel M., Buckland H. and Guymer I. (2000). Removal of linear alkylbenzene sulfonate from a small Yorshire stream: contribution to GREAT-ER projet #7. The science of the
total environment, 251, 265-275.
Gonzalez S., Petriovis M.and Barcelo D. (2004). Simultaneous extraction and fate of linear alkybenzene sulfonates, coconut diethanol amides, nonyphenol ethoxylates and their degradation products in wastewater treatment plants, receiving coastal waters and sediments in the Catalonian area (NE Spain), Journal of chromatography A, 1052, 111-120.
Katsoyiannis A. and Samara C. (2004). Persistant organic pollutants (POPs) in the sewage treatment plant of Thessaloniki, northern Greece: occurrence and removal. Water Research, 38, 2685-2698. Kolb A. and Püttman W. (2006). Methyl tert-butyl ether (MTBE) in finished drinking water in Germany. Environmental Pollution, 140, 294-303.
Lara-Martin P.A., Gomez-Parra A. and Gonzales-Mazo E. (2006). Simultaneous extraction and determination of anionic surfactants in waters and sediments. Journal of chromatography A, 1114, 205-210.
Law R.J., Dawes V.J., Woodhead R.J. and Mattthiessen P. (1997). Polycyclic aromatic hydrocarbons (PAH) in seawater around England and Wales. Marine Bulletin Pollution, 34, 306-322.
Legret M. and Pagotto C. (1999). Evaluation of pollutant loadings in the runoff waters from a major rural highway. The Science of The Total Environment, 235, 143-150.
Manodori L., Gambaro A., Pazza R., Ferrari S., Stortini A.M., Moret I. and Capodaglio G. (2006). PCBs and PAHs in sea-surface microlayer and sub-surface water sample of the Venice Lagoon (Italy). Marine Pollution Bulletin, 52, 184-192.
Moilleron R., Gonzalez A. and Thevenot D. R. (2001). Aromatic and aliphatic hydrocarbons distribution (in french). Techniques Sciences et Méthodes, 5, 60-71.
13/13 Motelay-Massei A., Garban B., Tiphagne-Larcher K., Chevreuil M. and Ollivon D. (2006). Mass balance for polycyclic aromatic hydrocarbons in the urban watershed of Le Havre (France): Transport and fate of PAHs from atmosphere to the outlet. Water Research, 40, 1995-2006.
Olivella M.A., Ribalta T.G., De Febrer A.R., Mollet J.M. and De Las Heras F.X.C. (2006). Distribution of polycyclic aromatic hydrocarbons in riverine waters after Mediterranean forest fires.
Science of the total environment, 355, 156-166.
Piazza F., Barbieri A., Violante F.S. and Roda A. (2001). A rapid and sensitive method for methyl tert-butyl ether analysis in water samples by use of solid microextraction and gas chromatography-mass spectrometry. Chemosphere, 44, 539-544.
Popp P., Bauer C. and Wennrich L. (2001). Application, of stir bar sorptive extraction in combination with column liquid chromatography fort he determination of polycyclic aromatic hydrocarbons in water samples. Analytica Chimica Acta, 436, 1-9.
Rossi L., De Alencastro L., Kupper T. and Tarradellas J. (2004). Urban stormwater contamination by polychlorinated biphenyls and its importance for urban water systems in Switzerland. The
Science of The Total Environment, 332, 179-189.
Sanderson H.S., Dyer S.D., Price B.B., Nielsen A.M., Van Compernolle R., Selby M., Stanton K., Evans A., Ciarlo M. and Sedlak R. (2006). Occurrence and weight-of-evidence risk assessment of alkyl sulfates, alkyl ethoxysulfates, and linear alkylbenzene sulfinates (LAS) in river water and sediments. Science of the total environment, 368, 695-712.
Waid J.S. (1996). PCBs and the environment. 3 vols. Vol. 1. Boca Raton, Florida: CRC Press. Walker W. J., McNutt R. P. and Maslanka C. K. (1999). The potential contribution of urban runoff to surface sediments of the Passaic river: sources and chemical characteristics. Chemosphere, 38(2), 363-377.
Xaumier F., Montréjaud-Vignoles M. and Renner C. (2004). Study of the Toulouse (France) urban runoff (in french), Interne report, Veolia Eau - Anjou Recherche - INP-ENSIACET-LCA, pp. 100.