HAL Id: pastel-00787972
https://pastel.archives-ouvertes.fr/pastel-00787972
Submitted on 13 Feb 2013
HAL is a multi-disciplinary open access archive for the deposit and dissemination of sci-entific research documents, whether they are pub-lished or not. The documents may come from teaching and research institutions in France or abroad, or from public or private research centers.
L’archive ouverte pluridisciplinaire HAL, est destinée au dépôt et à la diffusion de documents scientifiques de niveau recherche, publiés ou non, émanant des établissements d’enseignement et de recherche français ou étrangers, des laboratoires publics ou privés.
climate of the past 150 years and on the projected
climate of the 21st century.
Juan Pablo Boisier
To cite this version:
Juan Pablo Boisier. Assessing the robust impacts of land use change on the climate of the past 150 years and on the projected climate of the 21st century.. Earth Sciences. Ecole Polytechnique X, 2012. English. �pastel-00787972�
Filière Mécanique Spécialité Sciences du Climat
Presentée par
Juan Pablo B
OISIERpour obtenir le grade de
Docteur de l’École Polytechnique
Assessing the robust impacts of land-use change on the climate of the
past 150 years and on the projected climate of the 21st century
Efectuée au Laboratoire des Sciences du Climat et de l’Envirronnement (CEA/CNRS/UVSQ)
Présentée et soutenue le 9 Novembre 2012 devant le jury composé de
Hervé LE TREUT, Lab. de Météorologie Dynamique, École Polythecnique Président du Jury
Richard A. BETTS, Met Office Hadley Centre Rapporteur
Gerhard KRINNER, Lab. de Glaciologie et Géophysique de l’Environnement Rapporteur
Sonia I. SENEVIRATNE, Institute for Atmospheric and Climate Science, ETH Examinateur
Stephen SITCH, University of Exeter Examinateur
Bart J. J. M. VAN DEN HURK, Royal Netherlands Meteorological Institute Examinateur
Cette thèse fut le résultat d'une recherche de plus de trois ans qui n’aurait pas été possible sans le soutien de nombreuses personnes. Je voudrais en premier temps remercier ma directrice de thèse, Nathalie de Noblet, qui a accepté de m'encadrer sans connaissance de mon expérience précédente et qui a dirigé cette étude avec un grand enthousiasme. Merci beaucoup de cette confiance et énergie, qui fut très encourageante pour aboutir les différentes étapes de ce parcours. De ma part, le sujet de l’interaction végétation-atmosphère a été abordé pour la première fois au début de cette thèse. En plus de l’expérience transmise le long de ces années dans ce domaine spécifique, Nathalie m'a rapidement introduit dans la dynamique de la recherche scientifique, notamment dans ce qui concerne le travail en collaboration, la façon de synthétiser les résultats, ainsi que la divulgation des ceux-ci.
Je tiens à remercier tous les participants du projet LUCID qui ont vu leurs boîtes émail encombrées des questions et demandes de données, lesquelles ont été opportunément répondues. Je voudrais remercier particulièrement Andy Pitman et sa disposition pour travailler à distance et à n'importe quelle heure. Les discussions avec Andy, Nathalie, Sonia Seneviratne et Bart van den Hurk ont été également très motivantes.
Je voudrais remercier Philippe Ciais pour son grand appui, fondamental pour le bon déroulement de la partie finale de cette thèse. Je tiens aussi à remercier les rapporteurs de ce manuscrit, Richard Betts et Gerhard Krinner, ainsi qu’à l'ensemble du jury, par leurs commentaires constructifs et valorisants, et leurs recommandations pour les études en prospectives.
Un grand merci aussi à toutes les personnes qui font du LSCE un endroit très agréable et accueillant, idéal pour un étudiant s'embarquant dans une thèse. Merci Aude, collègue de bureau, de ta compagnie et aussi de répondre mes incessantes questions linguistiques. Merci Arnaud, Juliette, Patricia et tout le bâtiment 712, de vôtre bon esprit et disposition.
La réussite de cette aventure fut possible grâce au soutien et affection infinie de ma petite famille en France, laquelle a pris forme au cours de ces années et qui m’a accompagné chaleureusement. Merci Amarí et José Nahuel. Tous mes sentiments aussi aux proches, famille et amis, en France et dans l’autre bout du globe, qui ont été toujours présents.
Cette thèse a été partiellement financée par des bourses d’études issues de la Commission Nationale d’investigation scientifique et Technologique du Chili (CONICYT) et de l’association ÉGIDE, et par le projet européen FP7-AMAZALERT.
A ce jour, les hommes ont modifié plus de la moitié des surfaces habitables pour leurs activités agricoles. Le changement de l’occupation des sols qui en résulte a une influence importante sur le climat à l’échelle du continent de par les modifications des propriétés physiques de la surface. Le niveau de connaissance de ces impacts biogéophysiques est cependant insuffisant, en raison notamment des nombreux processus impliqués. Via l’intercomparaison de modèles de climat et d’autres outils développés, cette thèse vise à identifier les signaux climatiques robustes liés au changement d’occupation des sols, ainsi qu’à évaluer les incertitudes associées. Depuis l’époque préindustrielle, le changement d’usage des sols a résulté en une déforestation extensive dans les régions tempérées de l’hémisphère Nord, où l’augmentation de l’albédo de surface a sûrement induit un refroidissement durant l’hiver et le printemps. Les rétroactions atmosphériques et les effets non radiatifs, comme par exemple la perturbation du cycle hydrologique, ont très probablement amorti ce refroidissement. L’amplitude des effets climatiques en hiver ainsi que le rôle des effets non radiatifs en été (et le changement résultant de températures) reste pourtant très incertain parmi les modèles. Ces incertitudes répondent (1) à la façon dont le changement de l’occupation des sols est représenté dans les modèles de surface et (2) aux sensibilités intrinsèques des modèles de climat aux perturbations de la couverture végétale. Nous avons démontré que le deuxième point explique plus de 50% de la dispersion inter-modèle dans des variables clés au climat de surface comme l’évapotranspiration. Suite à cette incertitude, des outils statistiques ont été développés pour reconstruire les impacts du changement d’occupation des sols dans certaines variables à partir d’observations contemporaines. L’évolution passée de l’albédo de surface a été inférée à partir de données satellites et les cartes de végétation prescrites dans les modèles de surface ici évalués. Cette technique a permis non seulement de faire une estimation réaliste des changements d’albédo, mais aussi d’avoir une référence à laquelle comparer les résultats simulés. Bien que l’ensemble des modèles ne montre pas un biais systématique par rapport aux estimations, les simulations de chaque modèle diffèrent largement des leurs estimations. Une analyse similaire a été faite pour l’évapotranspiration à partir de produits globaux issus d’observations. L’ensemble de ces analyses montre que les incertitudes actuelles des effets sur le climat du changement d’occupation des sols sont en grande partie liées aux paramétrisations de surface des modèles de climat, et peuvent donc être réduites par une évaluation plus rigoureuse des modèles de surface.
Humans, through land-use activities, have modified more than half of the global habitable landscapes. Land-use induced land cover change (LULCC) is an important climate forcing at the continental scale due to the underlying alterations of the properties of the soil-vegetation system. However, the knowledge of these biogeophysical impacts of LULCC is middling, notably due to the large number of processes involved. By means of model intercomparison and other approaches specifically developed, this study aims to identify the robust climate signals of LULCC as well as to assess the associated uncertainties. LULCC since the preindustrial period has led to extensive deforestation in the northern temperate regions and therefore to increases in surface albedo. This radiative effect has very likely cooled down the surface during the winter and spring. Atmospheric feedbacks and non-radiative effects of LULCC, such as perturbations in the hydrological cycle, tend to dampen this cooling. The amplitude of the winter impacts and the role of the non-radiative effect in summer (and the resulting changes in temperature) are still quite uncertain within the model results. These uncertainties respond (1) to the way LULCC is implemented in land surface models (LSMs) and (2) to the inherent model sensitivities to land-cover perturbations and the resulting changes in both the surface radiation budget and turbulent exchanges. We show that the second point could explain more than 50% of the inter-model dispersion in key variables for the surface climate such as the evapotranspiration. We therefore developed statistical tools to reconstruct the impacts of LULCC in some variables from present-day observations. Satellite surface albedo data were projected to the past based on the same land-cover maps prescribed in the LSMs here assessed. This technique, besides representing a realistic estimation of the past albedo changes, brings a benchmark for model results. Although there is no systematic bias in the simulated changes in albedo with respect to those estimated, there are large differences between the individual model results and the observations-based ones. A similar analysis was performed for evapotranspiration, based on global products of this variable derived from observations. The analyses carried out here show that current uncertainties in the climate impacts of LULCC are in major part the result of the land-surface parameterizations used in climate models and, hence, could be reduced with a more thoroughly evaluation of LSMs.
Remerciements...1
Résumé...2
Abstract ...3
Table of contents ...4
Symbols and acronyms ...8
Chapter 1 General introduction
1.1. Vegetation in the climate system...91.1.1. Role of terrestrial ecosystems in the global biochemical and hydrological cycles ...9
1.1.2. Water and energy budget in vegetated surfaces...10
1.2. Modeling the land surface ...12
1.3. Historical land-use induced land-cover change ...15
1.4. LULCC-induced changes in climate...16
1.4.1. Biogeophysical impacts ...16
1.4.1.1. Radiative effects...17
1.4.1.2. Non-radiative effects ...18
1.4.1.3. Indirect impacts and feedbacks ...20
1.4.2. Biogeochemical impacts...21
1.5. Thesis outlook: motivation, objectives and structure...22
Chapter 2 Impacts of LULCC on climate between the preindustrial period
and present-day: Results from the LUCID intercomparison project
2.1. LUCID project ...242.1.1. Experimental setup and models ...25
2.2. General methodology and flux convention ...30
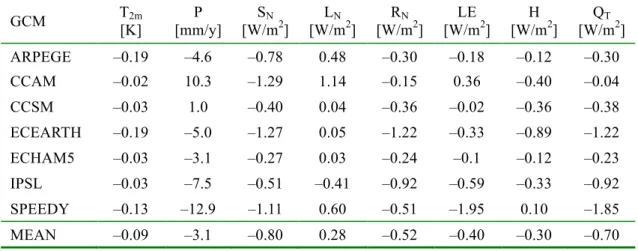
2.3. Large-scale changes on surface climate ...31
2.4. Impacts of LULCC in the Northern Hemisphere temperate regions ...36
2.4.1. How large are the land-use effects at the regional scale? The problem of attributing climate changes to GHGs without taking in account LULCC ...37
2.4.2. Differences in the imposed LULCC and resulting inter-model dispersion ...40
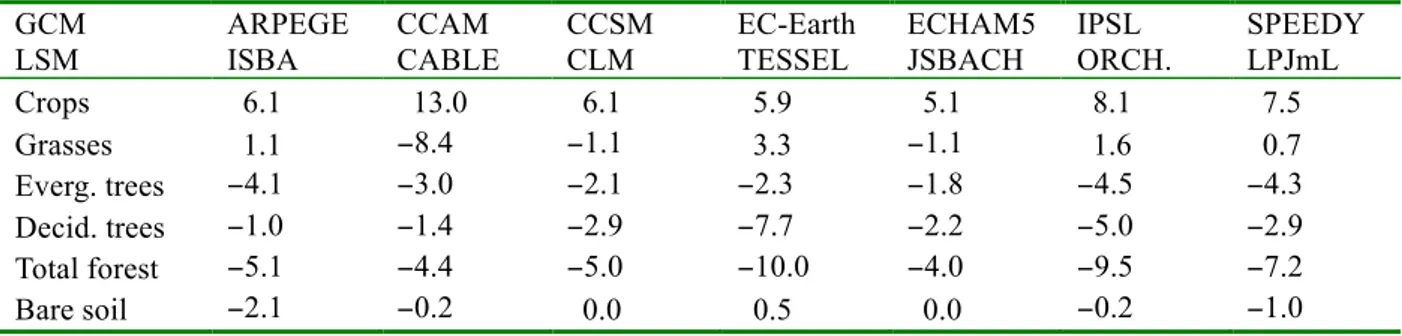
2.4.3. Related changes in surface properties, energy fluxes and temperature ...45
2.4.3.1. Changes in surface albedo and radiative effects ...45
2.4.3.2. Changes in canopy density, surface roughness and turbulent heat fluxes...48
2.4.3.3. Changes in available energy, in turbulent energy flux and temperature responses ...51
2.4.4. Paper: Determining robust impacts of land-use-induced land cover changes on surface climate over North America and Eurasia: results from the first set of LUCID experiments (by de Noblet-Ducoudré et al.)...54
2.4.5. Paper: Attributing the impacts of land-cover changes in temperate regions on surface temperature and heat fluxes to specific causes. Results from the first LUCID set of simulations...76
2.5. Chapter summary and conclusions...93
Appendix 2.1: Individual model responses...96
Chapter 3 Surface albedo and evapotranspiration changes due to past
LULCC estimated from global observations
3.1. Chapter introduction...1013.2. Paper: Inferring past land use induced changes in surface albedo from satellite observations: A useful tool to evaluate model simulations...103
3.2.1. Introduction...104
3.2.2. Material and methods ...106
3.2.3. Results...109
3.2.3.1. Method evaluation: Reconstruction of the present-day MODIS-based albedo...109
3.2.3.2. Albedo changes between 1870 and 1992 ...112
3.2.3.3. Evaluating LUCID model’s snow cover and the albedo sensitivity to LCC...115
3.2.3.4. Impacts on the surface shortwave radiation budget...119
period estimated with current observations-based gridded products ...127
3.3.1. Introduction...128
3.3.2. Material and methods ...130
3.3.2.1. Datasets ...130
3.3.2.2. Region Multivariate Regression...133
3.3.3. Results...136
3.3.3.1. Annual mean evapotranspiration change...136
3.3.3.2. Seasonal changes in the northern extratropics ...140
3.3.4. Discussion...146
3.3.5. Conclusions...148
3.4. Chapter summary ...152
Chapter 4 Land-use and climate changes from the preindustrial period to
the end of the 21
stcentury
4.1. Introduction ...1534.2. LUCID-CMIP5 set of simulations ...156
4.2.1. Representative Concentration Pathways and land-use scenarios ...156
4.2.2. Land-use Harmonization (LUH) dataset and ORCHIDEE land-cover maps...157
4.2.3. IPSL Earth System Model ...161
4.2.4. Modeling experiment...162
4.3. Biogeophysical impacts of LULCC ...164
4.3.1. Methods ...164
4.3.2. Temperature responses to LULCC ...166
4.3.3. Changes in the surface energy fluxes ...170
4.3.4. Changes in the hydrological cycle...174
4.3.5. Overview...179
4.4. Biogeochemical effects of LULCC...183
4.5. Prospective: Projected land-use and climate changes in the Amazon...185
4.5.1. Current and projected land-cover changes in the Amazon ...186
Appendix 4.1 ...197
General conclusions
...199 References ...205Symbols
Acronyms
α Surface albedo ε Surface emissivity E Evaporation EF Evaporative fraction ET EvapotranspirationG Ground heat flux
H, QH Sensible heat flux
L Latent heat of vaporization
LE, QLE Latent heat flux
LD Downward longwave radiation at
the surface
LU Upward longwave radiation at the
surface
P Precipitation
QA Available energy at the surface (SN + LD)
QT Total turbulent energy flux (QLE + QH)
RN Net radiation at the surface
SD Downward shortwave radiation
at the surface
SN Net shortwave radiation at the surface
SU Upward shortwave radiation at the surface
T2m 2-meter temperature
TS Surface temperature
Z0 Surface roughness
AVHRR Advanced Very High Resolution Radiometer
CMIP5 Coupled Model Intercomparison Project – Phase 5
GCM Global Climate Model
GEWEX Global Energy and Water Cycle Experiment
GLASS Global Land/Atmosphere System Study
GPCP Global Precipitation Climatology Project
IGBP International Geosphere- Biosphere Programme iLEAPS Integrated Land Ecosystem-
Atmosphere Processes Study IPCC Intergovernmental panel on
Climate Change
IPSL Institut Pierre Simon Laplace
LAI Leaf Area Index
LCC Land Cover Change
LSM Land Surface Model
LUCID Land-Use and climate, IDentifica-tion of robust impacts (project) LULCC Land-Use induced Land-Cover
Change
MODIS Moderate resolution imaging spectroradiometer
NH Northern Hemisphere
PFT Plant Functional Type
RF Radiative Forcing
SH Southern Hemisphere
SEB Surface Energy Budget
SIC Sea-Ice Concentration
SST Sea-Surface Temperature
Chapter 1
General introduction
Land-use change has been one of the major and more visible ways in which humans have modified the Earth and its climate. It has likely been the major anthropogenic climate forcing before the industrial revolution and has continued to be a leading driver of climate change since then. Nowadays, more than half of the ice-free lands are occupied by human settlements and agricultural activities. This study addresses the physical impacts on climate of large-scale land-use induced land-cover change (LULCC). In this introduction, a general background on the interactions between land-surface and the atmosphere is given, as well as a review of past research on the historical and potential effects on climate of land-use changes. Since a major part of the results described in the following chapters involve climate simulations with a particular emphasis on land-atmosphere interactions, an overview of the land surface modeling is also presented here.
1.1 Vegetation in the climate system
1.1.1 Role of terrestrial ecosystems in the global biogeochemical and hydrological cycles Plants are the main engines of the global carbon cycle. About 120 gigatons of carbon (GtC) –equivalent to 15% of the carbon dioxide (CO2) contained in the atmosphere– are
allocated in terrestrial ecosystems every year through plant photosynthesis (biomass production). The same amount of carbon is sent back to the atmosphere by means of plant respiration and litter decomposition (in approximately equal parts; Denman et al., 2007). These values are higher but of the same order than the annual carbon exchanges between the ocean and the atmosphere. Hence, terrestrial ecosystems and the ocean regulate the bulk of the carbon balance between the various components of the climate system at short (biological) times scales. Particularly, the seasonal variation in the net ecosystem exchange (NEE) of terrestrial biosphere explains the distinct seasonal cycle of the Northern Hemisphere (NH) atmospheric CO2
concentration. Terrestrial ecosystems are also responsible for a major part of the interannual variability in CO2 concentration (e.g., Bousquet et al., 2000; Buermann et al., 2007).
At long time scales (years-to-centuries), the biosphere has carried out an important ecological service in mitigating the anthropogenic alterations of the global carbon cycle. Between the preindustrial period and the present, terrestrial plants have taken up the equivalent of about 30% of the atmospheric carbon surplus resulting from fossil fuel emissions and land-use changes (Canadell et al., 2007; Denman et al., 2007). Changes in land cover have significantly contributed to the net anthropogenic carbon emissions and have therefore influenced the global climate trends. A review of the biogeochemical effects on climate of LULCC is presented in Section 1.4.2.
Vegetation is also fundamental in regulating the global water cycle. Total precipitation over lands (~105 km3 yr-1) is in its major part (~70%) sent back to the atmosphere throughout evaporation and plant transpiration (evapotranspiration). In turn, an important fraction of the atmospheric moisture that precipitates over lands comes from the evapotranspiration itself (water recycling). Therefore, although the primary source of water is the ocean, vegetation plays a fundamental role in increasing the water recycling strength over the continents and, then, on the availability of fresh water. Modeling experiments have shown that the total land evapotranspiration and precipitation are respectively reduced by 65% and 50% when a completely vegetated planet is converted to a desert one (Kleidon et al., 2000). Vegetated lands and their high evapotranspiration rates also modulate the surface climate, maintaining moderate temperatures and a heating contrast between the continents and the oceans (Shukla and Mintz, 1982). The global circulation is also in part regulated by vegetation, notably by tropical forest convection hot spot such as the Amazon.
1.1.2 Water and energy budget in vegetated surfaces
The hydrology of the soil-canopy system may be characterized by different water reservoirs and fluxes (Figure 1.1). Precipitation has a component that reaches the ground (directly or as stemflow) and another that is intercepted by the foliage. The latter represents a small reservoir of water that is rapidly evaporated (interception loss). The water reaching the ground by precipitation or by snow melt may in part infiltrate the soil, run off or evaporate. The soil represents a water pool from which the plants’ roots uptake moisture. How the available water by precipitation is distributed between these different compounds will depend on the amount of vegetation, and on the plant’s morphological (e.g., foliage density, root length, leaf water holding capacity) and physiological (stomatal conductance) properties.
Figure 1.1
Land surface hydrology as represented in land surface models. (Reprinted from Bonan, 2008a)
The surface energy balance varies widely following the geographical location, in part due to the atmospheric forcings (momentum, radiation and precipitation), but also according to the properties of the different land-cover and soil types. As commented above, the amount of vegetation, the plant type and canopy density will drive the hydrologic processes at the surface and the resulting flux of latent heat (evapotranspiration). Vegetation also determines the aerodynamic properties of the surface (surface roughness), regulating the ensemble of turbulent exchanges between the land and the atmosphere.
The surface energy balance is regulated by the surface radiation budget, which also depend on the type of land cover. For instance, the optical properties of the soil (soil color) and plants (e.g., leaf/stem albedo) will determine the amount of solar radiation sent back to the atmosphere. Dense forest has low albedos (~12%) compared to, e.g., dry barren soils (~30%). Under snow-covered conditions, the albedo difference between forest and barren or herbaceous lands is still larger because the trees’ canopy masks the very high albedo of the snow lying at the surface (Bonan, 2008b).
Looking at the ground-vegetation system as a whole, the surface energy balance may be described as follows:
where SD and LN are the solar radiation incoming the surface and the net (downward minus upward) longwave radiation, respectively. LE, H and G are respectively the latent, sensible and ground heat fluxes. The surface albedo (α) results from the combined soil and canopy reflectance. H and LE may, in this case, be represented in a simplified way with bulk relations of heat and moisture transfer between the surface (including vegetation) and a reference level in the atmosphere, formulation usually used to solve Equation (1.1) and the surface temperature in land surface models (described in the following section).
1.2 Modeling the land surface
Climate models have been systematically developed since the 1960s’ and have quickly become powerful tools for climate studies and weather forecasting. The early global climate models (GCMs) only simulated the atmospheric motions (Global Circulation Models) and used very simple parameterizations of the surface. Besides the systematic improvements of the dynamics and physics of the atmosphere, the development of GCMs has been characterized by a more complete representation of the complexity of the climate system, by adding different components of it. An early improvement was the more explicit description of the continents and its biogeography. The modern schemes that solve land surface processes, referred to as land surface models (LSMs), are usually distinct modules that can be used either coupled to a GCM or forced with prescribed near surface variables and atmospheric fluxes.
During the early stage of climate modeling, the water and energy exchanges between the continental surfaces and the atmosphere were represented by simple bucket/surface energy balance schemes (e.g., Manabe, 1969). In a limited set of equations and parameterizations, usually referred to as LSMs of first generation (Sellers et al, 1997), the soil water content is represented as a simple reservoir (i.e., a single soil layer) that fills up with precipitation and snow melt, and empties with evaporation and runoff (typically the surplus water when a prescribed reservoir level is reached). H and LE are calculated with their corresponding bulk transfer equations, which respectively depend on the temperature and water vapor pressure gradient between the surface and the first layer in the atmosphere. That is,
H = ρ cp (Ts – Ta)/rH (1.2)
LE = β ρ cp γ (e*(Ts) – ea)/rW (1.3)
constant, respectively. In this case, both resistances to transfer of heat (rH) and to water exchange (rW) correspond to the aerodynamic one. LE is also limited by the soil moisture availability (β), which depends linearly on the reservoir water level. In these models, different land-cover types may be taken in account through prescribed parameters for the water holding capacity, surface albedo and roughness. The scheme described in Manabe (1969) was the first and common reference for this kind of land surface parameterization.
A thorough evolution of LSMs included the multilayer representation of the soil processes (hydrology and heat conduction) and the explicit representation of the energy, water and momentum exchanges between the vegetation and the atmosphere. These second-generation LSMs simulate the water fluxes in a more realistic way than previous approaches, because the total land evaporation is partitioned between plant transpiration, interception loss and soil evaporation components (Figure 1.1). In these models, leaf transpiration is regulated by stomatal conductance, defined empirically as function of environmental factors (photosynthetic active radiation, air humidity and air CO2 concentration) and the properties of plants. rW in Equation
(1.3) integrates, in this case, more barriers in the soils and plants’ canopy to evaporation and transpiration (e.g., aerodynamic resistance, stomatal resistance or soil moisture deficit). The inclusion of two or more layers in the soil allows combining processes acting at different time scales. While the near surface layer accounts for fast variability (e.g., diurnal), the deeper soil layers relate with slower processes (e.g., seasonal cycle).
The processes described by the leaf biophysics are scaled up to the canopy level through the foliage density, which is usually characterized with the Leaf Area Index (LAI), the cumulated foliage area of the canopy projected in a unit of ground surface. The common way to derive the fluxes between the canopy and the atmosphere is the simple extension of the leaf processes. In this case, the canopy conductance is equal to the stomatal conductance pondered by LAI. This approach, usually known as ‘big leaf canopy’, contrasts with more complex representations in which the ground-canopy system is divided into multiple layers. The mean fluxes in a grid-cell depend then on its fractional vegetation cover and LAI, both quantities prescribed in second-generation models (usually based on satellite observations). Several LSMs also prescribe different vegetation classes within a cell. Such models used biomes classes or Plant Functional Types (PFTs) to describe the sub-grid land cover heterogeneity. The latter is a plant classification based on their functions, physical characteristics, life form, etc. Depending on the model, different processes −at least the water balance calculations− are independently computed over each PFT and then aggregated to the grid level following the relative grid fractions of each of them.
Based on the original work of Deardorff (1978), the Biosphere Atmosphere Transfer Scheme (Dickinson et al., 1986) and Simple Biosphere model (Sellers et al., 1986) are earlier LSMs of enhanced complexity, from which several other second-generation LSMs were developed.
During the last two decades, a number of LSMs have evolved and others have been developed in order to include the biochemical processes within the land surface in a comprehensive way along with its biophysical counterpart. These models are recognized as of third generation or ‘green’ LSMs because they explicitly simulate photosynthesis (usually based on Farquhar et al., 1980) and stomatal conductance (typically following the semi-empirical relation by Collatz et al., 1992), allowing representing key aspects of plants’ life such as the phenology. Given that these LSMs simulate the carbon exchange between plants, the soil and the atmosphere, a large field in vegetation-climate interactions studies was opened. For instance, these models allow estimating the change in the global carbon cycle due to anthropogenic forcings (emissions from fossil-fuel combustion and derived from land-use changes; e.g., Brovkin et al., 2004), or account in climate simulations for the plants’ physiological response to environmental changes (either in climate or CO2 concentration; e.g., Betts et al., 1997, 2007a;
Schimel et al., 2000).
In addition to the biogeochemistry, some modern LSMs also include natural disturbances (e.g., wildfires), land management or schemes of plant competition for light, water and nutrients, allowing simulating of the natural evolution of biogeography (e.g., Sitch et al., 2003; Cox et al., 2004). The latter are known as Dynamics Global Vegetation Models (DGVM).
ORCHIDEE (ORganizing Carbon and Hydrology in Dynamic EcosystEms; Krinner et al., 2005) is an example of state-of-the-art LSM, which is used in the IPSL global modeling framework (Marti et al., 2006). ORCHIDEE builds on the energy and hydrologic transfer model SECHIBA (Ducoudré et al., 1993) and on two other schemes that respectively simulate plant biogeochemistry (STOMATE) and vegetation dynamics (LPJ; Sitch et al., 2003). Hence, this model has a modular architecture that allows using it in a SECHIBA configuration alone, in a SECHIBA-STOMATE configuration or in a fully coupled configuration, in which ORCHIDEE works as a DGVM. When STOMATE is activated, the carbon cycle is integrated to the biophysical component in a coherent manner; the model simulates photosynthesis, stomatal conductance and autotrophic respiration following Ball et al. (1987), Farquhar et al. (1980), Collatz et al. (1992) and Ruimy (1996). STOMATE also accounts for carbon allocation into the different vegetation pools (and into the litter and soil ones in regard with leaf senescence and tree mortality), plant phenology, litter decomposition and the soil carbon dynamics. The global
biogeography and the sub-grid land-cover distribution are characterized through thirteen PFTs living within a grid-cell: two pairs (C3 and C4) of grasses and crops, six tree classes, and a bare soil class.
An in depth review of LSMs is described in Sellers et al. (1997), Pitman (2003) and Bonan (2008a).
1.3 Historical land-use induced land-cover change
The rapid human expansion during the Holocene has been characterized by the transition from hunter-gathering to sedentary cultures that developed agriculture, food storage and livestock techniques. The early phase of this societal transition, the so-called Neolithic revolution, and the associated first signals of systematic land-use did not happen until the last climate shift at the end of the Pleistocene. This occurred in the Near Easter Fertile Crescent (region surrounding the Syrian desert from Egypt to Iran) and in Guinea somewhat before ten thousand years ago (Diamond, 1999). During the next 5000 years, food production has spread eastward and westward across Eurasia. Land-use practices have also emerged (independently) in other parts of the globe such as in east China (~9500 yr BP) and Mesoamerica (~5500 yr BP).
Forest clearing was already a common land-use practice during the earlier agricultural societies (Williams, 2000). From the deep past to the preindustrial period (18th century),
land-use has been raising more or less monotonically following human population (that reached ~1 billion in 1800). Land conversion during this period was accompanied by moderate cropland expansion (~+2.6 million km2) and deforestation (~-2 million km2), particularly affecting Europe, India, and southeastern Asia (Pongratz et al., 2008; Figure 1.2). The industrial revolution has introduced novel techniques for agriculture, notably boosted by the use of fossil fuels and fertilizers (Nitrogen). Along with human population, the expansion of the agriculture accelerated dramatically in the last 300 years (Ramankutty and Foley, 1999; Klein Goldewick 2001). Croplands increased strongly in North America, west Eurasia, India and China during the 18th and 19th centuries. Land-cover changes have then stabilized during the 20th century in some regions such as in Europe, and accelerated in tropical regions and in South America.
Nowadays more than half of the global habitable lands (excluding Greenland and Antarctica) are occupied by croplands, rangelands and other human settlements (Ellis and Ramankutty, 2008). Forests, particularly the tropical ones, will likely be under strong pressure during the next decades due to the population demand for food and energy (e.g., biofuel industry).
Figure 1.2
Global historical cropland (left) and pasture (right) area. Units are percent of grid cell. Values smaller than 1% are colored white. Note the logarithmic scale. (Reprinted from Pongratz et al., 2008)
1.4 LULCC-induced changes in climate
Land-use and land-cover changes affect climate by means of different mechanisms. These are conveniently divided into those that perturb the biogeochemical cycle (biogeochemical impacts) and those that affect the climate through changes in physical properties of the surface (biogeophysical impacts). Both cases are reviewed next.
1.4.1.1. Radiative effects
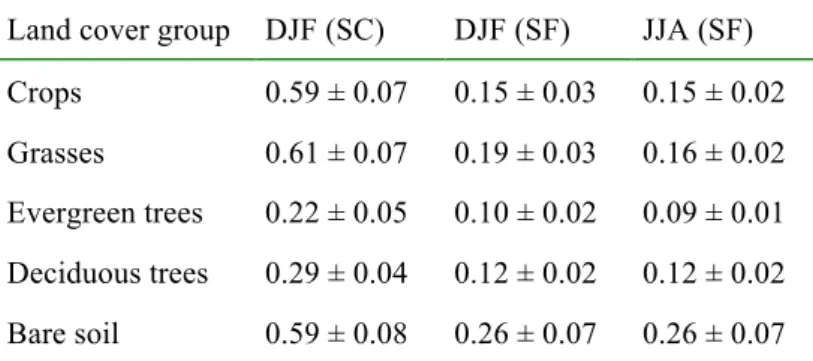
As mentioned in Section 1.1.2, the surface radiation budget over lands varies widely from region to region, in part because of the different radiative properties of the various land-cover types. Forest canopy is generally more opaque to sunlight than herbaceous vegetation and bare soil. This difference is much larger if snow is present because forest masks the snow-covered surfaces lying under its tall canopy, maintaining a relatively low albedo. Current estimates based on satellite observations report snow-free albedo values of around 0.12 and 0.17 for forests and grasslands, respectively (e.g., Gao et al., 2002; Myhre et al., 2005). Under snowy conditions, the albedo of the same two vegetation classes increases to near 0.26 and 0.57, respectively (Jin et al., 2002). That is, the albedo difference between forest and grassland is ~0.05 in absence of snow, and reaches ~0.30 under snow.
The climate is very sensitive to surface albedo changes. Without considering any feedback within the climate system and using an incoming solar radiation at the surface of 200 W m-2 (~ global average), an increase in surface albedo of 0.01 will reduce the energy absorbed at the surface by 2 W m-2. This is quite a significant difference and of the same order than the radiative forcing exerted at the top of the troposphere by the change in atmospheric greenhouse gases concentration since the preindustrial period (Forster et al., 2007). Manifestly, the potential global impact of LULCC-induced surface albedo changes is quite weaker because land conversion is constrained to a minor fraction of earth surface. On the contrary, the radiative effects of LULCC could be very important at the continental scale, considering notably that a local albedo change due to e.g. deforestation is often larger than 0.01.
Since the late 1990s, several studies using global climate simulation have investigated the biogeophysical impacts of the past large-scale LULCC. Most of them have shown a predominantly cooling effect driven by strong albedo increases in NH temperate regions (Hansen et al., 1998; Brovkin et al., 1999, 2004, 2006; Betts, 2001; Gowindassamy et al., 2001; Matthews et al., 2003, 2004; Feddema et al., 2005a; Betts et al., 2007b). Hansen et al. (1998) show a clear cooling in the NH as response to LULCC between the preindustrial period and present-day (Figure 1.3b). This cooling is in clear relation with higher surface albedo and decreases in net radiation over the regions of intense deforestation, in eastern North America, in mid-western Eurasia and in southeastern Asia (Figure 1.3a). Given the major role of albedo, some of the mentioned references and others studies have quantified the effects of the past LULCC in terms of radiative forcing (RF). The use of this metric has further allowed direct comparisons with other natural and human-induced climate forcings, despite it does not account for non-radiative effects of LULCC (Davin et al., 2007). The global mean RF induced by
surface albedo changes since the pre-agricultural period have a typical value of –0.2 W m-2 but
vary widely within different estimates, ranging from –0.66 to +0.02 W m-2 (see Forster et al.,
2007, and references therein). This uncertainty has been in part attributed to different crop albedo values prescribed in LSMs (Matthews et al, 2003; Myhre and Myhre, 2003). Other studies show little global impacts and regionally warming responses to LULCC (e.g., Pitman and Zhao, 2000; Findell et al., 2007).
Idealized modeling experiments have been very helpful to evaluate the potential impact of LULCC in regions other than the NH temperate and boreal ones. A number of studies have carried out simulations encompassing large-scale reforestation or deforestation (e.g., Clausen et al., 2001; Gibbard et al., 2005; Bala et al., 2007). Most of them, in accordance with the simulated climate responses to the historical LULCC, show that forest tends to warm the surface at high latitudes because of its comparatively low albedo, particularly during the winter and spring, when the snow-masking effect is maximized. During the warm season at mid/high latitudes or through the year at lower latitudes, the effects of deforestation and land-use in general are more intricate because of the major role of turbulent energy fluxes.
Figure 1.3
Climate forcing and simulated surface air temperature response for land-use change between the pre-industrial era and the present. (Reprinted from Hansen et al. 1998)
1.4.1.2. Non-radiative effects
In addition to the radiative impacts, LULCC affects the surface climate by altering the hydrology and the aerodynamic drag of the surface on the atmosphere and, therefore, the turbulent exchanges within the boundary layer. We can recognize three mechanisms in which the turbulent heat fluxes could respond to LULCC. Two of them will occur through direct modification of the surface resistances to water and heat exchanges (see Equations 1.2 and 1.3).
On one hand, a change in surface roughness and thereby in the aerodynamic resistance, will affect both H and LE in the same direction. On the other hand, the relative strength of one flux with respect to the other (i.e., a change in the Bowen ratio) will be affected by changes in the evaporative efficiency. The latter is notably controlled by the plants’ morphology (e.g., the root depth), physiology (stomatal conductance) and the foliage density, affecting the evapotranspiration (ET) partitioning (transpiration vs. interception loss vs. soil evaporation; Figure 1.1). A third way in which H and LE will be modified is throughout changes in available energy by radiation. Radiation will directly affect plant transpiration through changes in the photosynthetic active radiation (PAR). Turbulent fluxes will also respond to changes in the surface radiation following (and modifying) the surface and air temperature in a way that the surface energy balance must be maintained.
Several modeling studies have shown decreases in ET as responses to large-scale deforestation in the tropics, overwhelming the albedo-induced cooling and producing a net warming (e.g., Claussen 2001, Gibbard et al., 2005), although the opposite effect has also been reported (Snyder et al., 2004). The particular question of the climate response to a hypothetical Amazon deforestation has been addressed in a number of modeling studies since the 1980’s (see D’Almeida et al., 2007; Sampaio et al., 2007; Bonan, 2008a; and references therein). Most of these studies, as well as other simulations prescribing historical LULCC (e.g., Bounoua et al., 2002), agree that Amazonian clearing leads to a warmer and dryer regional climate. Some observations-based studies have shown consistent differences between the hydrologic properties of rainforest and deforested areas in the Amazon (Gash and Nobre, 1997; von Randow et al., 2004). Others studies based on observations or mesoscale simulations have shown an opposite pattern, with enhanced convection and water recycling over local forest clearing (e.g., Baidya Roy and Avissar, 2002; Negri et al., 2004), highlighting that the question of how deforestation affects the water cycle in tropical areas is highly dependent on the scale of the perturbation (D’Almeida et al., 2007).
Changes in ET due to land conversions are even more uncertain in temperate latitudes. Crops have associated higher canopy conductance than natural vegetation (Baldocci et al., 1997) and, under well-watered conditions, could evaporate more than forest. Cropland expansion at expense of grassland or forest could then cool the surface in summer due to increases in both ET and surface albedo. Such LULCC signals have been simulated in North America (Bonan, 1999; Bounoua et al., 2002; Oleson et al., 2004) and are consistent with observations (Bonan, 2001). Other modeling studies have shown the opposite effect due to the past deforestation in North America (Baidya Roy et al., 2003) and in other regions (Betts, 2001; Findell et al., 2007).
In addition to changes in land cover, land use also affects the climate through irrigation. During the 20th century, this technique has been used to develop agriculture in arid and
semi-arid regions, notably in northern India, in eastern China and in the great plains of North America. Most studies have shown that irrigation has significantly increased ET and cooled the surface in those and other regions (e.g., Douglas et al., 2006; Mahmood et al, 2006, Adegoke et al., 2007; Lobell and Bonfils, 2008). Global-scale studies have also shown increasing ET and cooling due to irrigation (Boucher et al., 2004; Gordon et al., 2005; Haddeland et al., 2007).
1.4.1.2. Indirect impacts and feedbacks
Direct modifications of the surface properties affect energy, momentum and water exchanges within the boundary layer, inducing changes in the upper air temperature, moisture, convection and cloud cover. The surface climate is therefore indirectly affected by LULCC through changes in precipitation, in the wind stress or in the incoming (downward) radiation.
There are many mechanisms by which the atmosphere can feedback the surface perturbations, as described in Pitman (2003). How the surface affects the boundary layer processes will also depend on the surface-atmosphere coupling strength (Koster et al., 2006). For instance, increases in precipitation will likely enhance soil moisture and ET, notably in arid or semi-arid regions. In turn, the way in which ET affects precipitation is complex and not necessarily one-sided. Increasing ET could enhance convection and supply moisture to the atmosphere inducing more precipitation. This mechanism results in a positive feedback between ET and precipitation (e.g., Koster et al., 2006). On the contrary, the surface cooling due to increasing ET may make the boundary layer more stable. In this case more ET inhibits convection and precipitation, producing a negative feedback (e.g., Cook et al., 2006). The atmosphere could also produce a negative feedback to changes in ET through changes in air water vapour. An increase in the latter due to increases in ET will reduce the evaporative demand and, then, inhibit ET.
As commented before, a large number of studies using GCMs show large decreases in precipitation and ET due to tropical deforestation, notably for the Amazon case. It is noteworthy that most of these studies show larger decreases in precipitation than evaporation in term of water flux (see D’Almeida et al., 2007, and references therein). This footprint highlights that, more than a pure water vapor recycling effect, changes in turbulence and convection play a leading role in explaining the precipitation responses to LULCC in the tropic.
due to a positive feedback along with the surface temperature and the snow cover (in the same way than the ice-albedo feedback). In turn, the albedo-induced decrease in net shortwave radiation may be dampened from decreases in the incoming solar radiation. This may occur if the less energy absorbed at the surface inhibits convection and, therefore, reduces cloud cover (Pitman, 2003). Such impacts of LULCC, although observed in numerical experiments (e.g., Bala et al., 2007; Findell et al., 2007), have not been particularly addressed and remain quite uncertain. Result from, e.g., Oleson et al. (2004) show different directions in the changes of incoming shortwave radiation when simulated with different LSMs.
In addition to the local impacts, land-cover changes may also affect the climate of remote areas through changes in the atmospheric circulation. Some studies have shown that historical LULCC could affect the climate in regions far away (Chase et al., 2000; Zhao et al., 2001). These studies and others that have prescribed intense deforestation scenarios have shown that changes in global circulation and teleconnections are particularly sensible to tropical disturbances (e.g, Gedney and Valdes, 2000; Werth and Avissar, 2005).
1.4.2 Biogeochemical impacts
The leading role of terrestrial ecosystems in the global biogeochemical cycle makes them particularly vulnerable to changes in biogeography. Historical deforestation has released about 150 GtC of CO2 since the preindustrial times, which has contributed to an increase of ~20 ppm
in atmospheric CO2 concentration (Houghton, 2003; Brovkin et al., 2004).
In contrast to the biogeophysical effects, changes in the carbon cycle affect climate at the global scale by modifying the radiative properties of the atmosphere. Claussen et al. (2001) performed ad-hoc simulations to investigate both the biophysical and the biogeochemical impact of large-scale deforestation scenarios using a climate model of intermediate complexity. They show that the albedo-induced cooling due to deforestation at high latitudes overwhelms the corresponding biogeochemical-induced warming. In contrast, in a tropical forest clearing scenario, the biogeochemical effect dominates leading to a net warming. Bala et al. (2007) show similar results based on a GCM. Most studies addressing the impact of land-use in a historical perspective show counteracting climatic responses due to biogeophysical (cooling) and biogeochemical (warming) effects. The latter dominates since 1850 in the modeling experiences of Mathews et al. (2004), resulting in a net global warming of ~0.15 C. Brovkin et al. (2004) show the opposite pattern in a similar experience, where the biophysical effect dominates and leads to weak cooling.
1.5 Thesis outlook: motivation, objectives and structure
Almost all the studies mentioned in the precedent sections and others omitted agree in that LULCC affects significantly the climate, at least at the regional scale. However, there are large uncertainties regarding the amplitude and, in some cases, the direction of these impacts. The biogeophysical effects of land-cover change have actually been assessed in a very shallow manner in the last report of the Intergovernmental Panel of Climate Change (IPCC; Forster et al., 2007). The impacts of LULCC have been evaluated mainly in terms of the albedo-related radiative forcing and, pertinently, have been qualified with a low-to-medium level of scientific understanding.
Given the direct impact in the global carbon cycle of reforestation and afforestation, such strategies have been proposed to mitigate the GHG-induced global warming. In spite of the clear ecological services of forest (e.g., carbon sequestration or biodiversity preservation), the net effect of reforestation in climate is likely to be misleading if the biogeophysical effects are not accounted for.
Land-use is nowadays rapidly evolving and will play a major role in the near future following the mentioned ecological demand as well as the energy and food necessities of a sharply increasing global population.
It is clear that the ensemble of modeling and other studies does not bring a regionally and seasonally consistent climate signal of land-use changes. There are many reasons that could explain the differences in the simulated effect of LULCC. For instance, many LSMs used in climate models are very novel, and vary among them in their complexities (processes involved) and the philosophies adopted to represent the land surface. The simulation strategies as well as the land-surface forcing dataset are also very different.
The main goal of this thesis is to identify the robust biogeophysical impacts of LULCC. The following questions are particularly suggested:
• How strong are these impacts at both the global and regional scale?
• Have been the local impacts of past LULCC in, e.g., surface temperature comparable to those induced by the increasing atmospheric GHGs?
• Which are the relative impacts of radiative and non-radiative effects?
reasons explaining these uncertainties?
A straightforward strategy to address these points is the model intercomparison analysis of simulations carried out with a coherent protocol to assess the impacts of LULCC. The Land-Use and Climate: IDentifications of robust impacts (LUCID) project was conceived with this motivation (de Noblet-Ducoudré and Pitman, 2007). This thesis is done within the framework of LUCID. The first set of simulations of this project was carried out by seven GCMs in order to assess the impact of LULCC between the preindustrial period and present-day. To constrain the uncertainties between model results, the protocol includes a common agricultural dataset and all GCMs were run forced at the ocean with a unique sea surface temperature data. The ensemble of analyses associated to this modeling initiative is described in Chapter 2.
This thesis also explores the impacts of past LULCC based on present-day observations-based datasets. This study was done for two key variables of the surface climate: the surface albedo and the evapotranspiration. The two approaches developed here, besides bringing novel estimations in the changes of these variables, were used to evaluate the model outputs from LUCID. These results are described in Chapter 3.
Chapter 4 describes the results from a set of simulations carried out with the IPSL Earth System Model in the context of LUCID and the Coupled Model Intercomparison Project Phase 5 (CMIP5) to evaluate both the historical and future impacts on climate due to LULCC. Simulations of the 21st century, including land-cover change scenarios from corresponding RCPs (Representative Concentration Pathways), were compared to simulations with fixed land cover.
Chapter 2
Impacts of LULCC on climate between the preindustrial
period and present-day: Results from the LUCID
intercomparison project
This chapter presents a model intercomparison analysis of the biogeophysical effects of LULCC from a set of global simulations carried out within the first phase of the LUCID project. The objective of LUCID is to identify those impacts on climate of LULCC that are coherently simulated by the various models assessed and, then, appear as robust signals. This is tried to be addressed here, as well as to understand and identify the sources of model divergences.
This chapter is organized as follows: an overview of LUCID, the set of simulations assessed and the global climate models (GCMs) involved are presented in Section 2.1. Section 2.2 presents the general methodology and flux conventions. Results are then presented in two parts. An overview of the simulated LULCC-induced changes in the surface climate is first shown at global scale in Section 2.3. Results described in Section 2.4 focus on the temperate regions of the Northern Hemisphere, particularly on two regions where large land-cover conversions occurred between the ends of the 19th and 20th centuries, defined respectively in North America and Eurasia. Part of these results, which a particular focus on the model differences and the causes behind the simulated responses LULCC, are described in two published papers by de Noblet-Ducoudré et al. (2012) and Boisier et al. (2012), included in sections 2.4.4 and 2.4.5. Although some results presented in these two papers repeat those described in the precedent sections, they show in most cases independent analyses. A chapter summary and conclusions are provided in Section 2.5.
2.1 LUCID project
Land-Use and Climate, IDentification of robust impacts (LUCID) is an international
initiative conceived under the auspices of IGBP-iLEAPS and GEWEX-GLASS bearing as main objectives the identification and quantification of the robust impacts of human-induced land-cover changes (see de Noblet-Ducoudré and Pitman, 2007). To address this, the strategy of
LUCID includes the analysis of a large ensemble of climate simulations, including multiple models.
Seven climate modeling groups participated in the first phase of LUCID, which performed a set of simulations designed to assess the biogeophysical impacts on climate induced by LULCC between the preindustrial epoch and present-day. A number of studies have been carried out using this set of simulations. Pitman et al. (2009) described the very first results of the project, focusing on the northern summer (JJA) climate responses to LULCC at the global-scale. This study shows that models simulate significant changes in near surface temperatures and in latent heat flux (LE), but constrained to those regions with significant changes in land cover. While most models simulate cooling, the changes in LE are quite uneven within them. Van der Molen et al. (2011) detect, for one GCM participating in LUCID (EC-Earth), a negative feedback on the impact of LULCC in the tropics. Increases in the incoming solar radiation oppose the direct radiative effect (decrease in net shortwave radiation) resulting from increases in surface albedo. De Noblet-Ducoudré et al. (2012) and Boisier et al. (2012), studies describing the major results of this chapter, explore the mechanisms behind the climate responses to LULCC in the Northern Hemisphere temperate regions.
2.1.1 Experimental setup and models
Seven GCMs participated in the first LUCID experiment (see below), all of them conducting four types of simulations. These consisted of ensembles of five realizations of 30-year simulations at equilibrium, constrained by the choice of the imposed vegetation and large-scale climate forcings. The latter were determined by both the boundary conditions at the ocean −all the models were forced with the monthly varying sea surface temperature (SST) and sea-ice concentration (SIC) dataset of Rayner et al. (2003)− and the prescribed atmospheric carbon dioxide concentrations ([CO2]). The various land surface models (LSMs) embedded in each
GCMs also incorporated a common global agricultural dataset in their native land-cover maps. The SAGE (Ramankutty et al., 1999) and HYDE (Klein Goldewith, 2001) datasets were respectively used for cropland and pastureland areal fractions.
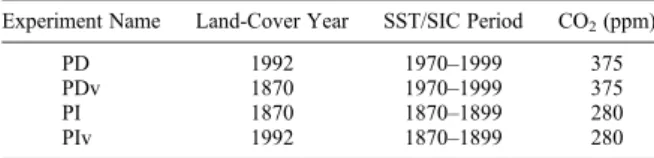
The combination of the forcing dataset defined the four modeling experiences carried out (Table 2.1). Then, the ‘Present-Day’ simulations (PD) used the SST/SIC data from 1970 to 1999, [CO2] set to 375 ppm, and the vegetation distribution of 1992. Another set of present-day
simulations were forced with the same SST/SIC and [CO2] than that of PD runs, but with the
2.1) prescribed preindustrial values of SST/SIC (the 1870-1999 period was used in this case) and [CO2] (set to 280 ppm), and the land-cover distribution of 1870 in one case (PI), and that of
1992 in the other (PIv).
Therefore, the experimental design allows assessing the effects of large-scale changes in climate and in land-use. The biogeophysical effects of LULCC between 1870 and 1992 may be explored trough the difference resulting from the experiments PD and PDv, or/and between PIv and PI. These two different responses to LULCC could also be compared to studying synergisms between LULCC and climate, aspect not explored here, as we found in preliminary analyses that both diagnostics show quite similar results for most variables.
Table 2.1. LUCID set of simulations summary.
Experiment PD PDv PI PIv
SST/SIC period 1970–1999 1970–1999 1870–1899* 1870–1899*
[CO2] (ppm) 375 375 280 280
Land-cover year 1992 1870 1870 1992
* Model SPEEDY/LPJmL prescribes present-day SST/SIC in their PI and PIv simulations.
The seven GCMs participating in LUCID are listed in Table 2.2. The land-surface component of these GCMs are all LSMs that, following Pitman et al. (2003), may be categorized as second generation in the case of ISBA (ARPEGE) and TESSEL (ECEARTH), since they do not integrate canopy transpiration and photosynthesis in a common framework, and as third generation for the other cases. The GCM/LSMs references along with a number of key land-surface features concerning this study are included in Table 2.2.
The various LSMs used different strategies to characterize the subgrid land-cover heterogeneity. Most of them define plant functional types (PFTs) to parameterize specific vegetation types, but share different number of them within the grid-cell. This feature will affect the way in which the areal fraction of crops or pasture is set within a cell and, then, the final character of the imposed land-cover conversion. One extreme case occurs with CABLE, which uses a unique PFT per cell and, subsequently, must adopt a rule that should prescribe either 0 or 100% of an agricultural unit within the concerned pixel.
Table 2.2. GCM/LSMs used to perform the LUCID simulations. A list of features relevant to this study is indicated. G C M ! A R P E G E S a la s e t a l. ( 2 0 0 5 ) C C A M M c G re g o r a n d D ix (2 0 0 8 ) C C S M C o ll in s e t a l. ( 2 0 0 6 ) E C -E a rt h w w w .e c m w f. in t/ re s e a rc h /i fs d o c s /C Y 3 1 r1 / E C H A M 5 R o e c k n e r e t a l. ( 2 0 0 3 ) IP S L M a rt i e t a l. ( 2 0 0 5 ) S P E E D Y S tr e n g e rs e t a l. (s u b m it te d ) L S M IS B A V o ld o ir e ( 2 0 0 6 ) C A B L E W a n g e t a l. ( 2 0 0 7 ); A -b ra m o w it z e t a l. ( 2 0 0 8 ) C L M O le s o n e t a l. ( 2 0 0 8 ) T E S S E L V a n d e n H u rk e t a l. (2 0 0 0 ) J S B A C H R a d d a tz e t a l. ( 2 0 0 7 ) O R C H ID E E K ri n n e r e t a l. ( 2 0 0 5 ) L P J m L B o n d e a u e t a l. ( 2 0 0 7 ) R e s o lu ti o n 2 .8 x 2 .8 2 .5 x 2 .5 1 .8 7 5 x 2 .5 1 .8 x 1 .8 3 .7 5 x 3 .7 5 2 .5 x 3 .7 5 3 .7 5 x 3 .7 5 B a c k g ro u n d la n d -c o v e r E C O C L IM A P ( M a ss o n e t a l., 2 0 0 3 ) P o te n tia l ( L a w re n ce a n d C h a se , 2 0 1 0 ) A V H R R ( L o ve la n d e t a l., 2 0 0 0 ) P o te n tia l ( P o n g ra tz e t a l., 2 0 0 8 ) A V H R R ( L o ve la n d e t a l., 2 0 0 0 ) P o te n tia l ( co m p u te d ) T o ta l P F T n u m b e r 1 2 1 2 1 5 1 6 1 2 1 2 1 1 P F T s p e r g ri d c e ll N o t ile s. A g g re g a te d p a ra m e te rs f ro m P F T s 1 4 2 6 1 2 6 C ro p s re p re s e n ta ti o n 3 s p e ci fic s P F T s (C 3 , C 4 a n d ir ri g a te d ) 1 P F T ( C 3 ) 1 P F T ( C 3 ) 1 P F T 1 P F T 2 P F T s (C 3 a n d C 4 ) 2 P F T s (C 3 a n d C 4 ) P a s tu re s re p re s e n ta ti o n A s n a tu ra l g ra ss A s cr o p A s C 3 /C 4 n a tu ra l g ra ss A s cr o p A s C 3 /C 4 n a tu ra l g ra ss A s C 3 /C 4 n a tu ra l g ra ss M a n a g e d C 3 /C 4 g ra ss la n d w ith in te n si ve cu tt in g c yc le s C ro p s in te g ra ti o n s tr a te g y P ro p o rt io n a l r e d u ct io n o f n a tu ra l v e g e ta tio n G ri d -c e ll fil le d u p w ith cr o p if t h e c o m b in e d cr o p a n d p a st u re f ra ct io n > 5 0 % P ro p o rt io n a l r e d u ct io n o f n a tu ra l v e g e ta tio n R e d u ct io n o f lo w ve g e ta tio n f ir st a n d o f fo re st s e co n d a ri ly R e d u ct io n o f lo w ve g e ta tio n f ir st a n d o f fo re st s e co n d a ri ly P ro p o rt io n a l r e d u ct io n o f n a tu ra l v e g e ta tio n P ro p o rt io n a l r e d u ct io n o f n a tu ra l v e g e ta tio n L e a f/ s te a m a lb e d o S o il c o lo r F ro m E C O C L IM A P (s a te lli te ) F ro m I S L S C P 2 ( S e lle rs e t a l., 1 9 9 6 a , 1 9 9 6 b ) M O D IS -d e ri ve d 2 0 s o il co lo r cl a ss e s (L a w re n ce a n d C h a se , T .N . 2 0 0 7 ) V e g e ta tio n -s p e ci fic va lu e s d e ri ve d f ro m A V H R R D e ri ve d f ro m M O D IS (R e ch id , R a d d a tz , Ja co b 2 0 0 9 ) F ro m W ils o n a n d H e n d e rs o n -S e lle rs (1 9 8 5 ) 0 n e g e n e ra l v a lu e ( 0 .3 ), b a se d o n G a lli m o re e t a l. (2 0 0 5 ) T e m p e ra tu re L a y e rs 2 6 ( so il) ; 3 ( sn o w p a ck ) 1 0 ( so il) ; 5 ( sn o w p a ck ) 4 5 7 5 W a te r re s e rv o ir s so il re se rv o ir , su rf a ce a n d s n o w p a ck 6 s o il la ye rs 1 0 s o il la ye rs 4 s o il la ye rs , su rf a ce a n d sn o w p a ck so il re se rv o ir , su rf a ce , sn o w p a ck o n s o il a n d ca n o p y so il re se rv o ir , su rf a ce a n d s n o w p a ck so il re se rv o ir , su rf a ce a n d s n o w p a ck S o il s c h e m e ty p e F o rc e -R e st o re D iff u si o n D iff u si o n S in g le b u ck e t S in g le b u ck e t S in g le b u ck e t C a n o p y re s is ta n c e Ja rv is B a ll e t a l. (1 9 8 7 ), L e u n in g ( 1 9 9 5 ), W a n g a n d L e u n in g ( 1 9 9 8 ), W a n g ( 2 0 0 0 ) T w o -l e a f (s u n lit a n d sh a d e d ) p h o to sy n th e si s-co n d u ct a n ce m o d e l ( B a ll e t a l., 1 9 8 7 ) Ja rv is K n o rr & H e im a n n ( 2 0 0 1 ) B a ll e t a l. (1 9 8 7 ) G e rt e n e t a l. (2 0 0 4 ) m o d ifi e d a s d e sc ri b e d b y S tr e n g e rs e t a l. (i n re vi si o n ) P h o to s y n th e s is N o n e F a rq u h a r e t a l. (1 9 8 0 ), vo n C a e m m e re r a n d F a rq u h a r (1 9 8 1 ), L e u n in g ( 1 9 9 5 ), W a n g a n d L e u n in g ( 1 9 9 8 ), W a n g ( 2 0 0 0 ) C o lla tz e t a l. (1 9 9 1 , 1 9 9 2 ) N o n e F a rq u h a r e t a l. (1 9 8 0 ), C o lla tz e t a l. (1 9 9 2 ) F a rq h a r e t a l. (1 9 8 0 ), C o lla tz e t a l. (1 9 9 2 ) F a rq h a r e t a l. (1 9 8 0 ), C o lla tz e t a l. (1 9 9 2 ) P h e n o lo g y tr a it e m e n t P re sc ri b e d L A I se a so n a l cy cl e P re sc ri b e d L A I se a so n a l cy cl e P re sc ri b e d L A I se a so n a l cy cl e F ix e d L A I (n o s e a so n a l cy cl e ) C o m p u te d L A I C o m p u te d L A I C o m p u te d L A I H a rv e s ti n g Im p lic it (f ro m o b se rv e d L A I im p o se d ) Im p lic it (f ro m o b se rv e d L A I im p o se d ) Im p lic it (f ro m o b se rv e d L A I im p o se d ) N o n e Im p lic it in c ro p p h e n o lo g y sc h e m e Im p lic it (f ro m d u ra tio n o f le a f cy cl e t h a t is s h o rt e r th a n w ith n a tu ra l ve g e ta tio n ) C o m p u te d h a rv e st @ m a tu ri ty , b a se d o n te m p e ra tu re s u m co n ce p t !
Another aspect that will affect the climate responses to LULCC is how LSMs parameterize the various land-cover types, particularly in the case of crops and pastures. Depending on the LSM, one to three specifics crop PFTs are defined, while pastures may be represented as crops (CABLE and TESSEL) or natural grass (all the others). The phenological cycle is also described in different ways within the various LSMs. JSBACH, LPJmL and ORCHIDEE, simulated LAI cycle based on the seasonal carbon allocation and the local climate. The other LSMs prescribe a LAI cycle based on satellite observations (ISBA, CABLE, CLM), or use a fixed value year-round (TESSEL).
Given that the processes behind the effets of LULCC are primarily dependent on the land-surface parameterizations and since this study focuses on the surface climate, the models will usually be referred with both the names of the GCM and/or the LSM in which it is embedded.
The global crop and pasture distribution from respectively SAGE and HYDE datasets are illustrated in Figure 2.1. Croplands are nowadays (1992) particularly extensive in the Northern Hemisphere, notably in North America, Eurasia, India and southeast China. Pasturelands are more localized and dense in some regions as the Middle East. From this dataset, crops or pastures covered together more than 20% of the global ice-free land surface in 1992, half of which has been added since 1870. The expansion of cropland from 1870 to 1992 is particularly large in the North American continent, and moderate in other regions that were already highly perturbed in 1870 (e.g., Eurasia, India and China; Figure 2.1c).
Figure 2.1
Areal fraction of cropland (a) and pastureland (b) in 1992 and the corresponding differences between 1992 and 1870 (c, d).


![[PDF] Débuter la programmation avec le langage Python | Cours informatique](data:image/gif;base64,R0lGODlhAQABAIAAAP///wAAACH5BAEAAAAALAAAAAABAAEAAAICRAEAOw==)