HAL Id: insu-01669346
https://hal-insu.archives-ouvertes.fr/insu-01669346
Submitted on 20 Dec 2017
HAL is a multi-disciplinary open access
archive for the deposit and dissemination of
sci-entific research documents, whether they are
pub-lished or not. The documents may come from
teaching and research institutions in France or
abroad, or from public or private research centers.
L’archive ouverte pluridisciplinaire HAL, est
destinée au dépôt et à la diffusion de documents
scientifiques de niveau recherche, publiés ou non,
émanant des établissements d’enseignement et de
recherche français ou étrangers, des laboratoires
publics ou privés.
Seasonal and interannual variations of H2O2 on Mars
Thérèse Encrenaz, Thomas K. Greathouse, Franck Lefèvre, Franck
Montmessin, Thierry Fouchet, Bruno Bézard, Sushil K. Atreya, Brigitte
Gondet, Anna Fedorova, Paul Hartogh
To cite this version:
Thérèse Encrenaz, Thomas K. Greathouse, Franck Lefèvre, Franck Montmessin, Thierry Fouchet, et
al.. Seasonal and interannual variations of H2O2 on Mars. European Planetary Science Congress
2017, Sep 2017, Riga, Latvia. pp.EPSC2017-175. �insu-01669346�
Seasonal and interannual variations of H
2
O
2
on Mars
T. Encrenaz (1), T. K. Greathouse (2), F. Lefèvre (3), F. Montmessin (3), T. Fouchet (1), B. Bézard (1), S. K. Atreya (4), B.
Gondet (5), A. Fedorova (6), P. Hartogh (7)
(1) LESIA Paris Observatory, France, (2) SwRI, San Antonio, TX, USA, (3) LATMOS, IPSL, Paris, France, (4) University of Michigan, Ann Arbor, MI, USA, (5), IAS, University Paris-Sud, Orsay, France, (6) IKI Space Science Institute, Moscow, Russia, (7) Max-Planck Institute for Solar System Research, Göttingen, Germany ([email protected])
Abstract
Following a long-term monitoring campaign on the abundance and distribution of hydrogen peroxide on Mars, we present a new observation near summer solstice which corresponds to a maximum of the seasonal abundance of H2O2. Our result is in full agreement with GCM predictions (Lefèvre et al. 2008; [1]). We also analyse previous measurements of H2O2 in the vicinity of aphelion which seem to indicate the existence of interannual variations, and we discuss their possible origin.
Introduction
Hydrogen peroxide is an important tracer of Martian photochemistry, possibly responsible for the absence of organics at the surface of Mars [1, 2]. For over ten years, we have been monitoring its abundance and distribution over the disk of the planet along the seasonal cycle using ground-based high-resolution imaging spectroscopy. Comparison with global climate models has favoured the GCM model of the Laboratoire de Météorologie Dynamique based on heterogeneous chemistry [3, 4, 5].
In this abstract, we present a new observation of Mars obtained on May 7, 2016, near opposition, under an especially favourable geometry. The disk diameter was 17² and the solar longitude was 148.5°.
1. Observations
Our observation was performed using the TEXES instrument (Texas Echelon Cross Echelle Spectrograph; [6]) at the IRTF (InfraRed Telescope Facility), at Maunakea Observatory. As for our previous observations, we aligned the slit of the spectrograph along the North-South celestial axis and we moved the slit in the East-West direction from one limb to the other. As the slit length is about 10², the
northern and southern hemispheres of Mars were recorded sequentially. The observations took place on May 07, 2016, starting from 08:31:25 UT and lasting for 30 minutes. We used the 1230-1238 cm-1 spectral interval (previously observed in 2003) that contains an H2O2 doublet (at 1234.00 and 1234.05 cm-1) with nearby weak CO2 transitions. As in our previous analyses, our H2O2 map was obtained by dividing the line depth of the H2O2 doublet by the line depth of a nearby weak CO2 line.
2. The H
2O
2map for Ls = 148°
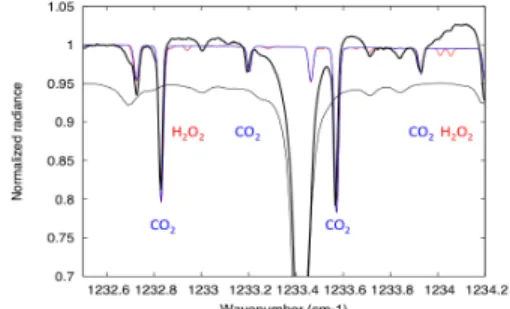
Figure 1 shows the TEXES disk-integrated spectrum between 1232.5 and 1234.2 cm-1, with a nominal synthetic model including CO2 and H2O2. It can be seen that the H2O2 doublet at 1234.0 cm-1 is barely detectable on the disk-integrated spectrum.
Figure 1: The disk-integrated TEXES spectrum between 1232.5 and 1234.2 cm-1 (rest frequencies,
thick black line). Models: CO2 (blue), H2O2 with a
mixing ratio of 60 ppbv (red). Thin black line: standard atmospheric opacity at Maunakea Observatory, shifted vertically by 0.01 for clarity.
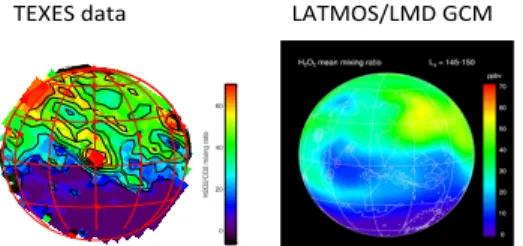
Figure 2 shows the H2O2 map retrieved from our observation, compared with the GCM prediction. It can be seen that, as expected by the model, there is a clear dichotomy between the northern and southern
EPSC Abstracts
Vol. 11, EPSC2017-175, 2017
European Planetary Science Congress 2017
c
hemispheres, even stronger in the TEXES data than predicted by the GCM.
Figure 2: (left)Map of the H2O2 mixing ratio, in ppbv,
inferred from the H2O2/CO2 line depth ratio, using a
summation of the two H2O2 doublet lines at 1234.0
cm-1 and the CO
2 transition at 1233.2 cm-1. (right)
GCM model corresponding to the same observing conditions. The Martian North pole is at the top of both figures.
Figure 3 shows the observed seasonal variations of H2O2 on Mars including all published measurements, compared with several models. It can be seen that the present TEXES measurement is the highest value ever measured, and is in good agreement with both GCM models (homogeneous and heterogeneous).
Figure 3: Seasonal variations of H2O2 on Mars
(observations and models), for a mean latitude of 20N for Ls = 0 -180°, and 20S for Ls = 180-360°.The figure is adapted from [7].
Possible
interannual
variations
around aphelion
A special situation appears in the region of Ls = 70 – 120°, i.e. in the vicinity of northern summer and near aphelion. There are two upper limits, measured in
2001 by TEXES and in 2010 by Herschel/HIFI, that are significantly below the expected values, while two other TEXES measurements, in 2008 and 2014, are in good agreement with the GCM. In contrast, all measurements corresponding to other seasons are consistent with the model. This anomaly suggests that interannual variations might be present at the time of aphelion.
At the time of the first H2O2 detection by Clancy et al. (2004), at Ls = 256°, the authors suggested that the absence of detection by TEXES in 2001 (Ls = 110°) might be due to the fact that the height of the hygropause is known to be very low near aphelion [8, 9], because of a combination of a large water vapour content and a low temperature. Indeed, in 1995 and 1997, the altitude of the hygropause, measured from millimetre observations, was found to be only a few kilometres [9, 10]. This might affect the H2O2 formation process which is expected to take place at higher levels. While the H2O column density has been well monitored and is known to show little interannual variations, the height of the hygropause is less well known and might be more variable, due possibly to different dust conditions. Such variations would have little effect on the total H2O column density. In order to test this hypothesis, it will be interesting to investigate whether a correlation exists between the H2O2 content and the altitude of the hygropause. This can be tried using different means: the H2O vertical profiles of SPICAM/Mars Express [11,12], the millimetre and submillimetre spectra of H2O and HDO [13], or the OMEGA/Mars Express data showing the altitude of the H2O cloud.
References:
[1] Oyama,V. I. et al. 1977. Nature 265, 100 [2] Bullock, M. A. et al. 1994. Icarus 107, 142
[3] Lefèvre, F. et al. 2008. Nature 454,971 [4] Encrenaz, T. et al. 2004. Icarus 170, 424
[5] Encrenaz, T. et al. 2012. Plan. Space Sci. 68, 3 [6] Lacy, J. H. et al. 2002. Pub. Astron. Soc. Pac. 114, 153
[7] Encrenaz, T. et al. 2015. Astron. Astrophys. 578, A127
[8] Clancy, R. T. et al. 2004. Icarus 168, 116 [9] Clancy, R. T. et al. 1996. Icarus 122, 36 [10] Encrenaz, T. et al. 2001. Plan. Space Sci. 49, 731
[11] Maltagliati, L. et al. 2011. Science 333, 1868 [12] Maltagliati, L. et al. 2013. Icarus 233, 942 [13] Jarchow, C. et al. 2011. EPSC-DPS Joint Meeting, Nantes, October 2011
H
2O
2/CO
2)mixing)ra9o,)Ls)=)148.5°)
)TEXES)data ) ) ) ) ) )LATMOS/LMD)GCM)
Seasonal)varia9ons)of)H
2O
2) A&A 578, A127 (2015)Fig. 16.Seasonal cycle of hydrogen peroxide on Mars integrated over the Martian disk. Observed regions are centered around 20N during northern spring and summer, and around 20S during northern autumn and winter. Yellow: 3D GCM model considering only the gas phase. Blue: 3D GCM model considering heterogeneous chemistry on wa-ter ice grains. Blue circles: 1D model by Krasnopolsky (2009). Green squares: 1D model by Moudden (2007). The figure has been updated from Lefèvre et al. (2008) and Encrenaz et al. (2012).
toward the north pole and toward southern latitudes, expected from the GCM, is also observed in the TEXES data.
4.1.3. Seasonal variations of hydrogen peroxide
Seasonal variations of hydrogen peroxide, recorded with TEXES and other means (JCMT, Herschel/HIFI) between 2004 and 2010, were shown in Encrenaz et al. (2012). Northern latitudes (around a mean value of 20N) were observed during north-ern spring and summer, while southnorth-ern latitudes around 20S were observed during northern autumn and winter. Results were compared with various photochemical models, including the 1D models of Moudden (2007) and Krasnopolsky (2009), and the GCM models developed assuming both homogeneous and heterogeneous chemistry. Our conclusion was that the observed data was in better agreement with the GCM heterogeneous model (Lefèvre et al.2008; Encrenaz et al.2012). However, no data were recorded between Ls = 120 and Ls = 180 , a sea-son critical for distinguishing between di↵erent photochemical models.
The July 2014 data help us to fill this gap, while the March 2014 data provide a new point around northern summer solstice, also critical for distinguishing among models, for which con-tradictory results were obtained in the past. In the case of the March 2014 data, using Fig.6, we first estimate a mean mix-ing ratio over the 20N latitude range, notmix-ing that the disk cen-ter actually corresponds to this latitude. We derive a H2O2 disk-averaged mixing ratio of 15 +/ 7 ppb, in good agreement with the GCM value. In the case of the July 2014 data, we cannot es-timate the mean TEXES value for a latitude of 20N but, based on the good agreement of TEXES with the GCM in Region B, from the GCM map we use a mean value of 30 +/ 7 ppbv over the 20N latitude range.
Figure16shows the mean 20N and 20S variations of H2O2 as a function of the areocentric longitude Ls updated from the work of Lefèvre et al. (2008) and Encrenaz et al. (2012). It can be seen that, in spite of the relatively large error bars of the data and the models, the two new data points obtained in 2014 fa-vor the heterogeneous model developed by Lefèvre et al. (2008). This model, initially based on the seasonal behavior of ozone in
the Earth, was able to reproduce the ozone seasonal cycle on Mars, assuming that water ice clouds provide sites for uptaking ozone-destroying hydrogen radicals HOx. This mechanism leads to H2O2abundances that are lower than in a simulation that only takes into account gas-phase chemistry.
The di↵erence between the H2O2contents in the homoge-neous and heterogehomoge-neous chemistry models may be visible on their disk-integrated mixing ratios, as shown in Fig.16, and also in their spatial distribution over the disk. For Ls = 96 (March 2014), the ice clouds are expected to be at a maximum near the equator (Smith2004), and so is the depletion of H2O2 in the heterogeneous model (Fig.16). Such a depletion, with respect to higher northern latitudes, is actually observed with TEXES (Fig.6). For Ls = 156 , in contrast, the water ice deple-tion at the equator is much less (Smith2004), and the H2O2 de-pletion due to reactions on ice near the equator is much less pro-nounced, both from the observation (Fig.12) and in the GCM (Fig.16).
In spite of their relatively large error bars, the new TEXES data provide additional support to the heterogeneous chemistry model. A puzzling question remains, however: the upper limit of 3 ppbv recorded by Herschel/HIFI for Ls = 77 (Hartogh et al.2010) remains unexplained. The upper limit recorded by TEXES for Ls = 112 (10 ppbv, Encrenaz et al. 2002) is also surprising; however, the time exposure for this dataset was quite short, so the data quality was significantly lower than for the following runs. Nevertheless, there are still possibly interannual variations of hydrogen peroxide that need to be better understood.
4.1.4. Vertical distribution of hydrogen peroxide
As mentioned above, we have assumed in our study a constant vertical mixing ratio for hydrogen peroxide. However, photo-chemical models predict that H2O2is essentially confined near the surface as it mimics the water behavior as a function of season (Clancy & Nair1996; Lefèvre et al.2004; Encrenaz et al.2012), following the variations of the hygropause which is quite low at both of the seasons observed here. As a result, the H2O2 mixing ratios retrieved in this study might be underesti-mated at the surface. However, photochemical models (Lefèvre et al.2004) predict that the H2O2cuto↵ is located between 10 and 20 km, i.e., above the region probed by TEXES. Thus, the assumption of constant mixing ratio is expected to have a minor influence on our results.
4.2. HDO and H2O
As in our previous analyses (Encrenaz et al.2005,2008,2010), we have converted our HDO measurements into H2O mixing ratios for a comparison with earlier observations (Smith2002, 2004) and GCM results. We first need to make an assumption of the mean D/H ratio on Mars. Past observations indicate mean or localized enrichments (with respect to the terrestrial value, the Standard Mean Ocean Water SMOW) of 6 +/3 (Owen et al. 1989), 5.2 +/ 1.0 (Krasnopolsky et al. 1997), 5.0 (Hartogh et al.2011) and 6.0 +/ 1.0 (Webster et al.2013). Maps of D/H during northern spring were measured by Novak et al. (2011) and Villanueva et al. (2015) during northern spring, indicating a Martian D/H ratio around 7 times the terrestrial value; in addi-tion, Villanueva et al. (2015) observed strong variations of the D/H ratio over the disk (from about 2 to 9 times the SMOW value). In their model of the HDO cycle, Montmessin et al. forced the north polar cap reservoir with a deuterated content of A127, page 8 of12 W The)TEXES)observa9ons)favor)the)LATMOS/LMD)heterogeneous)model) W Twp)points)(black)circles))show)a)clear)discrepancy) ) !!TEXES!!2016!!!!!!!!!! !!!!!!!!!!!!!! ! !!!!!!!!!!!!!X!!!!!!!!!!!!!! !