HAL Id: tel-01132605
https://tel.archives-ouvertes.fr/tel-01132605
Submitted on 17 Mar 2015HAL is a multi-disciplinary open access archive for the deposit and dissemination of sci-entific research documents, whether they are pub-lished or not. The documents may come from teaching and research institutions in France or abroad, or from public or private research centers.
L’archive ouverte pluridisciplinaire HAL, est destinée au dépôt et à la diffusion de documents scientifiques de niveau recherche, publiés ou non, émanant des établissements d’enseignement et de recherche français ou étrangers, des laboratoires publics ou privés.
Integration of an in vitro blood brain barrier model with
organic electrochemical transistors
Manuelle Bongo
To cite this version:
Manuelle Bongo. Integration of an in vitro blood brain barrier model with organic electrochemical transistors. Other. Ecole Nationale Supérieure des Mines de Saint-Etienne, 2014. English. �NNT : 2014EMSE0753�. �tel-01132605�
1 NNT : 2014 EMSE 0753
THÈSE
présentée par
Manuelle BONGO
pour obtenir le grade de
Docteur de l’École Nationale Supérieure des Mines de Saint-Étienne
Spécialité : Bioélectronique
Integration of an in vitro blood brain barrier model with
organic electrochemical transistors
soutenue à Gardanne, le 29 septembre 2014 Membres du jury
Président : Pierre-Olivier COURAUD Directeur de Recherche (DRCE) INSERM, Institut Cochin, Paris
Rapporteurs : Susan DANIEL Professeur, School of Chemical and Bio
molecular Engineering Cornell University , Ithaca Noëlle CALLIZOT Pharmacienne, Neurosys, Gardanne
Co-encadrant : Roisin OWENS Maître Assistante , ENSMSE, Gardanne Directeur de thèse : George MALLIARAS Professeur, ENSMSE, Gardanne
2
A mes parents, Manuel et Aurélie BONGO « Quand on veut, on peut. »
3
Spécialités doctorales Responsables Spécialités doctorales Responsables
SCIENCES ET GENIE DES MATERIAUX K. Wolski Directeur de recherche MATHEMATIQUES APPLIQUEES O. Roustant, Maître-assistant MECANIQUE ET INGENIERIE S. Drapier, professeur INFORMATIQUE O. Boissier, Professeur
GENIE DES PROCEDES F. Gruy, Maître de recherche IMAGE, VISION, SIGNAL JC. Pinoli, Professeur SCIENCES DE LA TERRE B. Guy, Directeur de recherche GENIE INDUSTRIEL A. Dolgui, Professeur SCIENCES ET GENIE DE L’ENVIRONNEMENT D. Graillot, Directeur de recherche MICROELECTRONIQUE S. Dauzere Peres, Professeur
ABSI Nabil CR CMP
AVRIL Stéphane PR2 Mécanique et ingénierie CIS
BALBO Flavien PR2 FAYOL
BASSEREAU Jean-François PR SMS
BATTON-HUBERT Mireille PR2 Sciences et génie de l'environnement FAYOL
BERGER DOUCE Sandrine PR2 FAYOL
BERNACHE-ASSOLLANT Didier PR0 Génie des Procédés CIS
BIGOT Jean Pierre MR(DR2) Génie des Procédés SPIN
BILAL Essaid DR Sciences de la Terre SPIN
BOISSIER Olivier PR1 Informatique FAYOL
BORBELY Andras MR(DR2) Sciences et génie des matériaux SMS
BOUCHER Xavier PR2 Génie Industriel FAYOL
BRODHAG Christian DR Sciences et génie de l'environnement FAYOL
BRUCHON Julien MA(MDC) Mécanique et ingénierie SMS
BURLAT Patrick PR2 Génie Industriel FAYOL
COURNIL Michel PR0 Génie des Procédés DIR
DARRIEULAT Michel IGM Sciences et génie des matériaux SMS
DAUZERE-PERES Stéphane PR1 Génie Industriel CMP
DEBAYLE Johan CR Image Vision Signal CIS
DELAFOSSE David PR1 Sciences et génie des matériaux SMS
DESRAYAUD Christophe PR2 Mécanique et ingénierie SMS
DOLGUI Alexandre PR0 Génie Industriel FAYOL
DRAPIER Sylvain PR1 Mécanique et ingénierie SMS
FEILLET Dominique PR2 Génie Industriel CMP
FEVOTTE Gilles PR1 Génie des Procédés SPIN
FRACZKIEWICZ Anna DR Sciences et génie des matériaux SMS
GARCIA Daniel MR(DR2) Génie des Procédés SPIN
GERINGER Jean MA(MDC) Sciences et génie des matériaux CIS
GOEURIOT Dominique DR Sciences et génie des matériaux SMS
GRAILLOT Didier DR Sciences et génie de l'environnement SPIN
GROSSEAU Philippe DR Génie des Procédés SPIN
GRUY Frédéric PR1 Génie des Procédés SPIN
GUY Bernard DR Sciences de la Terre SPIN
HAN Woo-Suck CR Mécanique et ingénierie SMS
HERRI Jean Michel PR1 Génie des Procédés SPIN
KERMOUCHE Guillaume PR2 Mécanique et Ingénierie SMS
KLOCKER Helmut DR Sciences et génie des matériaux SMS
LAFOREST Valérie MR(DR2) Sciences et génie de l'environnement FAYOL
LERICHE Rodolphe CR Mécanique et ingénierie FAYOL
LI Jean-Michel Microélectronique CMP
MALLIARAS Georges PR1 Microélectronique CMP
MOLIMARD Jérôme PR2 Mécanique et ingénierie CIS
MONTHEILLET Frank DR Sciences et génie des matériaux SMS
MOUTTE Jacques CR Génie des Procédés SPIN
NEUBERT Gilles FAYOL
NIKOLOVSKI Jean-Pierre CMP
NORTIER Patrice PR1 SPIN
PIJOLAT Christophe PR0 Génie des Procédés SPIN
PIJOLAT Michèle PR1 Génie des Procédés SPIN
PINOLI Jean Charles PR0 Image Vision Signal CIS
POURCHEZ Jérémy CR Génie des Procédés CIS
ROBISSON Bruno CMP
ROUSSY Agnès MA(MDC) CMP
ROUSTANT Olivier MA(MDC) FAYOL
ROUX Christian PR CIS
STOLARZ Jacques CR Sciences et génie des matériaux SMS
TRIA Assia Ingénieur de recherche Microélectronique CMP
VALDIVIESO François MA(MDC) Sciences et génie des matériaux SMS
VIRICELLE Jean Paul MR(DR2) Génie des Procédés SPIN
WOLSKI Krzystof DR Sciences et génie des matériaux SMS
XIE Xiaolan PR1 Génie industriel CIS
YUGMA Gallian CR Génie industriel CMP
BERGHEAU Jean-Michel PU Mécanique et Ingénierie ENISE
BERTRAND Philippe MCF Génie des procédés ENISE
DUBUJET Philippe PU Mécanique et Ingénierie ENISE
FEULVARCH Eric MCF Mécanique et Ingénierie ENISE
FORTUNIER Roland PR Sciences et Génie des matériaux ENISE
GUSSAROV Andrey Enseignant contractuel Génie des procédés ENISE
HAMDI Hédi MCF Mécanique et Ingénierie ENISE
LYONNET Patrick PU Mécanique et Ingénierie ENISE
RECH Joël PU Mécanique et Ingénierie ENISE
SMUROV Igor PU Mécanique et Ingénierie ENISE
TOSCANO Rosario PU Mécanique et Ingénierie ENISE
ZAHOUANI Hassan PU Mécanique et Ingénierie ENISE
ENISE : Enseignants-chercheurs et chercheurs autorisés à diriger des thèses de doctorat (titulaires d’un doctorat d’État ou d’une HDR) EMSE : Enseignants-chercheurs et chercheurs autorisés à diriger des thèses de doctorat (titulaires d’un doctorat d’État ou d’une HDR)
4
Table of Contents
Table of Contents………..….……4
Acknowledgements……….9
Abbreviations………..…………...…..11
List of Tables and Figures………..………..14
Abstract………22
Aim of the Thesis……….25
1/ Chapter 1: Introduction to OECT for Biological Applications………26
1.1 Organic Electrochemical Transistor………...28
1.1.1 General Consideration……….28 1.1.2 Configuration………...29 1.1.3 Advantages………..29 1.1.4 Conducting Polymers………..30 1.1.5 Operational Principle……….…………..31 1.2 Applications in Biology……….…….33
1.2.1 OECTs coupled with biological moieties for sensing..……….33
1.2.2 OECT coupled with whole cells for electrophysiology …………..….41
1.3 Conclusion……….….49
1.4 Bibliography………...50
2/ Chapter 2: Blood Brain Barrier Characterisation ………...57
2.1 Introduction………58
2.2 History of the Blood Brain Barrier..……….………..58
2.3 Structure……….59
2.3.1 A Biological Barrier………59
2.3.1.1 Brain Endothelial Cells……….60
5 2.3.1.3 Pericytes ………...61 2.3.1.4 Neurons ………62 2.3.2 A Physical Barrier………..………….62 2.3.2.1 Tight Junctions……….…….63 2.3.2.2 Adherens Junctions……….……64 2.3.3 A Physiological Barrier………...64
2.3.3.1 The Paracellular Pathways………65
2.3.3.2 Transcellular Pathways……….……66
2.3.4 A Metabolic Barrier……….67
2.3.4.1 Enzymes………67
2.3.4.2 Efflux Pumps………68
2.4 In vitro Model of Blood Brain Barrier………...71
2.4.1 Parameters Used to Assess in vitro Model of Blood Brain Barrier…….71
2.4.1.1 Permeability Measurement………...71
2.4.1.2 Measurement of TER………72
2.4.2 Different Type of Cell Culture………77
2.4.3 Different Type of Blood Brain Barrier Model………77
2.4.3.1 Bovine Model………...77
2.4.3.2 Rat and Mouse Model………..78
2.4.3.3 Porcine Model………..79
2.4.3.4 Human Model……….………..79
2.5 Conclusion………..80
2.6 Bibliography………...80
3/ Chapter 3: Development and Characterisation of Different Types of in vitro BBB Models ……….88
3.1 Introduction………89
6 3.2.1 Generality on Bovine Brain Endothelial Cells………89 3.2.2 Materials and Methods ………...………90 3.2.3 Results and Discussion………92 3.2.3.1 Experiment 1: Observation of BBECs Morphology………….92 3.2.3.2 Experiment 2: Measurement Integrity of BBECs using
Permeability Assays………..………93 3.2.3.3 Experiment 3: Integrity of BBECs and Biocompatibility with PEDOT(TOS) Using Collagen Coating………94 3.2.3.4 Experiment 4: Integrity of BBECs and Biocompatibility with PEDOT(TOS) Using Gelatin Coating………..………96 3.2.4 Conclusion………...97 3.3 In vitro BBB Model Using Human Brain Microvascular Endothelial Cells (HBMEC) …………...…………...………..98
3.3.1 Generality on Human Brain Microvascular Endothelial Cells…………98 3.3.2 Materials and Methods………98 3.3.3 Results and Discussion………..………101
3.3.3.1Experiment 1: Immunofluorescence Time Course of
HBMEC………..………101 3.3.3.2 Experiment 2: Integrity of Monoculture and Contact Co-culture of HBMEC………..…………102 3.3.3.3 Experiment 3: Integrity of Monoculture Conditioned, Contact and No Contact Co-culture of HBMEC………..…………104 3.3.3.4 Experiment 4: Impact of endogenous extracellular matrix on the integrity of Monoculture Conditioned, Contact and No Contact Co-culture of HBMEC………..………107 3.3.3.5 Experiment 5: Impact of Hydrocortisone on Integrity of Monoculture Conditioned, Contact and No Contact Co-culture of HBMEC……….……..…………...110 3.3.4 Conclusion……….112 3.4 In vitro BBB Model Using Immortalized Human Cerebral Microvascular Endothelial Cells (hCMEC/D3) ………112
7 3.4.1 Generality on Immortalized Human Cerebral Microvascular Endothelial
Cell (hCMEC/D3)………….……… ……….112
3.4.2 Materials and Methods……….………...113
3.4.3 Results and Discussion………..114
3.4.3.1 Experiment 1: Immunofluorescence Time Course of hCMEC/D3………...114
3.4.3.2 Experiment 2: Integrity of Monoculture Conditioned, Contact and No Contact Co-culture of hCMEC/D3……….…………116
3.4.3.3 Experiment 3: Impact of Neuron on Integrity of Monoculture Conditioned, Contact and No Contact Co-culture of hCMEC/D3…119 3.4.4 Conclusion……….121
3.5 Integration of hCMEC/D3 with OECT………121
3.5.1 Materials and Methods………..121
3.5.2 Results and Discussion of Integrity of hCMEC/D3 Using OECT Measurement………….………..122
3.5.3 Conclusion……….123
3.6 Conclusion………...124
3.7 Bibliography……….124
4/ Chapter 4: PEDOT:gelatin composites mediate brain endothelial cell adhesion………..126
4.1 Introduction………..128
4.2 Materials and Methods……….129
4.2.1 Material ……….129
4.2.2 Vapor Phase Polymerisation of PEDOT(TOS) and PEDOT(TOS) Composite Films……….130
4.2.3 Characterisation of PEDOT(TOS) and PEDOT(TOS) Composite Films………...130
4.2.4 Cell Culture and Characterisation of Cell Growth and Proliferation ...131
8 4.3.1 Preparation and Characterisation of PEDOT(TOS):gelatin
Composites……….132
4.3.2 Growth of bovine BBCEC on PEDOT(TOS) Composite Films…..….139
4.4 Conclusion………...142
4.5 Bibliography……….143
5/ Chapter 5: Integration of an in vitro Model of the Blood Brain Barrier with the OECT……….……….………146
5.1 Introduction………..148
5.2 Materials and Methods……….149
5.2.1 OECT Fabrication……….…….149
5.2.2 OECT Measurement………..151
5.2.3 Cell Culture………151
5.3 Results and Discussion……….153
5.3.1 Microscale OECT for Monitoring BBB Toxicology ………153
5.3.2 OECT as a Better Sensing Methods for Monitoring BBB Cells……..160
5.4 Conclusion………...163
5.5 Bibliography……….163
9
Acknowledgements
The present work was carried out at Department of Bioelectronics (BEL), in the Center of Microelectronics in Provence (CMP), a Research and Education center of the École des Mines de Saint-Étienne, located in Gardanne. This work has been funded by the European Research Council (ERC).
First, I want to express my gratitude to my principle supervisor, Associate Professor Dr. Roisin Owens, for giving me the opportunity to work in her research goup and for giving me the possibility to grow into an independent scientist. I am thankful for her encouragement, support and invaluable advice during these years. Without her, this thesis would not have been completed.
I also need to extend my gratitude to my director Pr. George Malliaras who has provided invaluable insight, fresh perspectives and incredible opportunities for the members of his research groups over the years. I am thankful for his enthusiasm about research. I wish to the BEL group the best of luck in the years to come.
I am honoured to have Pr. Pierre-Olivier Couraud in the public examination of this thesis. I am grateful to the official reviewers of this thesis, Pr. Susan Daniel and Pr. Noelle Callizot for their careful review and valuable comments.
In the BEL group, I have had the opportunity to work with many talented scientists and good people:
I am very grateful to the talented Dr. Marc Ramuz (Marcus), for his huge help for this thesis, teaching me “electronics” and always available to explain and guide me in my experiments. Thanks you for all these electronics devices!
Next, I need to thank the best engineer, Adel Hama, (Adeligno) for his help, advice in bilogy and availability during these 3years.
I would also like to thank Dr. Miriam Huerta (Mimi) for her help and encouraging discussion about blood brain barrier (and her amazing guacamole!).
Then I need to thank the future Dr. Xenofon Strakosas, the happy face of my office, born 1 day before me, for his huge help on paper and explanation about electronic field (and this beautiful and enjoyable Greece trip!).
I would like to thanks Dr. Eleni Stavrinidou, the best officemate, for her smile every day, her help and all our “very interesting” conversations.
After I would like to thanks Dr. Scherrine Tria, the first PhD student that I met, for her help in several protocol during this thesis.
I need to thank Dr Leslie Jimison, (Lady Leslie), for teaching me “the secret” of pedot. Then I would like to thanks Cassandre Vuillaume, for all the good time spent together and her delicious cakes.
10
I also need to extend my gratitude to the Neuro Group:
I would like to thank Dr. Pierre Leleux (Peio), I will never forget this crazy Atlanta trip!!! Thanks you for all these electronic advice even 24h before my defence!
Next I would like to thank Dr. Jonathan Rivnay (JonnyJonny), thank you so much for your help and make the bandwith fit for BBB!!
I would also like to thanks Dr. Esma Ismalova Bernard Salas (Mme BS), for her smily angel face every day and her help and support during these three years.
I would also like to thanks Liza Klots-Rivnay for her careful revision of the language of the thesis (and her amazing Chili!).
I would also like to thanks Dr. Thomas Doublet (Mister T.) for his happiness and funny jokes! I need to thanks Dr. Dion Khodagholy for his explanation about electronics and these great moments in New York.
And all PhD students, post doc, Dr. for all these enjoyable moment during this thesis: Marc, Michele, Dimitri, Thomas L, Sahika, Ilke, Sylvain, Duc, Bartek,, Mary, Eloise.
I also wish to thank all the personnel in Center of Microelectronics in Provence (CMP): Veronique Villareal, Michel Fiocchi, Thierry Camilloni, Jessica Mazuir, Sabine Salmeron, Barbara Bruno, Michelle Gillet and Gracien Counot. And also all PhD student and people of other department SAS and PS2 where I met many nice people.
Life is more than just work or science. I wish to thank my friends who always supported me: Claire (you and me in the same boat, like the fingers of a hand!), Laure-Helene (my best!), Vero (marousse), Nicolas (monbichon), Ludovic, Assa, , Alio (mablonde), Aude, Nelly (magrosse), Zouzou, Hajer, Bertrand, Gizou, Benjamin (beninoi), mon jaki, Nadou, Isa, Magno and all….
And Arnaud (namour), for love and cooking every night when I arrive late! Thanks you all.
From the bottom of my heart, I would like to express my gratitude to my blood, BONGO Family:
To my grandmothers, Mouabouere Bongo and Gueli Awa, to my uncle and aunties, tonton Patty, tonton Dydime, tantine Elise, tonton Kadjou, tonton Jo, tantine Chanel, tantine Melas, tonton Aristide, and all my cousins, I have made your proud.
To my parents Manuel Bongo and Aurelie Bongo who have always loved and supported me, and constantly inspired me to reach even higher goals in my life “when you want you can”, I will never forget . Thanks to my brothers and sisters, Andre-July, Idrysse-Antoine, Diane-Aurelie, Lucas-Loic and Oceane, I love you.
11
Abbreviations
ABC: ATP-Binding Cassette AC: Alternating Current
ACM: Astrocyte Conditioned Media AFM: Atomic Force Microscopy AJ: Adherent Junction
AGS: Astrocyte Growth Supplement AM: Astrocyte Media
AMP: Adenosine Monophosphate ATP: Adenosine Triphosphate BBB: Blood Brain Barrier
BBEC: Bovine Brain Endothelial Cells
BBCEC: bovine brain capillary endothelial cell BBMEC: Bovine Brain Microvessel Endothelial Cell BDNF: Brain Derived Neurotrophic Factor
BMECs: Brain Microvascular Endothelial Cells BSA: Bovine Serum Albumin
BCRP: Breast Cancer Resistance Protein CN: Cortical Neurons
CNS: Central Nervous System CPs: Conducting polymers CS: Calf Serum
CV: Cyclic Voltammetry
DBSA: Dodecyl Benzene Sulfonic Acid DC: Direct Current
DMEM: Dulbecco's Modified Eagle Medium EBM: Endothelial Basal Medium
ECIS: Electric Cell substrate Impedance Sensing ECM: Extra Cellular Matrix
ECoG: Electrocorticography
12 EDOT: 3,4-Ethylenedioxythiophene
EDTA: Ethylenediaminetetraacetic acid EEG: Electroencephalography
EGT: Electrolyte Gated Transistor EGTA: Ethylene Glycol Tetraacetic Acid
EGOFET: Electrolyte Gated Organic Field EffectTransistor EVOM: Epithelial Voltohmmeter
FCS: Fetal Calf Serum
FGF: Fibroblast Growth Factor
GOPS: 3-glycidoxypropyltrimethoxysilane γ-GT: Gamma Glutamyl Transpeptidase HA: Human Astrocyte
HBMEC: Human Brain Microvascular Endothelial Cells
h CMEC/D3: Immortalized Human Brain Endothelial Cell Line HIV: HumanIimmunodeficiency Virus
HS: Horse Serum ID: drain current IG: gate current
IgG: Immunoglobulin G
JAM: Junctional Adhesion Molecule LY: Lucifer Yellow
MCF: Michigan Cancer Foundation MDCK: Madin Darby Canine Kidney MOA: Mono Amine Oxidase
MRP: Multidrug Resistance-associated Protein MW: Molecular Weight
NR: Normalized Response NVU: Neurovascular Unit
OAT: Organic Anion Transporters
OATP: Organic Anion Transporters Polypeptide OECT: Organic Electrochemical Transistor PAL: Phosphatase Alkaline
13 PBMEC: Porcine Brain Microvessel Endothelial Cell
PBS : Phosphate Buffered Saline PDMS : Polydiméthylsiloxane
PEDOT: Poly 3-4 EthyleneDiOxyThiophene PEG: Poly(ethyleneglycol)
P-gp: P-glycopreotein Pt: Platinium
PSS: Polystyrene sulfonate
QCM: Quartz Crystal Microbalance
RBMEC: Rat Brain Microvessel Endothelial Cell RBE4: Rat Brain Endothelial
RTIL: Room Temperature Ionic Liquid SEM: Scanning Electron Microscopy SNR: Signal-to-Noise Ratio
SLC: Solute Carrier Transporter
TER or TEER: Trans Electrical Endothelial Resistance TJ: Tight Junctions
TOS: Tosylate Vg: Gate Voltage
VPP: Vapor Phase Polymerisation XPS: X-ray Photoelectron Spectroscopy
14
List of Tables and Figures
Chapter 1: Introduction to OECT for Biological Applications
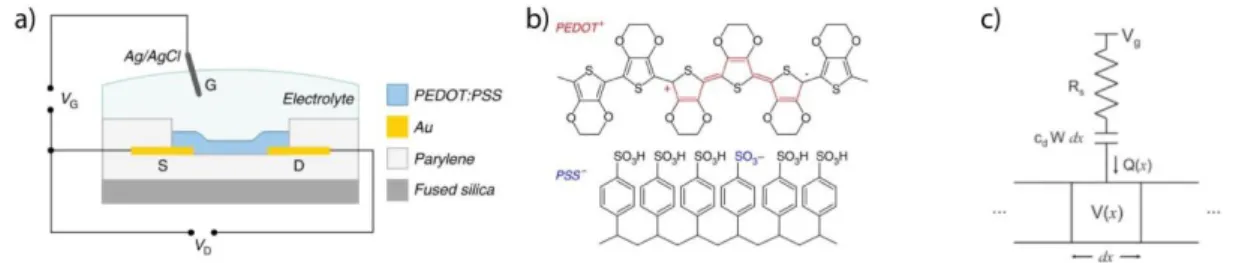
Figure 1.1: The organic electrochemical transistor: a. schematic cross-section of an
OECT b. PEDOT:PSS structure. (a, b reproduced from [5], with permission from [Nature Publishing Group]) c. Ionic circuit of an OECT (c reproduced from [6], with permission from [Wiley-VCH ])………..28
Figure 1.2: Robust micrometer scale, high amplification OECTs: a. an array of
OECTs on a thin flexible substrate: scale bar = 1 cm b. the array is extensively crumpled c. transfer characteristics of device before (red) and after (blue) crumpling b. transconductance and time response for devices before (red) and after (blue) crumpling. (a, b, c reproduced from [5], with permission from [Nature Publishing Group])……….………32
Figure 1.3: OECTs used as ion sensors a. Transfer characteristics of an OECT for
different concentrations of KCl solutions (Vd = -0.1 V). (reproduced from [31], with permission from [ACS Publications]). b. Wheatstone bridge circuit diagram. c. The peak-to-peak voltage difference as a function of concentration difference of NaCl solution, inset curve shows the raw data. (b, c reproduced from [33], with permission from [American Institute of Physics]). d. schematic of Ion-selective OECT. e. Calibration curves (Id, Vg,m vs concentration) of pure KCl and NaCl solutions performed using ion selective OECT (IS-OECT). (d, e reproduced from [34], with permission from [Wiley Online Library])………34
Figure 1.4: OECTs used as enzymatic sensors: a. i) Transfer of electron from glucose
to the gate though the biological reaction catalyzed by glucose oxidase ii) de-doping mechanism of PEDOT:PSS at the channel b. Drop of potential at the interfaces and its dependence to the gate/ channel size ratio. (b, is reproduced and modified from [42] with permission from [Wiley Online Library]) c. Schematic layout of an OECT glucose sensor with the gate modified with Pt NPs, MWCTS and GOx f. The dependence of ∆Vg,eff as a function of log[Cglucose] for CHIT/GOx/Pt (line I), MWCNT-CHIT/GOx/Pt (line II) and CHIT/GOx/Pt-NPs/Pt (line III) gate electrodes. (c, d are reproduced from [44] with permission from [Wiley – VCH]). e. Schematic layout of an OECT lactate sensor with solid state ionogel electrolyte. f. Normalized response of the OECT vs. lactate concentration. (e, f are reproduced from [47] with permission from [RSC Publishing])……….38
Figure 1.5: OECTs as Immunosensors and nucleotide sensors: a. Schematic of an E.
15 the electric double layers (EDL), including the channel/electrolyte and electrolyte/gate interfaces, in the OECT before and after the immobilization of E. coli O157:H7 on the PEDOT:PSS surface. (a, b, reproduced from [50], with permission from [RSC Publishing]) c. Schematic of an OECT integrated in a flexible microfluidic system, which is characterized before and after the modification and the hybridization of DNA on the surface of Au gate electrode. d. Transfer characteristics of OECTs measured in microfluidic channels before and after the immobilization and the hybridization of DNA on Au gate electrodes. Vds = − 0.1 V. The inset shows the horizontal shifts of the transfer curves. (c, d, reproduced from [52], with permission from [Wiley Online Library])………..……….41
Figure 1.6: : Barrier tissue integrity at the interface with an OECT: a. Layout of an
OECT with an integrated barrier tissue b. Equivalent circuit describing ionic transport between gate electrode and transistor channel. TER refers to the transepithelial resistance of the cell layer, Ccell refers to the capacitance of the cell layer, Rfilter and Cfilter refer to the resistance and capacitance of the porous filter, respectively, Rmed refers to the resistance of the media, and Ccp refers to the capacitance at the CP and electrolyte layer c. Cartoon showing polarized Caco-2 cells with tight junctions (left) and without (right), sitting on a porous cell culture membrane, above a PEDOT:PSS transistor channel. Tight junctions are shown in yellow. d. OECT Id transient response with cells before (left) and after (right) the addition of 100 mM H2O2,(solid lines). OECT Id response in the absence of cells is overlaid (dashed lines) (a, b, c, d, reproduced from [56], with permission from [Wiley Online Library]) e. Picture of the multiplex device shown on a Petri dish inside the cell-culture incubator. The cell culture insert is shown suspended in the plastic holder affixed to the glass slide. The Ag/AgCl gate electrode is shown immersed in the apical media, while source and drain cables are attached to their respective positions on the glass slide g. Kinetics of polarized epithelial monolayer infected with Salmonella typhimurium. Cartoon illustrating infection with wildtype (WT) (left) and non-invasive S. typhimurium (right). Mean normalized response (τ) of the OECT in the presence of WT (left) and non-invasive S. typhimurium (right) at different MOI over 4 h, bacteria were added at t = 0. Non-infected represents OECT + cells with no added bacteria. Non-infected cells are in cyan, MOI: 10 in blue, MOI: 100 in purple, and MOI: 1000 in red. (e, f, g, reproduced from [57], with permission from [Wiley Online Library])Figure 1.7: (a). Recordings from an OECT (pink), a PEDOT:PSS surface electrode (blue) and an Ir-penetrating electrode (black). The transistor was biased with VD=−0.4 V and VG=0.3
V, and the scale of 10 mV is for both surface and penetrating electrodes. Note the superior SNR of the OECT as compared with the surface electrode (b). Time– frequency analysis of epileptiform activity during a short period, recorded by an OECT (top), a PEDOT:PSS surface electrode (middle) and an Ir-penetrating electrode (bottom)………...……….42
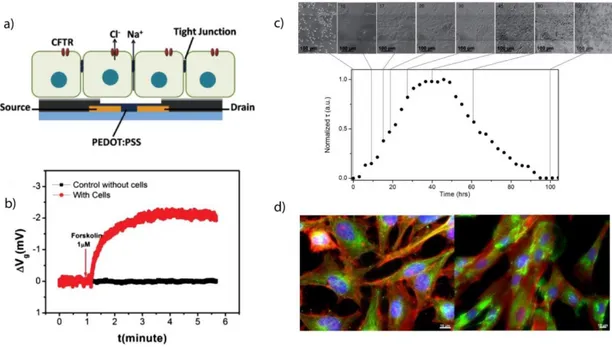
Figure 1.7: Non electrogenic cells in direct contact with OECTs: a. view of polarized
16 OECT b. In situ OECT response with (red) and without (black) Calu-3 cells upon the addition of 1 μM CFTR agonist forskolin. Transistor channel current change was converted to effective gate voltage change. (a, b reproduced from [62], with permission from [Wiley Online Library]). c. Micro-optical images of MDCK-I on top of the OECT channel area (the darker horizontal line in the middle of the picture corresponds to the PEDOT:PSS channel) and corresponding electrical characteristics with a measurement taken every 3h. d. Illustrative example of high resolution fluorescence imaging possible on PEDOT:PSS devices. HeLa cells (left) and immortalized human fibroblasts (right) (c, d, reproduced from [63], with permission from [Wiley Online Library])………..46
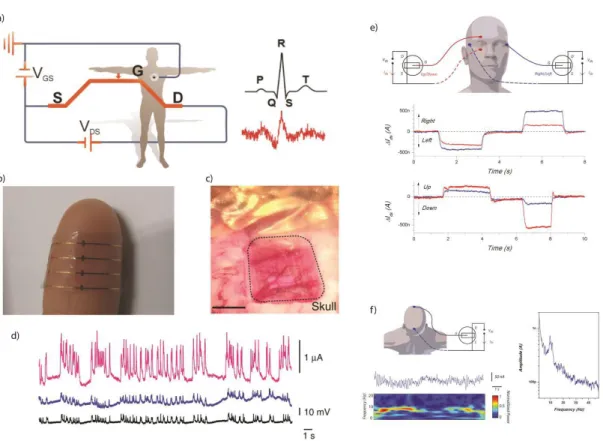
Figure 1.8: OECTs for measuring electrogenic cells: a. ECG recording with an OECT
operated in direct contact with the skin. b. Photograph of the device showing its transparency and adaptability when attached to human skin. (a, b, reproduced from [65], with permission from [Wiley Online Library]) c. Optical micrograph of the ECoG probe placed over the somatosensory cortex, with the craniotomy surrounded by dashed lines. Scale bar, 1mm d. Recordings from an OECT (pink), a PEDOT:PSS surface electrode (blue) and an Ir-penetrating electrode (black). The transistor was biased with Vd = - 0.4 V and Vg = 0.3 V, and the scale of 10mV is for both surface and penetrating electrodes. Note the superior SNR of the OECT as compared with the surface electrode. (c, d, reproduced from [28], with permission from [Nature Publishing Group]). e. Wiring configuration chosen for the EOG measurement, recording of electrical activity during left/ right eyeball movements, recording of electrical activity during up/down eyeball movements. Both up/ down (red) and left/ right (blue) activities are measured. f. Wiring configuration used for the EEG measurement, along with recording of spontaneous brain activity (top) showing the alpha rhythm, and associated time-frequency spectrogram (bottom), Fourier analysis of a 3min recording. (e, f, reproduced from [68], with permission from [Wiley – VCH])………...………48
Chapter 2: Blood Brain Barrier Characterisation
Figure 2.1: Historical research on the blood-brain barrier………..……59 Figure 2.2: Schematic representation of a blood-brain barrier………...…….…60 Figure 2.3: Representation of a section of brain capillaries with tight and adherens
junctions present between endothelial cells……….………62
Figure 2.4: Diagram of the different transport processes involved in the permeability
of brain capillaries……….……...65
17
Figure 2.6: Impedance measurements with like electrodes. The
chopstick-like electrodes (E1, E2) are traditionally used to determine the electric resistance of cells grown on filter inserts. The ohmic resistance of the cell layer (TER), the cell culture medium in the upper and lower compartment (RMed), the membrane of the
filter inserts (Rpm) and electrode-medium interface (RE) all contribute to the total
electric resistance. IAC: alternating current………..…….73
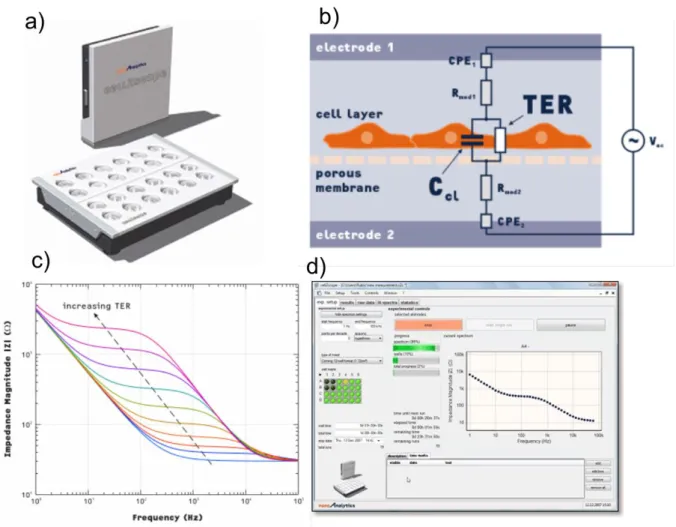
Figure 2.7: The CellZscope (a). CellZscope device (b). Equivalent circuit for cell
layer grown on porous filter (c). Impedance frequency scan (d). Overview of
CellZscope data acquisition window. Adapted from technical bulletin,
Nanoanalytics.com………...………74
Figure 2.8: Schematic drawing of an ECIS array and principle of the electric
cell-substrate impedance sensing (ECIS) method. (a) Cell layers are grown to confluence on integrated gold-film electrodes. An applied AC current flows between small working electrodes and the larger counter electrode using normal culture medium as an electrolyte. By a variation of the frequency ω, a spectrum can be obtained. Applying higher frequencies the current flow is dominated by the capacity of the total system, at mid-range frequencies the ohmic resistance of the total system is mirrored. (b) The current pathway at low frequencies on a cerebral endothelial cell monolayer (ECIS method, 400 Hz). At low frequencies the current predominantly flows paracellular (through extracellular matrix proteins) and between adjacent cells (through tight junctions) and the electrolyte (medium). (c) Application of high frequencies (ECIS method, > 40 kHz), the capacitive amount of measured impedance is especially sensitive for adhered cells. The current passes through the insulating cell monolayer, especially through cell membranes………..……….75
Figure 2.9: Schematic of planar OECT device which consists of a PEDOT:PSS
channel and gate patterned onto a glass slide………..………76
Chapter 3: Development and Characterisation of different types of in vitro BBB Models
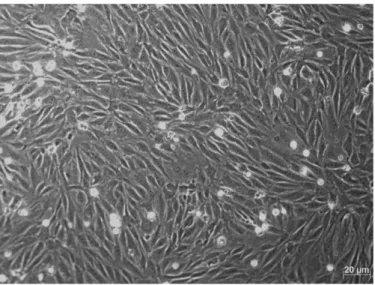
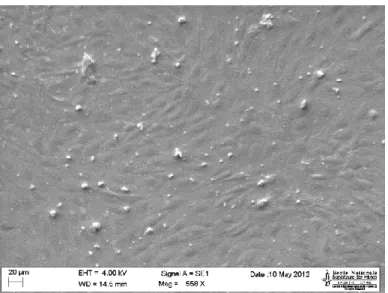
Figure 3.1: Light Microscope images of BBECs on well coated with gelatin………92 Figure 3.2: SEM of a confluent monolayer of BBECs on filter coated with gelatin...93 Table 3.1: Details of BBECs culture for experiment 1………..…..93 Table 3.2: Permeability of the BBECs culture for experiment 2………..….….94 Table 3.3: Details of the BBEC culture for experiment 3………...……95 Table 3.4: Permeability and TER results of the BBECs culture for experiment 3…..95 Table 3.5: Details of the BBEC culture for experiment 4………...…96
18
Table 3.6: Permeability and TER results of the BBECs culture for experiment 4…..96 Figure 3.3: Immunofluorescence staining of BBECs. (a). Immunofluorescence of
BBECs on gelatin coated filter, stained with antibodies against apical junction proteins ZO-1 (green), occludin (red) and nucleus (blue). (b). Immunofluorescence of BBECs on gelatin on top of PEDOT(TOS) coated filter, stained with antibodies against apical junction proteins claudin-1 (green), ZO-1 (red) and nucleus (blue)…97
Figure 3.4: A scheme of the different in vitro BBB models………..……99 Figure 3.5: Cells cultured on the underside of the filter membrane. (a) 24well filter is
upside down in 12 well plate containing water. (b) Cells are seeded onto the underside of the membrane for 2h in the incubator. (c) The filter is placed in 24 well plates for the rest of experiment……….100
Figure 3.6: Immunofluorescence of HBMEC of ZO-1 (red) and claudin 5 proteins
(green) at day 2, 4 and 6. Nucleus is stained with DAPI (blue)……….101
Figure 3.7: Schematic for the HBMEC experiment 2………..…102 Figure 3.8: (a).TER recorded by the CellZscope system of contact co-culture at 8
days (black), contact co-culture at 6 days (red) and monoculture at 10 days (blue). (b). Apparent permeability of contact co-culture at 8 days (black), contact co-culture at 6 days (red) and monoculture at 10 days (blue)………103
Figure 3.9: (a).TER recorded by the CellZscope system of contact co-culture at 8
days (black), contact co-culture at 6 days (red) and monoculture at 10 days (blue). (b). Apparent permeability of contact co-culture at 8 days (black), contact co-culture at 6 days (red) and monoculture at 10 days (blue)………..104
Figure 3.10: (a).TER recorded by the CellZscope system of contact co-culture at 8
days (black), no contact co-culture at 8 day (red) and monoculture conditioned at 8 days (blue). (b). Apparent permeability of contact co-culture at 8 days (black), no contact co-culture at 8 days (red) and monoculture conditioned at 8 days (blue)….105
Figure 3.11: Actin staining by phalloidin examined by fluorescence microscopy.
Nuclei were counterstained with DAPI. (a) Control of HBMEC cultured in monoculture in well. (b). HBMEC cultured in contact co-culture. (c) HBMEC cultured in non contact co-culture. (d). HBMEC cultured in monoculture with HA’s conditioned media. ………106
Figure 3.12: Schedule organization of the HBMEC experimentation 4. (a).
Establishment of endogenous extracellular matrices derived from HBMEC and HA, adapted from experimental cell research, Hartmann C et al., [2]. (b). Organization of the experiment………107
19
Figure 3.13: (a).TER recorded after deposition of endogenous extracellular matrix by
the CellZscope system of monoculture conditioned (black), and contact co-culture (red). (b). Apparent permeability of monoculture conditioned (black), and contact co-culture (red)………109
Figure 3.14: Details of the HBMEC experiment 5……….…………...110 Figure 3.15: (a).TER recorded by the CellZscope system of contact co-culture
supplemented with hydrocortisone at 8 days (black), contact co-culture at 8 days (red), no contact supplemented with hydrocortisone at 8 days (blue), no contact co-culture at 8 days (purple), monoco-culture conditioned supplemented with hydrocortisone at 8 days (green) and monoculture conditioned at 8 days (dark blue). (b). Apparent permeability of system of contact co-culture supplemented with hydrocortisone at 8 days (black), contact co-culture at 8 days (red), no contact supplemented with hydrocortisone at 8 days (blue), no contact co-culture at 8 days (purple), monoculture conditioned supplemented with hydrocortisone at 8 days (green) and monoculture conditioned at 8 day (dark blue)………111
Figure 3.16: Immunofluorescence of hCMEC/D3 of ZO-1 (red) and claudin 5
proteins (green) at day 2, 4 and 6……….…..115
Figure 3.17: Details organization of the hCMEC/D3 experimentation 2……....….116 Figure 3.18: (a).TER recorded by the CellZscope system of contact co-culture at 8
days (black), no contact co-culture at 8 days (red) and monoculture conditioned at 8 days (blue). (b). Apparent permeability of contact co-culture at 8 days (black), no contact co-culture at 8 days (red) and monoculture conditioned at 8 days (blue)…..117
Figure 3.19: Actin staining by phalloidin examined by fluorescence microscopy.
Nuclei were counterstained with DAPI. (a). hCMEC/D3 cultured in contact co-culture. (b) hCMEC/D3 cultured in non contact co-co-culture. (c). hCMEC/D3 cultured in monoculture with HA’s conditioned media………...118
Figure 3.20: Details organization of the hCMEC/D3 experimentation 3…..…..….119 Figure 3.21: (a).TER recorded by the CellZscope system of contact co-culture with
CN (black), contact co-culture with CN (red), no contact co-culture with CN (blue), no contact co-culture with HA (purple) and monoculture conditioned HA media (dark blue). (b). Apparent permeability of contact culture with CN (black), contact co-culture with CN (red), no contact co-co-culture with CN (blue), no contact co-co-culture with HA (purple) and monoculture conditioned HA media (dark blue)……..…….120
Table 3.7: Summarize TER and Papp data obtained on in vitro BBB model….….121 Figure 3.22: OECT transconductance response versus frequency, of the device alone
(black), the hCMEC/D3 cells co-cultured in contact with HA (blue), after scratch the filter (red)………...…123
20
Chapter 4: PEDOT:gelatin Composites Mediate Brain Endothelial Cell Adhesion Figure 4.1: XPS of PEDOT(TOS) top and PEDOT(TOS):gelatin (bottom) films…134
Table 4.S1: XPS of PEDOT (TOS) films………..134
Figure 4.2: NanoSIMS of PEDOT(TOS):gelatin films. Panels A, B and C show
elemental analysis for nitrogen, carbon and sulphur respectively………..…………135
Figure 4.3: Immunofluorescence images of substrates stained with anti-gelatin
antibodies (red). (A) PEDOT(TOS), (B) gelatin coated on well, (C) PEDOT(TOS) + gelatin, and (D) PEDOT(TOS):gelatin. Scale bar = 100 µm……….136
Figure 4.4: CVs of PEDOT(TOS), PEDOT (TOS): gelatin 1 : 1 and
PEDOT(TOS):gelatin 1 : 2 in 0.05 M NaTOS, pH 6.9 at 20 mV s-1……….137
ESI, Figure 4. 1: SEM of PEDOT(TOS) and PEDOT(TOS):gelatin………138 Table 4.1: Contact angles and roughness values (obtained from AFM measurements)
for PEDOT(TOS) and PEDOT(TOS) composite films. Data presented are mean SD, n = 3………...……139
Figure 4.5: Initial adhesion (1) and viability (2) of BBCECs observed 3 hours and 5
days after seeding on 96-well plates ± polymer composite coating. Wells are as follows: (A) well, (B) PEDOT(TOS), (C) gelatin, (D) BSA, (E) PEDOT(TOS) + gelatin, (F) PEDOT(TOS) + BSA, (G) PEDOT(TOS):gelatin, and (H) PEDOT(TOS):BSA. For the initial adhesion study images were taken by phase contrast microscopy. For viability assays, the live cells are stained with calcein-AM (green) and dead cells are stained with propidium iodide (red). Scale bar = 50 µm..140
ESI, Figure 4.2: water uptake………...……….141 Figure 4.6: Viability of BBCECs grown on (1) gelatin, (2) well, (3) BSA, (4)
PEDOT(TOS), (5) PEDOT(TOS) + gelatin (6) PEDOT(TOS) + BSA, (7) PEDOT(TOS):gelatin, and (8) PEDOT(TOS):BSA. Gelatin represents the positive control and is used to determine 100% viability………...……….142
Chapter 5: Development of an in vitro Model of the Blood Brain Barrier Integrated with the OECT
Figure 5.1: Schematic of the fabrication process for the OECT………...…………150
Figure 5.2: (a). Schematic of the OECT at Vg=0. PEDOT:PSS conducting polymer is
21 biological media (in pink). (b) At Vg > 0, the electric field push the positive ions from the media into the PEDOT:PSS. The measured source drain current (IDS) is thus
decreased. (c). Pictures of the OECT made on a 3 x 1 inches glass substrates. A dedicated 3D printed holder with embedded pogo pin was used to probe the OECTs………153
Figure 5.3: Electrical modeling of the OECT with and without cell layer…..……154 Figure 5.4: OECT frequency response. (a) Monitoring of frequency, without cells
(purple), with cells (black), on addition of 40mM of EGTA (red), on addition of 0.25% of trypsin (blue). (b) Table of frequency cut off values………..……..156
Figure 5.5: Light microscope images of device at day 8 (a). without h CMEC/D3
cells (b). with healthy h CMEC/D3 cells (c). after EGTA (d). after Trypsin………157
Figure 5.6: Immunofluorescence of proteins in BBB monolayer upon exposure to
EGTA. (a) Monolayers were exposed to 40mM of EGTA for and then stained with antibodies against apical junction proteins. (b) Monolayers non exposed to EGTA………...……..158
Figure 5.7: TER of h CMEC/D3 cells and the filter alone using the CellZscope at day
8 (N=3). (a) TER at day 7 for monoculture (red), co culture with neuron (blue) and without cells (black). (b) Table of TER values………..161
Figure 5.8: OECT frequency response at day 8. (a) Monitoring of frequency, without
cells (black), in monoculture condition (red), in co culture with neuron (blue). (b) Table of frequency cut off values……….162
22 École Nationale Supérieure des Mines
de Saint-Étienne NNT : 2014 EMSE 0753
Manuelle BONGO
Integration of an in vitro blood brain barrier model with organic
electrochemical transistors
Speciality:
BioelectronicsKeywords:
Blood Brain Barrier, Integrity, OECTAbstract:
In biological systems many tissue types have evolved a barrier function to selectively allow the transport of matter from the lumen to the tissue beneath; one example is the Blood Brain Barrier (BBB). The BBB protects the brain from the blood and maintains homeostasis of the brain microenvironment, which is crucial for neuronal activity and function. Characterization of the BBB is very important as its disruption or malfunction is often indicative of toxicity/disease. Though the number of published papers in the field of in vitro BBB has multiplied in recent years, the validity of the models used is still a subject of debate.
The advent of organic electronics has created a unique opportunity to interface the worlds of electronics and biology, using devices such as the Organic ElectroChemical Transistor (OECT), which provide a very sensitive way to detect minute ionic currents in an electrolyte as the transistor amplifies the gate current.
In this study, we test three different type of BBB in order to develop a stable BBB model. We optimize the adhesion of brain endothelial cell on OECT conducting polymer. We show the integration of OECTs with immortalized human cerebral microvascular endothelial cells as a model of human blood brain barrier, and demonstrate that the barrier tissue function can be detected. Moreover, by this technique, a disruption in the barrier (e.g. caused by a toxic compound) is assessed electrically through a measurement of the drain current.
23 Results show the successful development and validation of an in vitro BBB model. Dynamic monitoring of the barrier properties of the BBB barrier tissue was possible using the OECT.
24 École Nationale Supérieure des Mines
de Saint-Étienne NNT : 2014 EMSE 0753
Manuelle BONGO
Intégration d’un model in vitro de barrière hémato-encéphalique
avec des transistors organiques électrochimiques.
Spécialité:
BioélectroniqueMots clefs :
Barrière hémato-encéphalique, intégrité, OECTRésumé :
Dans les systèmes biologiques, les barrières tissulaires permettent le transport sélectif de molécules du sang au tissu approprié. Un exemple de barrière tissulaire est la barrière hémato-encéphalique (BHE). La BHE protège le cerveau du sang et maintient l'homéostasie du microenvironnement du cerveau, ce qui est essentiel à l'activité et à la fonction neuronale. La caractérisation de cette BHE est importante, car un dysfonctionnement de cette barrière est souvent révélateur de toxicité ou de maladie. Bien que le nombre d'articles publiés dans le domaine du développement et de la caractérisation de la BHE ait été multiplié ces dernières années, la validité des modèles utilisés est encore un sujet de débat.
L'avènement de l'électronique organique a créé une occasion unique pour coupler les mondes de l'électronique et de la biologie, à l'aide de dispositifs tels que le transistor électrochimique organique (OECT). OECT constitue un outil très sensible et économique pour diagnostiquer l’intégrité d’une barrière tissulaire.
Dans cette étude, nous avons tout d’abord développé trois différents modèles de BHE. Nous avons optimisé l’adhésion des cellules endothéliales cérébrales sur la matière active du transistor. Nous avons ainsi pu établir l'intégration des OECTs avec des cellules immortalisées humaines micro vasculaires cérébrales endothéliales (h CMEC/D3) en tant que modèle in vitro de BHE. Nous avons démontré que la fonction de tissu de la BHE peut être détectée en utilisant cette nouvelle technique. En outre, par cette technique, une perturbation de la barrière (par exemple, provoquée par un composé toxique) pourra être détectée électriquement au moyen d'une mesure de courant.
25
Aim of Thesis
The Blood Brain Barrier (BBB) is a highly selective membrane which separates the peripheral blood and the central nervous system (CNS). This barrier greatly restricts the passage of almost every compound into the brain. However some pathogen or toxin can enter and cause brain dysfunction. A variety of techniques are used to assess
in vitro BBB models, including immunofluorescence staining of proteins related to
BBB function, permeability assays and measurements of TER. The aim of these measurements is twofold: 1. To assess the accuracy or physiological relevance of a model under development, and 2. For use in diagnostics for determining compounds/pathogens that disrupt the barrier function of the BBB. Several different
in vitro BBB models have been developed however the experimental format of most
models does not allow for high throughput screening to access barrier integrity.
Current biological methods for evaluating barrier property are often expensive and time consuming. Electronic devices like the OECT create an opportunity to generate a low cost technique, both rapid and adaptable to high throughput screening methods for measuring barrier tissue integrity. Importantly, the transistor geometry permits to get an inherent amplification resulting in much more sensitive device.
The aim of this thesis is to integrate the barrier function of BBB with the ability of OECTs to detect minute ionic currents in order to assess barrier integrity. We first try to develop a stable BBB model using human brain endothelial cells. Then we combine the OECT with live BBB cell layers, thereby creating a device that will allow the evaluation of barrier properties in in vitro BBB models and the future detection of pathogens and toxins.
26
Chapter 1
Introduction to OECT for
Biological Applications
27 This first chapter is a description of the state of art of the function and the properties of the OECT. Here we describe the configuration and the operational principle of the device. We demonstrate the possibility to integrate the OECT device with biological elements and the multiple advantages of this device for biological sensing.
In this chapter, my role was to describe the general consideration of the OECT and the application in biology and more specifically in the monitoring cellular integrity.
This chapter corresponds to a review in preparation:
Strakosas, Xenofon, Bongo, Manuelle and Owens, Roisin.M. OECT for biological
applications. APL Materials's special topic on Biomaterials and Bioelectronics to be
28
1.1 The Organic Electrochemical Transistor
1.1.1 General considerations
The coupling of organic electronics with biology is an emerging and continuously growing field [1]. The motivation for organic bioelectronics is to address and anticipate the current and future diagnostic and therapeutic needs of the biomedical community [2]. These needs include detecting low concentrations of biological analytes, low amplitude brain activity, and pathogens, as well as improving compatibility with the biological environment [3]. Electrical methods for biological sensing are considered advantageous, in particular due to the fact that they are label-free, not requiring expensive and time consuming techniques involving fluorophores or chromophores (optical methods). Current diagnostic approaches using electrical sensors involve electrochemical biosensors, passive metal electrodes, and/or large scale integrated systems, in which the operating principle is based on redox reactions, changes in the local potential or impedance. However, for electrochemical sensors and passive recording sites for electrophysiology the biological signals are often challenging to record and require further amplification to become detectable, necessitating a push towards more active, sensitive and biocompatible devices [4]. A promising technology that has the potential to overcome such limitations and respond to these specific requirements is the organic electrochemical transistor (OECT).
Figure 1.1: The organic electrochemical transistor: a. schematic cross-section of an
OECT b. PEDOT:PSS structure. (a, b reproduced from [5], with permission from [Nature Publishing Group]) c. Ionic circuit of an OECT (c reproduced from [6], with permission from [Wiley-VCH ]).
29
1.1.2
Configuration
The OECT, first reported by White et al.,[7] is a three terminal device in a transistor configuration (source, gate, and drain) (figure 1a). The source and drain are connected by an organic conducting material in which an electronic current is generated (Id) in response to a potential difference. A variable potential at the gate controls the magnitude of the drain current (Id) by doping and de-doping the channel.
The OECT belongs to a broader class of transistors called electrolyte gated transistors (EGTs), in which the electrolyte is an integral part of the device [8]. This property makes the EGT compatible with aqueous environments. Apart from OECTs, a major subclass of the EGT is the electrolyte gated organic field effect transistor (EGOFET) [9], which has also been used as a diagnostic tool [10]. The difference between OECTs and EGOFETs lies in the interface between the channel and the electrolyte [11]. Specifically, in EGOFETs the ions of the electrolyte create an electrical double layer (EDL) with the charges (electrons/holes) of the channel. In contrast, in OECTs, ions from the electrolyte can penetrate the whole bulk of the polymeric channel. This key difference enables the OECT to exhibit high amplification properties in sub-volt operation regimes, preventing electrolysis, and extending operating times necessary for in-vitro and in-vivo applications [5]. The latter affords high sensitivity sensing for a wide spectrum of applications without additional amplification.
1.1.3 Advantages
The OECT offers a unique set of advantages for biomedical tools. One notable advantage includes adaptability to a wide variety of fabrication methods, from simple to complex; OECTs have been fabricated using low-cost printing techniques, [12] and exhibit high stability, high current modulation and fast response [13]. Simple, planar, all Poly 3-4 EthyleneDiOxyThiophene Polystyrene sulfonate (PEDOT:PSS) transistors on the macroscale have been shown to be capable of detecting glucose levels that exist in human saliva[14, 15]. For more challenging applications, OECTs are equally compatible with ongoing miniaturization techniques to the micro-scale, necessitated for the fabrication of high density electrode arrays for better interfacing with single neurons [16], integration with microfluidics for detection of multiple analytes [17], and lab on chip technologies [17b]. The use of robust and versatile organic materials has also facilitated the fabrication of conformal OECTs (figure 1.2a) for non-invasive, long term, continuous recordings [18]. Additionally, OECTs have been integrated with natural and synthetic fibers for fully integrated sensors and
30 wearable circuits compatible with human skin [19]. Although OECTs could be fabricated using a variety of organic conducting materials including small molecules, graphene or nanotubes, the majority of OECTs have been fabricated with conducting polymers (CPs) as active materials in the channel.
1.1.4 Conducting Polymers
CPs, first discovered in 1976 by Alan MacDiarmid, Hideki Shirakawa and Alan Heeger, exhibit a wide spectrum of desired characteristics [20]. Of particular interest to biomedical applications, they exhibit mixed conductivity; ionic and electronic. Some of the first applications of CPs in the biomedical arena, were their use as coatings on metal electrodes, where they were shown to improve recordings of brain activity by lowering the impedance of the electrode [14, 21]. CPs are chemically tuneable, and can be designed according to the needs of each application. For instance, CPs have been designed to entrap enzymes and mediators [22]. Direct electrical connection of enzymes to electrodes has been explored, using polyelectrolytes with redox active groups, and conducting polymers [23]. Electrochemical biosensors have enlisted these types of CPs to improve stability and sensitivity. Finally, CPs have been shown repeatedly to be biocompatible, hosting a wide variety of cell types [24]. Part of their compatibility with live cells, may be due to the fact that these polymeric materials are oxide-free, resulting in a closer interaction with cells hosted on their surface possibly facilitating adhesion and promoting ionic interactions [24b,25]. Other advantages of CPs that will be highlighted below include their optical transparency and their mechanical flexibility akin to tissue, providing benefits for tissue engineering.
A well-studied and widely used CP is poly(3,4-ethylenedioxythiophene) doped with poly(styrene sulfonate) (PEDOT:PSS). PEDOT:PSS is a p-type conducting polymer, in which the negative charge of PSS is compensated by a hole in the PEDOT backbone (figure 1.1b). This conducting polymer exhibits high electronic conductivities, with typical conductivity values of commercially available PEDOT:PSS reaching approximately 1000 S/cm. Furthermore, PEDOT:PSS shows high ionic conductivities: ionic mobilities for small ions migrating in PEDOT:PSS can reach values that exist in dilute electrolytes [26]. Indeed, a novel class of devices based on PEDOT:PSS have been reported, which have ions as their main charge carrier (Iontronics), with subsequent development of ion transistors and ion pumps demonstrated for delivery of ions, neurotransmitters and other small molecules [27]. The combined high ionic and electronic mobilities are key reasons for PEDOT:PSS emerging as the champion material for devices such as OECTs.
31
1.1.5 Operational Principle
Apart from choosing the optimal materials for an OECT, it is important to understand its operating principle. Bernards and Malliaras [6], have reproduced the transient, the speed with which the transistor responds to external changes such as biological signals, and the steady state behavior of an OECT by modeling it as an ionic and electronic circuit (figure 1.1c). The electronic circuit refers to the current flux of holes inside the channel and the changes of its magnitude upon de-doping. The ionic circuit (figure 1.1c), has been modeled as a capacitor and resistor in series. For simplicity, the capacitance of the gate has been neglected. The resistor in the model refers to the ionic strength of the electrolyte and the capacitor to the amount of ions that can be stored in the bulk of the channel. The model explains the operating principle of the OECT which is affected by the interplay between the ionic and electronic currents. Thus, an understanding of the parameters that influence these properties must be taken into consideration and tuned according to the specific applications at hand. These parameters include: the material / size of the gate, the resistance of the electrolyte, and the size and geometry of the channel. Once defined, optimal parameters must be weighed with considerations such as fabrication - for instance, micrometer scale transistors exhibit fast responses which are stable for higher frequencies, making them suitable and more specific for fast biological events (such as neuronal signaling), however, scaling down the dimensions requires somewhat complex lithographic techniques (figure 1.2a).
32
Figure 1.2: Robust micrometer scale, high amplification OECTs: a. an array of
OECTs on a thin flexible substrate: scale bar = 1 cm b. the array is extensively crumpled c. transfer characteristics of device before (red) and after (blue) crumpling b. transconductance and time response for devices before (red) and after (blue) crumpling. (a, b, c reproduced from [5], with permission from [Nature Publishing Group])
Arguably, the most important device property of the OECT is related to its amplification properties. High amplification is a common necessity for unraveling biological information; to increase signal to noise ratio and to lower detection limits thus increasing sensitivity. For example, in electrophysiology it is important to record brain activity that has a wide spectrum of frequencies and amplitudes. The potential difference of this activity is on the order of a few micro volts, and by taking advantage of its inherent transistor properties, OECTs can be used to locally amplify the signal [28]. The efficiency of the amplification can be measured by the transconductance, which is defined as 𝑔𝑚 =∆𝑉𝛥𝐼𝑑
𝑔. Therefore, the higher the value of the
transconductance, the better the gain. Khodagholy et al.,[5] have shown that the OECT reaches transconductance values in the miliSiemens range, outperforming traditional and other organic transistors (figure 1.2b), an impressive feat for a device fabricated based with solution processed materials at room temperature. Furthermore, as shown in figure 2b and c, the transconductance and the time characteristics are not affected even after extensive use and harsh manipulation. Finally, by carefully selecting and varying geometrical characteristics such as channel length, width and thickness, Rivnay et al.,[29] have engineered OECTs with peak transconductance values at zero gate voltage. This is of importance in many applications where very
33 low voltages are required, for example when cell or lipid bilayer integrity has to be maintained over an extended period of biasing [30]. Moreover, omitting additional biasing facilitates simpler integration to circuits and recording systems, something desirable for lab on chip applications. From the above, we see how individual properties and characteristics of an OECT may be tuned for a broad range of biological applications.
1.2 Applications in Biology
1.2.1 OECTs coupled with biological moieties for sensing.
In this section work related to the coupling of OECTs with a variety of different biological molecules and macromolecules will be discussed, including ions, proteins (enzymes and antibodies), lipids and nucleic acids. These devices have been reported for applications in basic research but particularly as new alternatives for low-cost diagnostics.
OECTs as ion sensors
The electrolyte is an integral part of an OECT; variations in its ionic concentration affect the device properties. Therefore, sensing of ions, which is of great importance in healthcare diagnostics, has been possible with the OECT. Lin et al.,[31] have shown that altering the ionic concentration of an electrolyte affects its channel current (Id). Figure 1.3a shows a transfer curve, which is a function of the drain current with respect to the sweep of the gate voltage, for a range of concentrations of a potassium chloride (KCl) electrolyte. The transfer characteristics display the decrease in Id with increase of the Vg, with a shift of these curves to lower values of Vg when the ionic concentration increases. This behavior can be simply explained by the ionic circuit in figure 1c; the higher the ionic concentration in the electrolyte the higher the ionic charge at the interface between PEDOT:PSS. So, the increase of the charge shifts the effective gate voltage (Vg,eff) (constituting the potential drop to the channel) to higher values and in turns de-dopes the channel. Apart from changes in electrolytes concentration, changes in electrolyte composition can shift the Vg,eff in the OECT, a principle used by Tarabella et al.,[32] for sensing liposomes and micelle formation of cetyltrimethylammonium bromide (CTAB).
34
Figure 1.3: OECTs used as ion sensors a. Transfer characteristics of an OECT for
different concentrations of KCl solutions (Vd = -0.1 V). (reproduced from [31], with permission from [ACS Publications]). b. Wheatstone bridge circuit diagram. c. The peak-to-peak voltage difference as a function of concentration difference of NaCl solution, inset curve shows the raw data. (b, c reproduced from [33], with permission from [American Institute of Physics]). d. schematic of Ion-selective OECT. e. Calibration curves (Id, Vg,m vs concentration) of pure KCl and NaCl solutions performed using ion selective OECT (IS-OECT). (d, e reproduced from [34], with permission from [Wiley Online Library]).
35 Svensson et al.,[33] have integrated OECTs in circuits for ion sensing in order to improve the sensitivity. In this case, two transistors were connected with two resistors in a Wheatstone bridge circuit configuration (figure 1.3b). After application of a small constant drain voltage the transistors operate in a resistive mode and the potential difference (Vdiff) between the two transistors is continuously recorded. By additional application of a sinusoidal gate voltage of 10 Hz, a change of the resistance in the electrolyte and thus the Vdiff can be measured. When the ionic concentration of the electrolyte in both transistors is the same, no potential difference is observed. By changing however the concentration of the electrolyte in the second transistor, a potential difference is observed. In figure 1.3c (inset; raw data), we see how the phase of the potential between the two transistors shifts versus the concentration difference in the two electrolytes.
The importance of sensing specific ions has prompted the development of ion-selective OECT sensors (IS-OECT). Sessolo et al.,[34] as well as Mousavi et al.,[35] have combined OECTs with polymeric membranes that permit the passage of specific ions. In figure 1.3d the lay-out of an ion-selective OECT is shown. Briefly, a polyvinylchloride (PVC) based potassium-selective membrane was placed between a gel electrolyte and the electrolyte of interest, separating the channel from the gate of the OECT. By increasing the concentration of the electrolyte, a decrease in the drain current which is proportional to the [K+] is observed. This is attributed to the increase number of K+ ions penetrating the channel and de-doping it, or to the decrease of the electrolyte resistance. Figure 1.3e shows the calibration curve of drain current and effective membrane voltage versus ion concentration for pure KCl and NaCl solutions. The sensitivity to K+ ions is an order of magnitude higher than that of Na+ ions, and this confirms the ion selectivity of the membrane. In a similar configuration, Bernards et al.,[30] have placed a lipid bilayer with and without embedded proteins, in this case bacterial gramicidin ion pores, selective for monovalent cations, as a selective membrane instead of a polymeric one. In the absence of gramicidin no Id modulation was observed when a gate potential was applied, whereas in the presence of gramicidin channels a clear modulation was observed in the presence of gramicidin, although only in the presence of KCl, not in the presence of CaCl2,
demonstrating the selectivity of the bilayer lipid membrane. A 1V pulse was demonstrated to disrupt the bilayer membrane, underlying the importance of operation at low voltages when interfacing with biological systems.
OECTs as enzymatic sensors
One of the first applications of the OECT for interfacing with biology was as an enzymatic sensor [36]. The operating principle of an OECT enzymatic sensor involves either a change in a local pH upon oxidation of species or transfer of electrons to the gate of the device (figure 1.4a). By measuring changes in pH Nishizawa et al., have used polypyrrole based OECTs to sense penicillin [37]. They

![Figure 2.4: Diagram of the different transport processes involved in the permeability of brain capillaries (from Nature Reviews Neuroscience, Abbott et al., [49])](https://thumb-eu.123doks.com/thumbv2/123doknet/11603981.300703/66.892.62.770.476.989/diagram-different-transport-processes-involved-permeability-capillaries-neuroscience.webp)
![Figure 2.9: Schematic of planar OECT device which consists of a PEDOT:PSS channel and gate patterned onto a glass slide (from submitted Advanced Materials, Ramuz et al., [88])](https://thumb-eu.123doks.com/thumbv2/123doknet/11603981.300703/77.892.160.751.706.941/figure-schematic-consists-channel-patterned-submitted-advanced-materials.webp)