HAL Id: hal-02427563
https://hal.inria.fr/hal-02427563
Preprint submitted on 3 Jan 2020
HAL is a multi-disciplinary open access
archive for the deposit and dissemination of
sci-entific research documents, whether they are
pub-lished or not. The documents may come from
teaching and research institutions in France or
abroad, or from public or private research centers.
L’archive ouverte pluridisciplinaire HAL, est
destinée au dépôt et à la diffusion de documents
scientifiques de niveau recherche, publiés ou non,
émanant des établissements d’enseignement et de
recherche français ou étrangers, des laboratoires
publics ou privés.
Computing Vertex-Vertex Dissimilarities Using Random
Trees: Application to Clustering in Graphs
Kevin Dalleau, Miguel Couceiro, Malika Smail-Tabbone
To cite this version:
Kevin Dalleau, Miguel Couceiro, Malika Smail-Tabbone. Computing Vertex-Vertex Dissimilarities
Using Random Trees: Application to Clustering in Graphs. 2019. �hal-02427563�
Random Trees:
Application to Clustering in Graphs
?Kevin Dalleau1, Miguel Couceiro1, and Malika Smail-Tabbone1
Universite de Lorraine, CNRS, Inria, LORIA, F-54000 Nancy, France {kevin.dalleau,miguel.couceiro, malika.smail}@loria.fr
Abstract. A current challenge in graph clustering is to tackle the issue of complex networks, i.e, graphs with attributed vertices and/or edges. In this paper, we present GraphTrees, a novel method that relies on ran-dom decision trees to compute pairwise dissimilarities between vertices in a graph. We show that using different types of trees, it is possible to ex-tend this framework to graphs where the vertices have attributes. While many existing methods that tackle the problem of clustering vertices in an attributed graph are limited to categorical attributes, GraphTrees can handle heterogeneous types of vertex attributes. Moreover, unlike other approaches, the attributes do not need to be preprocessed. We also show that our approach is competitive with well-known methods in the case of non-attributed graphs in terms of quality of clustering, and provides promising results in the case of vertex-attributed graphs. By extending the use of an already well established approach – the random trees – to graphs, our proposed approach opens new research directions, by lever-aging decades of research on this topic.
Keywords: Graph clustering · Attributed graph· Random tree · Dis-similarity · Heterogeneous data
1
Introduction
Identifying community structure in graphs is a challenging task in many applica-tions: computer networks, social networks, etc. Graphs have an expressive power that enables an efficient representation of relations between objects as well as their properties. Attributed graphs where vertices or edges are endowed with a set of attributes are now widely available, many of them being created and cu-rated by the semantic web community. While these so-called knowledge graphs 1 contain a lot of information, their exploration can be challenging in practice. In particular, common approaches to find communities in such graphs rely on rather complex transformations of the input graph.
?Funded by the RHU FIGHT-HF (ANR-15-RHUS-0004) and the Region Grand Est (France).
1
In this paper, we propose a decision tree based method that we call Graph-Trees (GT) to compute dissimilarities between vertices in a straightforward man-ner. The paper is organized as follows. In Section 2, we briefly survey related work. We present our method in Section 3, and we discuss its performance in Section 4 through an empirical study on real and synthetic datasets. In the last section of the paper, we present a brief discussion of our results and state some perspectives for future research.
Main contributions of the paper:
1. We propose a first step to bridge the gap between random decision trees and graph clustering and extend it to vertex attributed graphs (Subsection 4.1). 2. We show that the vertex-vertex dissimilarity is meaningful and can be used
for clustering in graphs (Subsection 4.2).
3. Our method GT applies directly on the input graph without any preprocess-ing, unlike the many community detection in vertex-attributed graphs that rely on the transformation of the input graph.
2
Related work
Community detection aims to find highly connected groups of vertices in a graph. Numerous methods have been proposed to tackle this problem [8] [1] [24]. In the case of vertex-attributed2graph, clustering aims at finding homogeneous groups of vertices sharing (i) common neighbourhoods and structural properties, and (ii) common attributes. A vertex-attributed graph is a structure G = (V, E, A), where
– V = {v1, v2, . . . , vn} is the set of vertices of G,
– E ⊆ V × V is the set of edges between the vertices of V , and
– A = {x1, x2, . . . , xn} is the set of feature tuples, where each xi represents the attribute value of the vertex vi.
In the case of vertex-attributed graphs, the problem of clustering refers to finding communities (i.e., clusters), where vertices in the same cluster are densely connected, whereas vertices that do not belong to the same cluster are sparsely connected. Moreover, as attributes are also taken into account, the vertices in the same cluster should be similar w.r.t. attributes.
In this section, we briefly recall existing approaches to tackle this problem.
Weight-based approaches The weight-based approach consists in transform-ing the attributed graphs in weighted graphs. Standard clustertransform-ing algorithms that focus on structural properties can then be applied.
The problem of mapping attribute information into edge weight have been considered by several authors. Neville et al. define a matching coefficient [20] as
2
To avoid terminology-related issues, we will exclusively use the terms vertex for graphs and node for random trees throughout the paper.
a similarity measure S between two vertices vi and vj based on the number of attribute values the two vertices have in common. The value Svi,vj is used as the
edges weight between vi and vj. Although this approach leads to good results using Min-Cut [15], MajorClust [26] and spectral clustering [25], only nominal attributes can be handled. An extended matching coefficient was proposed in [27] to overcome this limitation, based on a combination of normalized dissimilarities between continuous attributes and increments of the resulting weight per pair of common categorical attributes.
Optimization of quality functions A second type of methods aim at finding an optimal clustering of the vertices by optimizing a quality function over the partitions (clusters).
A commonly used quality function is modularity [21], that measures the den-sity differences between vertices within the same cluster and vertices in different clusters. However, modularity is only based on the structural properties of the graph. In [6], the authors use entropy as the quality metric to optimize between attributes, combined with a modularity-based optimization. Another method, recently proposed by D. Combe et al. [5], groups similar vertices by maximizing both modularity and inertia.
However, these methods suffer from the same drawbacks as any other mod-ularity optimization based methods in simple graphs. Indeed, it was shown by [17] that these methods are biased, and do not always lead to the best clustering. For instance, such methods fail to detect small clusters in graphs with clusters of different sizes.
Aggregated distance measures Another type of methods used to find com-munities in vertex-attributed graphs is to define an aggregated vertex-vertex distance between the topological distance and the symbolic distance. All these methods express a distance dvi,vj between two vertices vi and vj as dvi,vj =
αdT(vi, vj) + (1 − α)dS(vi, vj) where dT is a structural distance and dS is a dis-tance in the attribute space. These structural and attribute disdis-tances represent the two different aspects of the data. These distances can be chosen from the vast number of available ones in the literature. For instance, in [4] a combina-tion of geodesic distance and cosine similarities are used by the authors. The parameter α is useful to control the importance of each aspect of the overall similarity in each use case. These methods are appealing as once the distances between vertices are obtained, many clustering algorithms that cannot be ap-plied to structures such as graphs can be used to find communities.
Miscellaneous There is yet another family of methods that enable the use of common clustering methods on attributed graphs. SA-cluster [3,32] is a method performing the clustering task by adding new vertices. The virtual vertices rep-resent possible values of the attributes. This approach, although appealing by its simplicity, has some drawbacks. First, continuous attributes cannot be taken into
account. Cecond, the complexity can increase rapidly as the number of added vertices depends on the number of attributes and values for each attribute. How-ever, the authors proposed an improvement of their method named Inc-Cluster in [33], where they reduce its complexity.
Some authors have worked on model-based approaches for clustering in vertex-attributed. In [29], the authors proposed a method based on a bayesian proba-bilistic model is used to perform the clustering of vertex-attributed graphs, by transforming the clustering problem into a probabilistic inference problem. Also, graph embeddings can be used for this task of vertex-attributed graph clustering. Examples of these techniques include node2vec [13] or deepwalk [23], and aim to efficiently learn a low dimensional vector representation of each vertex. Some authors focused on extending vertex embeddings to vertex-attributed networks [11] [30] [14].
In this paper, we take a different approach and present a tree-based method enabling the computation of vertex-vertex dissimilarities. This method is pre-sented in the next section.
3
Method
Previous works [7],[28] have shown that random partitions of data can be used to compute a similarity between the instances. In particular, in Unsupervised Extremely Randomized Trees (UET), the idea is that all instances ending up in the same leaves are more similar to each other than to other instances. The pairwise similarities s(i, j) are obtained by increasing s(i, j) for each leaf where both i and j appear. A normalisation is finally performed when all trees have been constructed, so that values lie in the interval [0, 1]. Leaves, and, more generally, nodes of the trees can be viewed as partitions of the original space. Enumerating the number of co-occurrences in the leaves is then the same as enumerating the number of co-occurrence of instances in the smallest regions of a specific partition.
So far, this type of approach has not been applied to graphs. The intuition behind our proposed method, GT, is to leverage a similar partition in the ver-tices of a graph. Instead of using the similarity computation that we described previously, we chose to use the mass-based approach introduced by Ting et al. [28] instead. The key property of their measure is that the dissimilarity between two instances in a dense region is higher than the same interpoint dissimilarity between two instances in a sparse region of the same space. One of the inter-esting aspects of this approach is that a dissimilarity is obtained without any post-processing.
Let H ∈ H(D) be a hierarchical partitioning of the original space of a dataset D into non-overlapping and non-empty regions, and let R(x, y|H) be the smallest local region covering x and y with respect to H. The mass-based dissimilarity me estimated by a finite number t of models – here, random trees – is given by
the following equation: me(x, y|D) = 1 t t X i=1 ˜ P (R(x, y|Hi)) (1) where ˜P (R) =|D|1 P
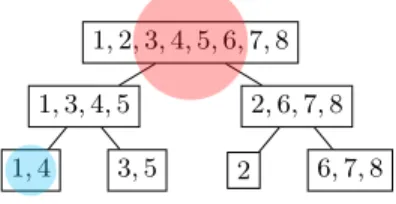
z∈D1(z ∈ R). Fig. 1 presents an example of a hierarchical partition H of a dataset D containing 8 instances. These instances are vertices in our case. For the sake of the example, let us compute me(1, 4) and me(1, 8). We have me(1, 4) = 18(2) = 0.25, as the smallest region where instances 1 and 4 co-appear contains 2 instances. However, me(1, 8) = 18(8) = 1, since instances 1 and 8 only appear in one region of size 8, the original space. The same approach
1, 2, 3, 4, 5, 6, 7, 8 1, 3, 4, 5
1, 4 3, 5
2, 6, 7, 8 2 6, 7, 8
Fig. 1. Example of partitioning of 8 instances in non-overlapping non-empty regions using a random tree structure. The blue and red circles denote the smallest nodes (i.e, regions) containing vertices 1 and 4 and vertices 1 and 8, respectively.
can be applied to graphs.
Our proposed method is based on two steps: (i) obtain several partitions of the vertices using random trees, (ii) use the trees to obtain a relevant dissimilarity measure between the vertices. The Algorithm 1 describes how to build one tree, describing one possible partition of the vertices. Each tree corresponds to a model of (1). Finally, the dissimilarity can be obtained using Equation 1.
The computation of pairwise vertex-vertex dissimilarities using Graph Trees and the mass-based dissimilarity we just described has a time complexity of O(t · Ψ log(Ψ ) + n2tlog(Ψ )) [28], where t is the number of trees, Ψ the maximum height of the trees, and n is the number of vertices. When Ψ << n, this time complexity becomes O(n2).
To extend this approach to vertex-attributed graphs, we propose to build a forest containing trees obtained by GT over the vertices and trees obtained by UET on the vertex attributes. We can then compute the dissimilarity between vertices by averaging the dissimilarities obtained by both types of trees.
In the next section, we evaluate GT on both real-world and synthetic datasets.
4
Evaluation
This section is divided into 2 subsections. First, we assess GT’s performance on graphs without vertex attributes (Subsection 4.1) . Then we present the
Algorithm 1: Algorithm describing how to build a random tree parti-tioning the vertices of a graph.
Data: A graph G(V, E), an uninitialized stack S
root node = V ; // The root node contains all the vertices of G vs = a vertex sampled without replacement from V ;
Vlef t= N (vs) ∪ {vs} ; //N (v) returns the set of neighbours of v Vright= V \ Vlef t;
Push Vlef tand Vright to S ; leaves = []; //leaves is an empty list while S is not empty do
Vnode= pop the last element of S; if |Vnode| < nminthen
Append Vnode to leaves; //node size in lower than nmin, it is a leaf node
end else
vs = a vertex sampled without replacement from Vnode; Vlef t= (Vnode∩ N (vs)) ∪ {vs};
Vright= Vnode\ Vlef t; Push Vlef tto S; Push Vright to S; end
end
return leaves;
performance of our proposed method in the case of vertex-attributed graphs (Subsection 4.2). An implementation of GT, as well as these benchmarks are available on https://github.com/jdalleau/gt.
4.1 Graph trees on simple graphs
We first evaluate our approach on simple graphs with no attributes, in order to assess if our proposed method is able to discriminate clusters in such graphs. This evaluation is performed on both synthetic and real-world graphs, presented Table 1.
Table 1. Datasets used for the evaluation of clustering on simple graphs using Graph-trees
Dataset # vertices # edges Average degree # clusters Football 115 1226 10.66 10 Email-Eu-Core 1005 25571 33.24 42 Polbooks 105 441 8.40 3 SBM 450 65994 293.307 3
The stochastic block models (SBM) graphs are synthetic graphs composed of k blocks of a user-defined size, that are connected by edges depending on a specific probability which is a parameter. The Football graph represents a net-work of American football games during a given season [12]. The Email-Eu-Core graph [31] [18] represents relations between members of a research institution, where edges represents communication between those members. We also use a random graph in our first experiment. This graph is an Erdos-Renyi graph [10] generated with the parameters n = 300 and p = 0.2. Finally, the PolBooks data [16] is a graph where nodes represent books about US politics sold by an online merchant and edges books that were frequently purchased by the same buyers.
Our first empirical setting aims to compare the differences between the mean intracluster and the mean intercluster dissimilarities. These metrics enable a comparison that is agnostic to a subsequent clustering method.
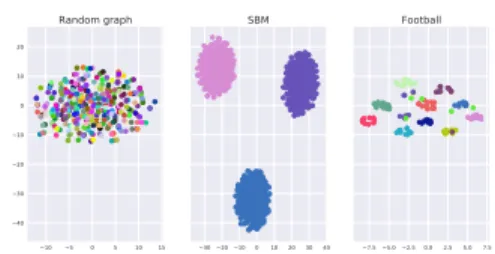
The mean difference is computed as follows. First, the arithmetic mean of the pairwise similarities between all vertices with the same label is computed, corresponding to the mean intracluster dissimilarity µintra. The same process is performed for vertices with a different label, giving the mean intercluster similarity µinter. We finally compute the difference ∆ = |µintra− µinter|. In our experiments, this difference ∆ is computed 20 times. ¯∆ denotes the mean of differences between runs, and σ its standard deviation. The results are presented Table 2. We observe that in the case of the random graph, ¯∆ is close to 0, unlike the graphs where a cluster structure exists. A projection of the vertices based on their pairwise dissimilarity obtained using GT is presented Figure 2.
Table 2. Mean difference between intercluster and intracluster similarities in different settings.
Dataset ∆¯ σ Random Graph 0.0003 0.0002 SBM 0.29 0.005 Football 0.25 0.002
We then compare the Normalized Mutual Information (NMI) obtained using GT with the NMI obtained using two well-known clustering methods on simple graphs, namely MCL [8] and Louvain [1]. N M I is a clustering quality metric when a ground truth is available. Its values lie in the range [0, 1], with a value of 1 being a perfect matching between the computed clusters and the reference one. The empirical protocol is the following :
1. Compute the dissimilarity matrices using GT, with a total number of trees ntrees= 200.
2. Obtain a 2D projection of the points using t-SNE [19] (k = 2). 3. Apply k-means on the points of the projection and compute the NMI. We repeated this procedure 20 times and computed means and standard devia-tions of the NMI.
Fig. 2. Projection of the vertices obtained using GT on (left) a random graph, (middle) an SBM graph (middle) and (right) the football graph. Each cluster membership is denoted by a different color. Note how in the case of the random graph, no clear cluster can be observed.
The results are presented Table 3. We compared the mean NMI using the t-test, and checked that the differences between the obtained values are statisti-cally significant.
We observe that our approach is competitive with the two well-known meth-ods we chose in the case of non-attributed graphs on the benchmark datasets. In one specific case, we even observe that Graph trees significantly outperforms state of the art results, on the SBM graphs. Since the dissimilarity computation is based on the method proposed by [28] to find clusters in regions of varying densities, this may indicate that our approach performs particularly well in the case of clusters of different size.
Table 3. Comparison of NMI on benchmark graph datasets. Best results are in bold-face.
Dataset Graph-trees Louvain MCL Football 0.923 (0.007) 0.924 (0.000) 0.879 (0.015) Email-Eu-Core 0.649 (0.008) 0.428 (0.000) 0.589 (0.012) Polbooks 0.524 (0.012) 0.521 (0.000) 0.544 (0.02) SBM 0.998 (0.005) 0.684 (0.000) 0.846 (0.000)
4.2 Graph trees on attributed graphs
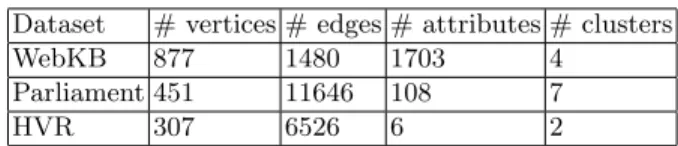
Now that we have tested GT on simple graphs, we can assess its performance on vertex-attributed graphs. The datasets that we used in this subsection are presented Table 4.
WebKB represents relations between web pages of four universities, where each vertex label corresponds to the university and the attributes represent the words that appear in the page. The Parliament dataset is a graph where the vertices represent french parliament members, linked by an edge if they cosigned
a bill. The vertex attributes indicate their constituency, and each vertex has a label that corresponds to their political party.
Table 4. Datasets used for the evaluation of clustering on attributed graphs using GT Dataset # vertices # edges # attributes # clusters
WebKB 877 1480 1703 4 Parliament 451 11646 108 7
HVR 307 6526 6 2
The empirical setup is the following. We first compute the vertex-vertex dis-similarities using GT, and the vertex-vertex disdis-similarities using UET. In this first step, a forest of trees on the structures and a forest of trees on the at-tributes of each vertex are constructed. We then compute the average of the pairwise dissimilarities. Finally, we then apply t-SNE and use the k-means algo-rithm on the points in the embedded space. We set k to the number of clusters, since we have the ground truths. We repeat these steps 20 times and report the means and standard deviations. During our experiments, we found out that preprocessing the dissimilarities prior to the clustering phase may lead to better results, in particular with Scikit learn’s [22] QuantileTransformer. This transfor-mation tends to spread out the most frequent values and to reduce the impact of outliers. In our evaluations, we performed this quantile transformation prior to every clustering, with nquantile= 10.
The NMI obtained after the clustering step are presented in Table 5.
Table 5. NMI using GT on the structure only, UET on the attributes only and GT+UET. Best results are indicated in boldface.
Dataset GT UET GT+UET WebKB 0.64 (0.07) 0.73 (0.08) 0.98 (0.01) HVR 0.58 (0.06) 0.58 (0.00) 0.89 (0.06) Parliament 0.65 (0.02) 0.03 (0.00) 0.66 (0.02)
We observe that for two datasets, namely WebKB and HVR, considering both structural and attribute information leads to a significant improvement in NMI. For the other dataset considered in this evaluation, while the attribute information does not improve the NMI, we observe that is does not decrease it either.
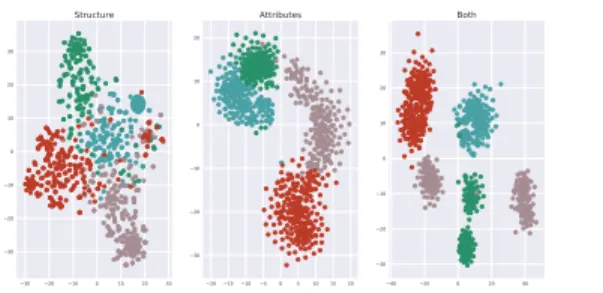
In Figure 3 we present the projection of the WebKB dataset, where we ob-serve that the structure and attribute information both bring a different view of the data, each with a strong cluster structure.
HVR and Parliament datasets are extracted from [2]. Using their proposed approach, they obtain an NMI of 0.89 and 0.78, respectively. Although the NMI
Fig. 3. Projection of the WebKB data based on the dissimilarities computed (left) using GT on structural data, (middle) using UET on the attributes data and (right) using the aggregated dissimilarity. Each cluster membership is denoted by a different color.
we obtained using our approach are not consistently better in this first assess-ment, the methods still seems to give similar results without any fine tuning.
5
Discussion and future work
In this paper, we presented a method based on the construction of random trees to compute dissimilarities between graph vertices, called GT. For vertex clustering purposes, our proposed approach is plug-and-play, since any clustering algorithm that can work on a dissimilarity matrix can then be used. Moreover, it could find application beyond graphs, for instance in relational structures in general.
Although the goal of our empirical study was not to show a clear superiority in terms of clustering but rather to assess the vertex-vertex dissimilarities obtained by GT, we showed that our proposed approach is competitive with well-known clustering methods, Louvain, and MCL. We also showed that by computing forests of graph trees and other trees that specialize in other types of input data, e.g, feature vectors, it is then possible to compute pairwise dissimilarities between vertices in attributed graphs.
Some aspects are still to be considered. First, the importance of the vertex attributes is dataset dependent and, in some cases, considering the attributes can add noise. Moreover, the aggregation method between the graph trees and the attribute trees can play an essential role. Indeed, in all our experiments, we gave the same importance to the attribute and structural dissimilarities. This choice implies that both the graph trees and the attribute trees have the same weight, which may not always be the case. Finally, we chose here a specific algorithm to compute the dissimilarity in the attribute space, namely, UET. The poor results we obtained for some datasets may be caused by some limitations of UET in these cases.
It should be noted that our empirical results depend on the choice of a specific clustering algorithm. Indeed, GT is not a clustering method per se, but a method
to compute pairwise dissimilarities between vertices. As other dissimilarity-based methods, this is a strength of the method we propose in this paper. Indeed, the clustering task can be performed using many algorithms, leveraging their respective strengths and weaknesses.
As a future work, we will explore an approach where the choice of whether to consider the attribute space in the case of vertex-attributed graphs is guided by the distribution of the variables or the visualization of the embedding. We also plan to apply our methods on bigger graphs than the ones we used in this paper.
References
1. Blondel, V.D., Guillaume, J.L., Lambiotte, R., Lefebvre, E.: Fast unfolding of com-munities in large networks. Journal of statistical mechanics: theory and experiment 2008(10), P10008 (2008)
2. Bojchevski, Aleksandar and G¨unnemann, S.: Bayesian Robust Attributed Graph Clustering: Joint Learning of Partial Anomalies and Group Structure (2018) 3. Cheng, H., Zhou, Y., Yu, J.X.: Clustering large attributed graphs: A balance
be-tween structural and attribute similarities. ACM Transactions on Knowledge Dis-covery from Data (TKDD) 5(2), 12 (2011)
4. Combe, D., Largeron, C., Egyed-Zsigmond, E., G´ery, M.: Combining relations and text in scientific network clustering. In: 2012 IEEE/ACM International Conference on Advances in Social Networks Analysis and Mining. pp. 1248–1253. IEEE (2012) 5. Combe, D., Largeron, C., G´ery, M., Egyed-Zsigmond, E.: I-louvain: An attributed graph clustering method. In: International Symposium on Intelligent Data Analy-sis. pp. 181–192. Springer (2015)
6. Cruz, J.D., Bothorel, C., Poulet, F.: Entropy based community detection in aug-mented social networks. In: 2011 International Conference on computational as-pects of social networks (CASoN). pp. 163–168. IEEE (2011)
7. Dalleau, K., Couceiro, M., Smail-Tabbone, M.: Unsupervised extremely random-ized trees. In: PAKDD. pp. 478–489. Springer (2018)
8. Dongen, S.: A cluster algorithm for graphs (2000)
9. Ehrlinger, L., W¨oss, W.: Towards a Definition of Knowledge Graphs. In: SEMAN-TiCS (Posters, Demos, SuCCESS) (2016)
10. Erd\Hos, P., R´enyi, A.: On the evolution of random graphs. Publ. Math. Inst. Hung. Acad. Sci 5(1), 17–60 (1960)
11. Fan, M., Cao, K., He, Y., Grishman, R.: Jointly Embedding Relations and Mentions for Knowledge Population. In: Proceedings of the International Conference Recent Advances in Natural Language Processing. pp. 186–191 (2015)
12. Girvan, M., Newman, M.E.J.: Community structure in social and biological net-works. Proceedings of the National Academy of Sciences 99(12), 7821–7826 (Jun 2002). https://doi.org/10.1073/pnas.122653799, http://www.pnas.org/cgi/doi/ 10.1073/pnas.122653799
13. Grover, A., Leskovec, J.: node2vec: Scalable feature learning for networks. In: Pro-ceedings of the 22nd ACM SIGKDD international conference on Knowledge dis-covery and data mining. pp. 855–864. ACM (2016)
14. Huang, X., Li, J., Hu, X.: Accelerated attributed network embedding. In: Proceed-ings of the 2017 SIAM international conference on data mining. pp. 633–641. SIAM (2017)
15. Karger, D.R.: Global cuts in RNC, and Other Ramifications of a Simple Min-Cut Algorithm. In: SODA. vol. 93, pp. 21–30 (1993)
16. Krebs, V.: Political books network. Unpublished, retrieved from Mark Newman’s website: www-personal. umich. edu/ mejn/netdata (2004)
17. Lancichinetti, A., Fortunato, S.: Limits of modularity maximization in community detection. Physical review E 84(6), 066122 (2011)
18. Leskovec, J., Kleinberg, J., Faloutsos, C.: Graph evolution: Densification and shrinking diameters. ACM Transactions on Knowledge Discovery from Data (TKDD) 1(1), 2 (2007)
19. Maaten, L.v.d., Hinton, G.: Visualizing data using t-SNE. Journal of machine learning research 9(Nov), 2579–2605 (2008)
20. Neville, J., Adler, M., Jensen, D.: Clustering relational data using attribute and link information. In: Proceedings of the text mining and link analysis workshop, 18th international joint conference on artificial intelligence. pp. 9–15. San Francisco, CA: Morgan Kaufmann Publishers (2003)
21. Newman, M.E.: Modularity and community structure in networks. Proceedings of the national academy of sciences 103(23), 8577–8582 (2006)
22. Pedregosa, F., Varoquaux, G., Gramfort, A., Michel, V., Thirion, B., Grisel, O., Blondel, M., Prettenhofer, P., Weiss, R., Dubourg, V.: Scikit-learn: Machine learn-ing in Python. Journal of machine learnlearn-ing research 12(Oct), 2825–2830 (2011) 23. Perozzi, B., Al-Rfou, R., Skiena, S.: Deepwalk: Online learning of social
represen-tations. In: Proceedings of the 20th ACM SIGKDD International conference on Knowledge discovery and data mining. pp. 701–710. ACM (2014)
24. Schaeffer, S.E.: Graph clustering. Computer science review 1(1), 27–64 (2007) 25. Shi, J., Malik, J.: Normalized cuts and image segmentation. IEEE Transactions on
pattern analysis and machine intelligence 22(8), 888–905 (2000)
26. Stein, B., Niggemann, O.: On the nature of structure and its identification. In: International Workshop on Graph-Theoretic Concepts in Computer Science. pp. 122–134. Springer (1999)
27. Steinhaeuser, K., Chawla, N.V.: Community detection in a large real-world social network. In: Social computing, behavioral modeling, and prediction, pp. 168–175. Springer (2008)
28. Ting, K.M., Zhu, Y., Carman, M., Zhu, Y., Zhou, Z.H.: Overcoming key weaknesses of distance-based neighbourhood methods using a data dependent dissimilarity measure. In: Proceedings of the 22nd ACM SIGKDD international conference on knowledge discovery and data mining. pp. 1205–1214. ACM (2016)
29. Xu, Z., Ke, Y., Wang, Y., Cheng, H., Cheng, J.: A model-based approach to at-tributed graph clustering. In: Proceedings of the 2012 ACM SIGMOD international conference on management of data. pp. 505–516. ACM (2012)
30. Yang, Z., Tang, J., Cohen, W.: Multi-modal bayesian embeddings for learning social knowledge graphs. arXiv preprint arXiv:1508.00715 (2015)
31. Yin, H., Benson, A.R., Leskovec, J., Gleich, D.F.: Local higher-order graph clus-tering. In: Proceedings of the 23rd ACM SIGKDD International Conference on Knowledge Discovery and Data Mining. pp. 555–564. ACM (2017)
32. Zhou, Y., Cheng, H., Yu, J.X.: Graph Clustering Based on Struc-tural/Attribute Similarities. Proceedings of VLDB Endow. 2(1), 718–729 (Aug 2009). https://doi.org/10.14778/1687627.1687709, https://doi.org/10.14778/ 1687627.1687709
33. Zhou, Y., Cheng, H., Yu, J.X.: Clustering large attributed graphs: An efficient incremental approach. In: 2010 IEEE International Conference on Data Mining. pp. 689–698. IEEE (2010)