Contents lists available atScienceDirect
Preventive Medicine Reports
journal homepage:www.elsevier.com/locate/pmedrWeight loss expectations and determinants in a large community-based
sample
Benoit Pétré
a,⁎, André Scheen
b, Olivier Ziegler
c, Anne-Françoise Donneau
a, Nadia Dardenne
a,
Eddy Husson
a, Adelin Albert
a, Michèle Guillaume
aaDepartment of Public Health, University of Liège, Liège, Belgium bDiabetes, Nutrition and Metabolic Disorders, CHU Liège, Liège, Belgium
cDepartment of Endocrinology, Diabetes, and Nutrition, Nancy University Hospital, France
A R T I C L E I N F O
Keywords: Overweight Obesity Population studies Weight loss expectations
A B S T R A C T
While weight-loss expectations have primarily been studied in people enrolled in weight-loss programs, the present study explores patient expectations about weight-loss and identifies related determinants in a large, non-clinical population.
3916 volunteers (age > 18 years) participated in 2012 in a community-based survey in the French-speaking region of Belgium. Participants were asked to define “dream”, “goal”, “happy”, “acceptable”, and “disappointed” weights. Other self-reported measures were used to determine each participant's body mass index (BMI), body image discrepancy (BID), subjective norm (SN), weight loss activity, weight history, quality of life (QoL), and demographic and socioeconomic characteristics. The study focused on the determinants of unrealistic weight-loss“goal” (≥10% of initial weight).
Results showed median weight loss targets ranged from 5 kg (“disappointed” weight loss) to 21 kg (“dreamed” weight loss). Respondents considered the recommended weight-loss target (5–10%) disappointing. Severe and morbid obesity categories are at high risk of unrealistic weight loss goal. Unrealistic weight-loss goals was associated with female gender, weight loss activity, overweight history and lower QoL in overweight and moderate obesity respondents.
Thesefindings confirm the urgent need to help patients accept more modest weight loss outcomes and the need for personalized care that considers the patient's specific profile and both weight loss expectations and determinants.
1. Introduction
Studies on overweight and obese people entering weight-loss pro-grams have shown major discrepancies between patient expectations and clinical guidelines. While weight-loss recommendations advocate a five to 10% reduction in initial body weight (many obesity-related conditions are significantly improved with such modest/moderate weight loss) (National Heart Lung and Blood Institute, 1998), obese people want to lose at least two to three times that much weight. The study byFoster et al. (1997)is often cited as thefirst to address this issue. That survey showed that the average goal for sixty obese women
(body mass index - BMI: 36.3 ± 4.3 kg/m2) was a 32% reduction in body weight. A weight loss of 17 kg was considered disappointing, while a 25 kg loss was considered acceptable. Many other studies have confirmed these findings (Gelinas et al., 2013;Heinberg et al., 2010; Kaly et al., 2008).
Moreover, some studies suggest that people's failure to achieve their weight-loss goal leads to poor weight-loss outcomes such as un-satisfactory, negative emotions and even learned helplessness regarding the prospect of losing weight on their own in the future (Foster et al., 2001). In contrast, realistic expectations are associated with more po-sitive health outcomes (psychological characteristics, eating behaviors,
https://doi.org/10.1016/j.pmedr.2018.08.005
Received 15 February 2018; Received in revised form 4 July 2018; Accepted 3 August 2018
⁎Corresponding author at: Université de Liège, Département des Sciences de la Santé publique, Nutrition, Environnement et Santé, Quartier Hôpital, Avenue Hippocrate 13 (Bât 23), 4000 Liège, Belgium.
E-mail address:[email protected](B. Pétré).
Available online 04 August 2018
2211-3355/ © 2018 The Authors. Published by Elsevier Inc. This is an open access article under the CC BY-NC-ND license (http://creativecommons.org/licenses/BY-NC-ND/4.0/).
and success rates) (Wamsteker et al., 2009;Teixeira et al., 2004). In addition, overweight individuals' difficulty maintaining weight loss over the long term is well known (Wing and Phelan, 2005;Curioni and Lourenço, 2005). In this context, researchers like Fontaine and Barofsky (2001)argued that obesity management should focus more on monitoring and prevention than on curing, suggesting that it is more appropriate to help patients accept more modest weight-loss outcomes. There have been few studies, however, aimed at better understanding the factors that influence patient expectations and outcomes. The available data suggest that higher expectations are associated with personal, clinical, social, and psychological characteristics (Foster et al., 2001;De Vet et al., 2013;Fabricatore et al., 2008).
The majority of these studies focused on patients who were enrolled in weight-loss programs (i.e., those who had consulted a physician or were hospitalized due, in some way, to their condition) (Dalle Grave et al., 2004, 2005). Less is known, however, about the weight-loss ex-pectations and related determinants in the general population (De Vet et al., 2013;Fabricatore et al., 2008;Provencher et al., 2007). However, in terms of public health, better understanding of the experiences and insights of overweight individuals (not necessarily enrolled in weight loss programs) is necessary and important to better target health pro-motion and prevention strategies. Additional research is needed to as-sess patient expectations in a broader population.
Based on these observations, identifying the determinants of weight-loss expectations– in particular weight-loss goal - using a population-based survey represents a major public health challenge, and could lead to specific interventions that encourage overweight and obese in-dividuals to accept more realistic weight-loss goals. The purpose of this study was to improve our understanding of patients' weight-loss goals and expectations by looking at a large non-clinical population not specifically selected based on BMI and not involved in a specific weight management program (although wanting to lose weight), and exploring the determinants of those goals and expectations. Specifically, the au-thors aimed to explore weight-loss expectation (in particular the risk of reporting a unrealistic weight-loss“goal” (≥10%)) and its correlation with some socioeconomic, demographic, quality of life, weight history, body image discrepancy and subjective norm variables in the“general” population.
2. Materials and methods
2.1. Study design and general approach
A survey was conducted in Wallonia (Belgium) as part of a larger project, EDUDORA1 (which in French stands for “Therapeutic and preventive education on diabetes and obesity during adolescence and adulthood”) (Scheen et al., 2010). That project focused on Therapeutic Patient Education (TPE) in two metabolic disorders: diabetes and obe-sity. Specifically, EDUDORA aimed to (1) improve the quality of care for diabetes and obesity prevention in adolescents and adults using a multidisciplinary approach focused on TPE, and (2) involve primary and secondary healthcare professionals in a synergistic way.
The present research is a cross-sectional study based on a quanti-tative approach. A multimedia advertising campaign was used to re-cruit participants (Pétré et al., 2015). A website was developed with a 31-item questionnaire to collect data on sociodemographic and an-thropometric characteristics, quality of life (QoL), obesity-related life experiences, expectations about weight loss and management, and other obesity-related psychosocial issues. The only condition for parti-cipating in the survey was being 18 years of age or older. Every attempt was made to avoid stigmatization, as described in a previous paper by Pétré et al. (2015).
2.2. Population
A community-based sample of 4155 adults was obtained covering a wide range of BMI values, including normal-weight respondents. Only subjects who expressed a willingness to lose weight were eligible for inclusion in the study, however.
2.3. Measures
2.3.1. Dependent variables - weight loss expectations
Consistent with Foster's original proposal (1997), people were questioned aboutfive different weight outcomes: dream weight (“the weight you would reach if you could weigh whatever you want”), goal weight (“the weight realistically people expect to lose”), happy weight (“the weight that is not as ideal as the first one; it is a weight, however, that you would be happy to achieve”), acceptable weight (“a weight that you would not be particularly happy with, but one that you could accept, because it is less than your current weight”) and disappointed weight (“a weight that is less than your current weight, but one that you could not view as successful in any way”). Weight-loss targets were calculated by deducting dream/goal/happy/acceptable/disappointed weight from current weight. Unrealistic weight-loss goal was defined as an expectation≥10% of initial weight.
2.3.2. Independent variables
The demographic and socioeconomic characteristics were BMI, gender, age (years), subjective economic status (easy or difficult), level of education (primary, secondary, or tertiary), household size (1 or > 1) and perceived health (good or bad).
BMI was calculated as weight/height squared (kg/m2). Height and weight were self-reported. BMI was categorized according to the BMI categories used by the World Health Organization (1998): normal weight (18.5≤ BMI < 25), overweight (25 ≤ BMI < 30), obese class I/moderate obesity (30≤ BMI < 35), obese class II/severe obesity (35≤ BMI < 40), and obese class III/morbid obesity (BMI ≥ 40).
Other qualitative measurements were recorded, including body image discrepancy (BID), weight-related quality of life (WR-QoL), subjective norm (SN), and body weight history.
Body image discrepancy (BID): BID measures the“more or less” good visual estimation of the BMI by the subject. Participants were shown a series of nine bodyfigures (1, smallest to 9, largest) asked to select whichStunkard et al. (1983) figure was the most closely re-sembling their current body size. BID was calculated by the following formula:
= −
BID self reported BMI–average BMI for the selected figure.
Weight-related Quality of life (WR-QoL): QoL was assessed using a derived and simplified version of the French obesity specific quality of life questionnaire byZiegler et al. (2005). Participants were asked to evaluate several aspects of life (physical and psychosocial) on a 4-point Likert scale (from total disagreement to total agreement) to know their feelings about 14 statements equally divided into physical problems (PHY-QoL) and psychosocial problems (PSY/SOC-QoL) (e.g.:“Because of my weight, I have trouble to dress or undress”). According to Ziegler et al., each response item was graded from 1 to 4 points (1 = total disagreement with the statement; 4 = total agreement). A score was calculated for both physical and psychological dimension by summing the respective items (range: 7–28 points). A total score (TOT-QoL) was also calculated (range: 14–56 points); the higher the score, the better the quality of life.
Subjective Norm (SN) is the perceived social pressure to engage or not to engage with a behavior, which is influenced by the importance each individual places on their appearance in the eyes of others. SN was calculated by asking the participants to respond to four statements using a four-point Likert scale (with 1 representing total disagreement with the statement and 4 representing total agreement) regarding the 1Education Thérapeutique et Préventive Face au Diabète et à l'Obésité à
following domains: (1) the importance they place on physical appear-ance compared with others, (2) what health professionals think of them, (3) what relatives think of them, and (4) what people, in general, think of them (e.g.,“I attach great importance to what others think about me”). A total score was calculated (range: 4–16 points), and the higher the score, the more importance they placed on their appearance in the“eyes of others”.2
Body weight history: respondents were asked if they were over-weight or not during early childhood, childhood, and adolescence. Current weight loss activity was also investigated by asking respondents whether they were trying to lose weight or not.
2.4. Statistical analysis
Quantitative data were summarized by median and interquartile range (IQR: P25-P75). For qualitative variables, the number and per-centage of subjects in each category were given. Distributions were also displayed graphically by Boxplots. Logistic regression analysis was used to determine the relationship between weight-loss goal (< 10% vs. ≥10%) and each determinant separately and in combination. The strength of association was measured by the odds ratio (OR) and its 95% confidence interval (95%CI). Calculations were always carried out on the maximum number of data available. No specific treatment of missing values was performed. Statistical tests were two-sided and re-sults were considered significant at the 5% level (P < 0.05). Statistical calculations were done using SAS (version 9.4 for Windows) and R (version 3.3.1 for Windows).
2.5. Ethical considerations
The study was approved by the ethics committee of the University Hospital of Liège and patient were informed about the study goals. Collected data remained completely anonymous. Patient consent was assumed in view of the voluntary participation of the respondents and the lack of any pressure to participate.
3. Results
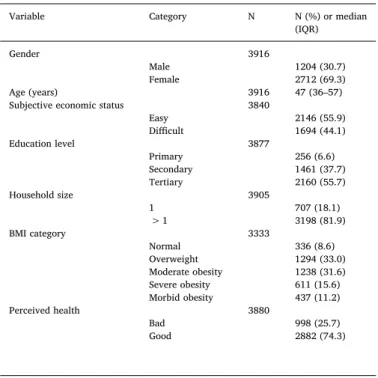
Of the 4155 subjects who completed the online questionnaire, 3916 (94.2%) were eligible based on the fact that they wanted to lose weight. Their characteristics are presented inTable 1. The median age was 47 (IQR: 36–57) years. The respondents were predominantly women (69.3%), had a high level of education (55.7%), and felt their income made it easy to deal with household expenses (55.9%). Eighteen per-cent lived alone. BMI values were distributed as follows: 336 (8.6%) normal weight, 1294 (33.0%) overweight, 1238 (31.6%) obese class I, 611 (15.6%) obese class II, and 437 (11.2%) obese class III.
Table 2shows the median weight-loss targets expressed in kg and % of initial weight. Weight-loss targets ranged from 5 kg (“disappointed” weight loss) to 21 kg (“dreamed” weight loss), or from 6% to 24% of initial weight, respectively.
As observed inFig. 1focusing on weight-loss“goal”, the higher the BMI category was, the higher was the weight-loss target. The median of “weight-loss goal” exceeded markedly 10% of initial weight for the “moderate”, “severe obesity” and “morbid obesity” BMI categories.
Logistic regression showed that each parameter studied was sig-nificantly associated with weight-loss goal (≥10%), except household size and SN (Table 3). When all of the parameters were combined in a multivariate analysis, gender, age, weight loss activity, overweight during childhood, BID, PHY-QoL, and PSYCHO/SOC-QoL remained significantly associated with a ≥10% weight-loss goal. The probability of reporting a≥10% weight-loss goal was higher for females (p = 0.01)
and younger people (p = 0.02), it was related to lack of weight loss activity (p < 0.0001), early childhood overweight (p = 0.0088), high BID (p < 0.0001), and low QoL (p < 0.0001). Corresponding ORs with 95% CI are displayed inFig. 2.
Table 4 and Fig. 2 show the association between different de-terminants and an unrealistic (≥10%) weight loss for each BMI cate-gory. Among respondents with a “normal” BMI, only gender (p = 0.0038), weight-loss activity (p = 0.04) and PSYCHO/SOC-QoL (p = 0.02) were associated with weight-loss goal in the multivariate model. Women, subjects with no weight-loss activity and with lower PSYCHO/SOC-QoL had a higher risk of reporting an unrealistic weight loss. Overweight respondents had the weight-loss target most strongly influenced by a set of eight covariates in the multivariate model, in-cluding gender (p < 0.0001), age (p < 0.0001), household size (p = 0.05), weight-loss activity (p < 0.0001), overweight during early childhood (p = 0.03), childhood (p = 0.0079), and adolescence (p = 0.04) and PSYCHO/SOC-QoL (p = 0.003). Women, younger people, living with others, subjects with no weight-loss activity, sub-jects who were overweight during early childhood and adolescence and with lower PSYCHO/SOC-QoL had a higher risk of reporting an un-realistic weight loss. Respondents with moderate obesity were influ-enced byfive variables in the multivariate model: gender (p = 0.02), age (p = 0.0004), perceived health (p = 0.0092), weight-loss activity Table 1
Demographic and socioeconomic characteristics of the survey sample, EDUDORA (2012).
Variable Category N N (%) or median (IQR)
Gender 3916
Male 1204 (30.7)
Female 2712 (69.3)
Age (years) 3916 47 (36–57)
Subjective economic status 3840
Easy 2146 (55.9) Difficult 1694 (44.1) Education level 3877 Primary 256 (6.6) Secondary 1461 (37.7) Tertiary 2160 (55.7) Household size 3905 1 707 (18.1) > 1 3198 (81.9) BMI category 3333 Normal 336 (8.6) Overweight 1294 (33.0) Moderate obesity 1238 (31.6) Severe obesity 611 (15.6) Morbid obesity 437 (11.2) Perceived health 3880 Bad 998 (25.7) Good 2882 (74.3) Table 2
Weight-loss targets in the survey sample, EDUDORA (2012).
Weight loss category N Median (IQR) (kg)
Median (IQR) (% of initial weight)
Initial weight 3916 89 (78–103) NA
“Dream” weight loss 3805 21 (14–32) 24.2 (17.1–33) “Goal” weight loss 3820 15 (9–25) 17.5 (11.5–25) “Happy” weight loss 3775 14 (8–22) 15.7 (10–22.6) “Acceptable” weight loss 3747 11 (6–20) 12.8 (7.9–19.6) “Disappointed” weight loss 3498 5 (2−10) 6 (3–10.5)
2The description of BID, SN, and WR-QoL was taken verbatim fromPétré et al., 2016.
(p = 0.0004) and PHY-QoL (p = 0.0019). Women, younger people, bad perceived health, no weight-loss activity and lower PHY-QoL were as-sociated with a higher risk of reporting an unrealistic weight loss.
We were unable to test statistically the difference between < 10% and≥10% weight-loss goal for severe and morbid obesity categories. Distribution of respondents was disproportionate: the large majority of respondents (98.8% and 99.5% respectively) wished a≥10% weight-loss goal.
4. Discussion
The aim of this study was to investigate a variety of weight-loss targets in a large non-clinical sample and the factors that influence them. Based on the responses of 3.916 subjects, the study provides new insights for managing weight-loss expectations and has practical im-plications.
It confirms previous findings regarding individuals' unrealistic ex-pectations about weight loss. Moreover, it suggests for thefirst time Fig. 1. Distribution of weight-loss“goal” according to BMI category, EDUDORA (2012).
Table 3
Determinants of weight-loss goal assessed by logistic regression analysis (n = 3820).
Weight-loss goal
< 10% (n = 710) ≥10% (n = 3110) Univariate Multivariate
Determinant Category Number (%) Number (%) P value P value
Gender Men 285 (40.1) 889 (28.6) < 0.0001 0.01
Women 425 (59.9) 2221 (71.4)
Age, median (IQR) 48 (35–59) 47 (36–56) 0.039 0.02
Subjective economic status Easy 509 (72.5) 1597 (51.9) < 0.0001 0.07 Difficult 193 (27.5) 1478 (48.1)
Education level Primary 34 (4.8) 212 (6.9) < 0.0001 0.1
Secondary 187 (26.6) 1246 (40.4) Tertiary 483 (68.6) 1623 (52.7)
Household size 1 130 (18.3) 544 (17.5) 0.63 0.05
> 1 580 (81.7) 2558 (82.5)
Perceived health Bad 81 (11.5) 901 (29.2) < 0.0001 0.49
Good 624 (88.5) 2180 (70.8)
Weight loss activity Yes 495 (70.6) 1557 (50.4) < 0.0001 < 0.0001 None 206 (29.4) 1533 (49.6)
Overweight during early childhood No 545 (81.7) 2081 (70.6) < 0.0001 0.0088 Yes 122 (18.3) 868 (29.4)
Overweight during childhood No 581 (90.4) 2452 (85.0) 0.0004 0.96
Yes 62 (9.6) 434 (15.0)
Overweight during adolescence No 463 (68.1) 1694 (56.1) < 0.0001 0.79 Yes 217 (31.9) 1325 (43.9)
BID, median (IQR) 0.6 (−1.2–2.3) 2.2 (−0.3, 5.0) < 0.0001 < 0.0001
SN, median (IQR) 11 (10−12) 12 (10−13) 0.056 0.17
QoL PHY, median (IQR) 22 (20–24) 20 (17–22) < 0.0001 < 0.0001 QoL PSYCHO-SOCIO, median (IQR) 18 (16–20) 16 (14–18) < 0.0001 < 0.0001
that the majority of individuals in a non-clinical sample have weight-loss targets exceeding the recommended 5%–10% reduction from initial weight (National HeartLung and Blood Institute, 1998). The weight-loss targets in this study are more modest than those found in thefirst study byFoster et al. (1997), suggesting that non-clinical subjects tend to have more reasonable expectations than do clinical subjects. Speci-fically, non-clinical subjects have disappointed weight-loss wishes over 10% of their actual weight. Our results are in line with previous re-search focusing on a community-based sample (Fabricatore et al., 2008). In our study, the respondents considered the recommended weight-loss target (5–10%) disappointing.
Our study went a step further by examining the determinants re-lated to reporting a ≥10% weight-loss “goal”. To the best of our knowledge, this is thefirst time such associations were explored.
Ourfindings confirm previous studies that found that gender, BMI, and age are important determinants of weight-loss targets (Foster et al., 2001; Wamsteker et al., 2009; Fabricatore et al., 2008). Further, our research extends previous findings by demonstrating that socio-economic determinants play very little role in weight-loss targets. In-deed, subjective economic status, education level, household size, and SN do not seem to play a major role in determining individuals' weight-loss outcomes. While the relationship between obesity and low socio-economic status is well-established (WHO, 2014) our results are similar to those of previous studies comparing weight loss between participants of different socioeconomic status, which failed to find significant so-cioeconomic disparities in weight outcomes (Wing et al., 2004;Rautio et al., 2011). So while people are not at equal risk of obesity, that disparity does not seem to carry over to weight-loss expectations or success.
Our results showed that PHY-QoL and PSY/SOC-QoL were protec-tive factors, respecprotec-tively, for overweight and moderate obesity re-spondents. In other words, weight-loss expectations in overweight subjects were more determined by the psychosocial aspects of quality of life, whereas physical conditions were more influential in moderately obese subjects. This is essential, given the statement byFontaine and Barofsky (2001) regarding the relationship between obesity
management and individuals' quality of life. This calls for personalized support where the levers of action will not be the same according to the BMI category of people (Crutze et al., 2017). While our study helps demonstrate the association between QoL and weight-loss targets, fu-ture studies should explore any causal links between the two.
Crutze et al. (2017)showed the importance of BID and SN in obesity management and how these play a role in mediating/moderating the relationship between BMI and QoL. Our results failed to confirm the importance of BID and SN on weight-loss targets when considering a multivariate approach.
Regarding weight history, we only observed an effect in overweight people. While overweight during early childhood was considered as a risk factor of unrealistic goal weight loss, our results showed the op-posite effect for overweight during childhood and adolescence. Future studies will try to help understanding how overweight history does influence people weight-loss expectations.
One reassuring result is that individuals who declare themselves in an approach to losing weight (“weight loss activity”) tend to report more realistic weight-loss goals. This result can be seen as the fact that obesity prevention campaign and management in Belgium is effective in bringing individuals back into realistic expectations.
Another novelfinding is that the determinants of weight-loss tar-gets, in particular of realistic weight-loss“goal”, vary with individuals' BMI category. The most prominent result is related to the severe and morbid obesity categories. People included in these categories are at high risk of unrealistic weight-loss goal. Our study failed tofind pro-tective factors of realistic weight-loss goal due the large proportion of people who reported a weight-loss goal≥ 10%. For other BMI cate-gories, gender, weight-loss activity, overweight history and QoL seem to represent important variables of interest when discussing weight-loss goal with individuals. Hence, managing obese patients requires a more personalized approach that takes into account the fact that both weight loss targets and related determinants can vary depending on the BMI status of the individual.
This study has some limitations. It was based on a voluntary and spontaneous participation of individuals in the survey; thus the sample Fig. 2. Multivariate odds ratio (CI95%) of the determinants of weight-loss goal globally and according to the BMI status of individuals.
Table 4 Determinants of weight-loss goal according to the BMI status of individuals. Normal weight (n = 336) Overweight (n = 1294) Weight-loss goal Weight-loss goal < 10% (n = 212) ≥ 10% (n = 114) Univariate Multivariate < 10% (n = 402) ≥ 10% (n = 1260) Univariate Multivariate Determinants n (%) n (%) P value P value n (%) n (%) P value P value Gender Men 42 (19.8) 6 (5.3) 0.0004 0.0038 195 (48.5) 217 (25.3) < 0.0001 < 0.0001 Women 170 (80.2) 108 (94.7) 207 (51.5) 641 (74.7) Age Median (IQR) 38.5 (29 –51) 35.5 (27 –50) 0.15 0.5 50.5 (39.59) 44 (34 –54) < 0.0001 < 0.0001 Subjective economic status Easy 148 (70.1) 63 (56.3) 0.01 0.92 299 (75.1) 486 (57.8) < 0.0001 0.24 Di ffi cult 63 (29.9) 49 (43.8) 99 (24.9) 355 (42.2) Education level Primary 3 (1.4) 5 (4.4) 0.08 0.36 19 (4.8) 35 (4.1) 0.05 0.53 Secondary 48 (22.9) 34 (29.8) 110 (27.6) 292 (34.4) Tertiary 159 (75.7) 75 (65.8) 270 (67.7) 521 (61.4) Household size 1 33 (15.6) 15 (13.2) 0.56 0.16 78 (19.4) 136 (15.9) 0.12 0.05 > 1 179 (84.4) 99 (86.8) 324 (80.6) 719 (84.1) Perceived health Bad 19 (9.0) 14 (12.5) 0.32 0.83 41 (10.3) 158 (18.6) 0.0002 0.28 Good 192 (91.0) 98 (87.5) 359 (89.8) 691 (81.4) Weight loss activity Yes 145 (69.7) 69 (61.1) 0.12 0.04 281 (70.6) 460 (54.1) < 0.0001 < 0.0001 None 63 (30.3) 44 (38.9) 117 (29.4) 391 (45.9) Overweight during early childhood No 171 (84.2) 89 (82.4) 0.68 0.43 308 (82.8) 620 (77.4) 0.03 0.03 Yes 32 (15.8) 19 (17.6) 64 (17.2) 181 (22.6) Overweight during childhood No 179 (93.7) 101 (90.2) 0.26 0.54 325 (89.0) 724 (90.8) 0.34 0.0079 Yes 12 (6.3) 11 (9.8) 40 (11.0) 73 (9.2) Overweight during adolescence No 131 (65.2) 76 (69.1) 0.48 0.065 275 (70.7) 536 (64.6) 0.04 0.04 Yes 70 (34.8) 34 (30.9) 114 (29.3) 294 (35.4) BID Median (IQR) − 0.69 (− 2.19;0.79) − 1.47 (− 2.6;0.96) 0.13 0.24 0.79 (− 0.85;2.53) 0.26 (− 1.27;2.14) 0.002 0.10 SN Median (IQR) 12 (11 − 13) 12 (11;13.5) 0.08 0.43 11 (10 –12) 12 (10 –13) 0.0002 0.46 QoL PHY Median (IQR) 23 (21 –25) 22 (20 –24) 0.09 0.82 23 (20 –25) 21 (18 –23) < 0.0001 0.24 QoL PSYCHO-SOCIO Median (IQR) 17 (16 –19) 17 (14 –19) 0.03 0.02 18 (16 –21) 17 (14 –19) < 0.0001 0.0033 Moderate obesity (n = 1238) Severe obesity (n = 611) Motbid obesity (n = 437) Weight-loss goal Weight-loss goal Weight-loss goal < 10% (n = 87) ≥ 10% (n = 1213) Univariate Multivariate < 10% (n = 7) ≥ 10% (n = 597) Univariate < 10% (n = 2) ≥ 10% (n = 424) Determinants n (%) n (%) P value P value n (%) n (%) P value n (%) n (%) Gender 45 (51.7) 368 (32.7) 0.0003 0.02 3 (42.9) 193 (32.7) 0.57 0 (0.0) 105 (24.9) 42 (48.3) 758 (67.3) 4 (57.1) 397 (67.3) 2 (100.0 317 (75.1) Age Median (IQR) 58 (45 –65) 49 (39 –59) < 0.0001 0.0004 48 (32 –72) 48 (37 –57) 0.82 43.5 (39 –48) 46 (37 –55) Subjective economic status 58 (69.0) 625 (55.8) 0.02 0.47 3 (42.9) 250 (42.8) 1 1 (50.0) 173 (41.4) 26 (31.0) 495 (44.2) 4 (57.1) 334 (57.2) 1 (50.0) 245 (58.6) (continued on next page )
Table 4 (continued ) Moderate obesity (n = 1238) Severe obesity (n = 611) Motbid obesity (n = 437) Weight-loss goal Weight-loss goal Weight-loss goal < 10% (n = 87) ≥ 10% (n = 1213) Univariate Multivariate < 10% (n = 7) ≥ 10% (n = 597) Univariate < 10% (n = 2) ≥ 10% (n = 424) Determinants n (%) n (%) P value P value n (%) n (%) P value n (%) n (%) Education level 11 (12.8) 71 (6.4) 0.009 0.3 0 (0.0) 53 (9.1) 0.67 1 (50.0) 48 (11.5) 25 (29.1) 480 (43.0) 4 (57.1) 271 (46.4) 0 (0.0) 169 (40.3) 50 (58.1) 565 (50.6) 3 (42.9) 260 (44.5) 1 (50.0) 202 (48.2) Household size 17 (19.5) 194 (17.3) 0.59 0.88 1 (14.3) 120 (20.4) 0.69 1 (50.0) 79 (18.8) 70 (80.5) 930 (82.7) 6 (85.7) 469 (79.6) 1 (50.0) 341 (81.2) Perceived health 18 (21.2) 306 (27.3) 0.22 0.0092 3 (42.9) 227 (38.9) 0.83 0 (0.0) 196 (47.1) 67 (78.8) 814 (72.7) 4 (57.1) 357 (61.1) 2 (100.0 220 (52.9) Weight loss activity 61 (70.9) 560 (50.0) 0.0002 0.0004 7 (100.0) 272 (46.3) 0.0047 1 (50.0) 196 (46.9) 25 (29.1) 561 (50.0) 0 (0.0) 315 (53.7) 1 (50.0) 222 (53.1) Overweight during early childhood 61 (73.5) 817 (75.4) 0.69 0.27 5 (71.4) 348 (62.4) 0.62 0 (0.0) 207 (51.9) 22 (26.5) 266 (24.6) 2 (28.6) 210 (37.6) 2 (100.0 192 (48.1) Overweight during childhood 72 (91.1) 916 (86.7) 0.26 0.1 5 (71.4) 425 (79.4) 0.6 0 (0.0) 286 (74.1) 7 (8.9) 140 (13.3) 2 (28.6) 110 (20.6) 1 (100.0 100 (25.9) Overweight during adolescence 55 (67.1) 674 (61.7) 0.33 0.84 2 (33.3) 270 (47.1) 0.5 0 (0.0) 138 (33.4) 27 (32.9) 419 (38.3) 4 (66.7) 303 (52.9) 2 (100.0 275 (66.6) BID Median (IQR) 2.78 (1.03;4.65) 2.25 (0.12;4.24) 0.03 0.59 3.86 (1.20 –5.92) 4.34 (1.79 –6.44) 0.61 18.4 (8.6 –28.2) 7.3 (4.68 –11.32) SN Median (IQR) 10 (9 –12) 12 (10 –13) 0.0063 0.92 9 (8 –11) 12 (9 –13) 0.04 10 (9 –11) 11 (9 –13) QoL PHY Median (IQR) 21.5 (19 –23) 20 (17 –22) < 0.0001 0.0019 21 (17 –24) 18 (16 –21) 0.26 19 (19 –19) 18 (15 –20) QoL PSYCHO-SOCIO Median (IQR) 19 (17 –21) 16 (14 –19) < 0.0001 0.14 18 (14 –19) 15 (13 –18) 0.37 19.5 (18 –21) 15 (12 –17)
was not necessarily representative of the target population. However, the number of survey respondents allowed an adequate distribution of individuals in all BMI categories and statistical processing. Moreover, most studies on weight-loss goals in obesity have had smaller sample sizes and/or limited age ranges. Another limitation is that BMI was self-reported, so that under- or overestimation cannot be ruled out. However, because the survey was anonymous, this potential bias is probably minimal. The present study focused solely on individual-re-lated factors, while previous studies have shown the importance of environment and media regarding weight-loss difficulties (Frederick et al., 2016;Puhl and Heuer, 2010). While this study was cross-sec-tional, the confirmation of causal associations would require long-itudinal studies and experimental designs.
Given that even the best available obesity treatments produce weight loss of only about 10% of the initial weight after one year (Wing and Phelan, 2005), helping patients accept more modest outcomes seems necessary. Behavioral therapy considers realistic goal as one fundamental step for management of obesity (Jacob and Isaac, 2012). We note, however, that it has proved quite difficult to alter patients' perceptions about what is a reasonable weight loss (Fabricatore et al., 2008). Referring to Atkinson research on motivational determinants of risk-taking behavior (Atkinson, 1957;Atkinson and Litwin, 1960), un-realisitc weight-loss goal of obese people could be viewed as a psy-chological protective mechanism: higher objectives may help people not feeling guilty if not achieving expected results. Taking the per-spectives and expectations of both patients and health providers into account, patient education and a patient-centered strategy (Miller and Stoeckel, 2015) would seem to be an interesting approach to nego-tiating reasonable weight-loss goals in obesity and overweight man-agement. Because weight control and thinness remain societal gold standards, however, this is difficult. Thus educating people about the biological limits of weight loss and the medical benefits of modest weight loss and employing strategies to improve patients' body sa-tisfaction, quality of life, and self-esteem should be key components in obesity management.
Funding
This work was supported by the European Regional Development Fund and the Belgian Public Health Authorities (Program INTERREG IV – 50WLL/3/3/136).
Conflicts of interest None.
References
Atkinson, J.W., 1957. Motivational determinants of risk-taking behavior. Psychol. Rev. 64 (6, Pt.1), 359–372.
Atkinson, J.W., Litwin, G.H., 1960. Achievement motive and test anxiety conceived as motive to approach success and motive to avoid failure. J. Abnorm. Soc. Psychol. 60 (1), 52–63.
Crutze, C., Pétré, B., Dardenne, N., et al., 2017. Exploratory population study of over-weight and obese subjects' perceptions: searching for improved management prac-tices. Rev. Epidemiol. Sante Publique 65 (3), 209–219.https://doi.org/10.1016/j. respe.2017.01.117.(Epub 2017 Mar 19).
Curioni, C.C., Lourenço, P.M., 2005. Long-term weight loss after diet and exercise: a systematic review. Int. J. Obes. (Lond) 29 (10), 1168–1174.
Dalle Grave, R., Calugi, S., Magri, F., et al., 2004. Weight loss expectations in obese pa-tients seeking treatment at medical centers. Obes. Res. 12 (12), 2005–2012.
Dalle Grave, R., Calugi, S., Molinari, E., et al., 2005. Weight loss expectations in obese patients and treatment attrition: an observational multicenter study. Obes. Res. 13 (11), 1961–1969.
De Vet, E., Nelissen, R.M., Zeelenberg, M., De Ridder, D.T., 2013. Ain't no mountain high
enough? Setting high weight loss goals predict effort and short-term weight loss. J. Health Psychol. 18 (5), 638–647.https://doi.org/10.1177/1359105312454038.
(Epub 2012 Aug 29).
Fabricatore, A.N., Wadden, T.A., Rohay, J.A., et al., 2008. Weight loss expectations and goals in a population sample of overweight and obese US adults. Obesity (Silver Spring) 16 (11), 2445–2450.
Fontaine, K.R., Barofsky, I., 2001. Obesity and health-related quality of life. Obes. Rev. 2 (3), 173–182.
Foster, G.D., Wadden, T.A., Vogt, R.A., Brewer, G., 1997. What is a reasonable weight loss? Patients' expectations and evaluations of obesity treatment outcomes. J. Consult. Clin. Psychol. 65 (1), 79–85.
Foster, G.D., Wadden, T.A., Phelan, S., Sarwer, D.B., Sanderson, R.S., 2001. Obese pa-tients' perceptions of treatment outcomes and the factors that influence them. Arch. Intern. Med. 161 (17), 2133–2139.
Frederick, D.A., Saguy, A.C., Gruys, K., 2016. Culture, health, and bigotry: how exposure to cultural accounts of fatness shape attitudes about health risk, health policies, and weight-based prejudice. Soc. Sci. Med. Sep. 165, 271–279.https://doi.org/10.1016/ j.socscimed.2015.12.031.
Gelinas, B.L., Delparte, C.A., Hart, R., Wright, K.D., 2013. Candidates: the impact on pre-and postsurgical weight outcomes. Bariatr. Surg. Pract. Patient Care 8 (1), 12–17.
https://doi.org/10.1089/bari.2013.9999.
Heinberg, L.J., Keating, K., Simonelli, L., 2010. Discrepancy between ideal and realistic goal weights in three bariatric procedures: who is likely to be unrealistic? Obes. Surg. 20 (2), 148–153.https://doi.org/10.1007/s11695-009-9982-8.(Epub 2009 Oct 1).
Jacob, J.J., Isaac, R., 2012. Behavioral therapy for management of obesity. Indian J. Endocrinol. Metab. 16 (1), 28–32 (Jan).
Kaly, P., Orellana, S., Torrella, T., Takagishi, C., Saff-Koche, L., Murr, M.M., 2008. Unrealistic weight loss expectations in candidates for bariatric surgery. Surg. Obes. Relat. Dis. 4 (1), 6–10.https://doi.org/10.1016/j.soard.2007.10.012.
Miller, M.A., Stoeckel, P.R., 2015. Client Education: Theory and Practice, second ed. Jones & Bartlett Learning, Burlington.
National Heart Lung and Blood Institute, 1998. Clinical guidelines on the identification, evaluation, and treatment of overweight and obesity in adults: executive summary. Expert panel on the identification, evaluation, and treatment of overweight in adults. Am. J. Clin. Nutr. 68 (4), 899–917.
Pétré, B., Donneau, A.-F., Crutze, C., Husson, E., Scheen, A., Guillaume, M., 2015. Obese subjects involvement in a population-based survey: the use of information and communication technologies (ICT) to avoid stigmatization. Qual. Life Res. 24 (5), 1131–1135.
Pétré, B., Scheen, A.J., Ziegler, O., Donneau, A.F., Dardenne, N., Husson, E., Albert, A., Guillaume, M., 2016. Body image discrepancy and subjective norm as mediators and moderators of the relationship between body mass index and quality of life. Patient. Prefer. Adherence 10, 2261–2270 (Nov 4; eCollection 2016).
Provencher, V., Bégin, C., Gagnon-Girouard, M.P., et al., 2007. Defined weight expecta-tions in overweight women: anthropometrical, psychological and eating behavioral correlates. Int. J. Obes. (Lond) 31 (11), 1731–1738.
Puhl, R.M., Heuer, C.A., 2010. Obesity stigma: important considerations for public health. Am. J. Public Health 100 (6), 1019–1028.https://doi.org/10.2105/AJPH.2009. 159491.
Rautio, N., Jokelainen, J., Oksa, H., et al., 2011. FIN-D2D Study Group Socioeconomic position and effectiveness of lifestyle intervention in prevention of type 2 diabetes: one-year follow-up of the FIN-D2D project. Scand. J. Public Health 39 (6), 561–570.
https://doi.org/10.1177/1403494811408482.
Scheen, A., Bourguignon, J.-P., Hubermont, G., et al., 2010. Education therapeutique et preventive face au diabete et a l'obesite a risque chez l'adulte et l'adolescent: le projet Interreg IV EDUDORA2. Diabetes Metab. 36 (Suppl. 1), 193.
Stunkard, A.J., Sørensen, T., Schulsinger, F., 1983. Use of the Danish Adoption Register for the study of obesity and thinness. Res. Publ. Assoc. Res. Nerv. Ment. Dis. 60, 115–120.
Teixeira, P.J., Going, S.B., Houtkooper, L.B., et al., 2004. Pretreatment predictors of at-trition and successful weight management in women. Int. J. Obes. 28 (9), 1124–1133. Wamsteker, E.W., Geenen, R., Zelissen, P.M., van Furth, E.F., Iestra, J., 2009. Unrealistic weight-loss goals among obese patients are associated with age and causal attribu-tions. J. Am. Diet. Assoc. 109 (11), 1903–1908.https://doi.org/10.1016/j.jada.2009. 08.012.
Wing, R.R., Phelan, S., 2005. Long-term weight loss maintenance. Am. J. Clin. Nutr. 82 (suppl) 222S–5S.
Wing, R.R., Hamman, R.F., Bray, G.A., et al., 2004. Achieving weight and activity goals among Diabetes Prevention Program lifestyle participants. Obes. Res. 12, 1426–1434.
World Health Organization, 1998. Preventing and Managing the Global Epidemic: Report on a WHO Consultation (WHO Technical Report Series 894). World Health Organization, Geneva.
World Health Organization, 2014. Obesity and Inequities. Guidance for Addressing Inequities in Overweight and Obesity.http://www.euro.who.int/__data/assets/pdf_ file/0003/247638/obesity-090514.pdf, Accessed date: 3 July 2018.
Ziegler, O., Filipecki, J., Girod, I., Guillemin, F., 2005. Development and validation of a French obesity-specific quality of life questionnaire: Quality of Life, Obesity and Dietetics (QOLOD) rating scale. Diabetes Metab. 31 (3 Pt 1), 273–283.