Concept Generation Methods in Highly Constrained
Design Problems
by
Stephanie V. Proule
B.S. Mechanical Engineering, University of Maryland (2011)
Submitted to the Department of Mechanical Engineering
in partial fulfillment of the requirements for the degree of
Master of Science in Mechanical Engineering
at the
MASSACHUSETTS INSTITUTE OF TECHNOLOGY
June 2018
c
○ Stephanie V. Proule, MMXVIII. All rights reserved.
The author hereby grants to MIT permission to reproduce and to
distribute publicly paper and electronic copies of this thesis document
in whole or in part in any medium now known or hereafter created.
Author . . . .
Department of Mechanical Engineering
May 18, 2018
Certified by . . . .
Maria C. Yang
Associate Professor of Mechanical Engineering
Thesis Supervisor
Accepted by . . . .
Rohan Abeyaratne
Chairman, Department Committee on Graduate Theses
Concept Generation Methods in Highly Constrained Design
Problems
by
Stephanie V. Proule
Submitted to the Department of Mechanical Engineering on May 18, 2018, in partial fulfillment of the
requirements for the degree of
Master of Science in Mechanical Engineering
Abstract
Innovation and creativity are prioritized in engineering solutions, yet engineers and designers must also grapple with complex design problems which are highly con-strained by requirements, regulations, and limited resources. This research seeks to understand the relationship between design constraints and concept generation meth-ods in order to support innovation and creativity in the design of complex systems. A design study was conducted with 12 groups of civilian engineers from the Naval Undersea Warfare Center Division Newport. Participants were asked to generate concepts for two different design problems in which the ideation method and level of constraint were varied. Group brainstorming and a modified 6-3-5 method were used as a direct comparison, while a sketch modelling exercise was also incorporated to obtain qualitative observations and serve as a training exercise for participants. All generated ideas during the study were evaluated on four different ideation metrics: quantity, variety, quality, novelty.
Constraint did not have a significant effect on quantity or variety; however low constrained problems produced statistically more novel ideas (for brainstorming only) and high constrained problems produced statically higher quality ideas (for both brainstorming and modified 6-3-5). The concept generation method has a marginally significant effect on the quality and variety; a modified 6-3-5 method produces a marginally higher quantity and brainstorming produces a marginally higher variety. Brainstorming produces significantly higher novelty and modified 6-3-5 method pro-duces significantly higher quality (only for low constrained cases). The design task itself has a significant interaction effect on quantity, novelty, and quality of ideas generated which warrants further investigation.
Thesis Supervisor: Maria C. Yang
Acknowledgments
My time at MIT has been an incredible experience and it’s bittersweet to leave such an amazing place. To all my friends, family, faculty, colleagues, and coworkers who supported me during my degree program and thesis research, “thank you” is not enough to express my deep gratitude. You all have encouraged me, challenged me, cared about me, and kept me laughing even when it was difficult.
Firstly, to my husband, Jonathan, my degree and research literally would not have happened without you. Thank you for motivating me to pursue my Master’s at MIT in the first place and going on this academic journey with me. Thank you for all the times you did the chores, packed my lunch, made me breakfast, and kept the house running smoothly so that I could focus on my work or get just a few more minutes of sleep. Thank you for your assistance with my data analysis and evaluation, your patience while explaining what “bootstrapping” means, and practically writing all of the R code for me. You are brilliant and I would still just be using a t-test p-value if it wasn’t for you. I love you always and forever.
To my advisor, Maria Yang, thank you for your invaluable guidance and input into my research, but most importantly, thank you for always caring about how I was doing – this means more than you know. I appreciate all your patience, understanding, and the funding gymnastics you did on my behalf. I hope we can work on more projects together in the future!
To my supervisors and mentors at NUWC – Chris DelMastro, Jim Broadmeadow, Nicole Harvey, John Babb, and Vic Ricci – thank you for supporting my educational goals, giving me the opportunity of a lifetime to study at MIT, providing wise counsel, and always advocating on my behalf in the midst of great resistance. I respect and admire you all.
This thesis research was generously funded by the Naval Undersea Warfare Center Division Newport through the FY 2018 Section 219R Internal Investment Program.
Contents
1 Introduction & Background 15
1.1 Introduction . . . 15
1.1.1 Motivation . . . 15
1.1.2 Framework . . . 16
1.2 Thesis Objective . . . 17
1.3 Ideation and the Design Process . . . 18
1.3.1 What is design? . . . 18
1.3.2 What is the design process? . . . 20
1.3.3 What is ideation? . . . 24
1.3.4 Why does ideation matter? . . . 25
1.4 Ideation, Creativity, and Innovation . . . 26
1.5 Ideation and the Influence of Constraints . . . 27
1.6 Current Ideation Methods . . . 28
1.6.1 Group Brainstorming . . . 29
1.6.2 Brainwriting and Collaborative Sketching . . . 30
1.6.3 Prototypes and Models . . . 31
1.7 Differentiation of this Research . . . 33
2 Experimental Methodology & Results 35 2.1 Experimental Methodology . . . 35
2.1.1 Design Study Test Matrix . . . 37
2.1.2 Design Problems . . . 37
2.1.3 Ideation Methods . . . 39
2.1.4 Participants . . . 41
2.2 Scoring Approach for Ideation Effectiveness Metrics . . . 43
2.2.1 Quantity Score Measurement . . . 44
2.2.2 Variety Score Measurement . . . 44
2.2.3 Novelty Score Measurement . . . 46
2.2.4 Quality Score Measurement . . . 48
3 Experimental Results 51 3.1 Survey Responses . . . 51
3.2 Results for Ideation Effectiveness Metrics . . . 57
3.2.1 Data Analysis Approach . . . 57
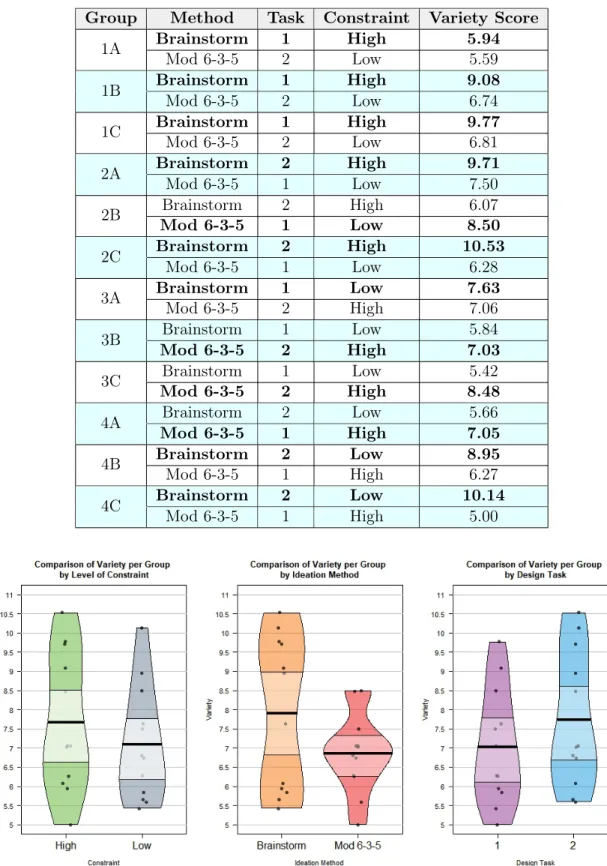
3.2.3 Variety Results . . . 62
3.2.4 Novelty Results . . . 65
3.2.5 Quality Results . . . 70
3.2.6 Overall Ideation Effectiveness . . . 75
3.2.7 Correlations between Metrics . . . 77
3.3 Sketch Model Observations . . . 82
4 Discussion & Conclusion 89 4.1 Discussion . . . 89
4.1.1 Hypothesis #1: The Influence of Constraints . . . 89
4.1.2 Hypothesis #2: The Influence of Method . . . 92
4.1.3 Hypothesis #3: The Benefit of Sketch Modeling . . . 93
4.1.4 The Influence of the Design Task . . . 94
4.2 Recommendations . . . 96
4.3 Future Work . . . 97
Bibliography 99
A Prominent Design-Related Journals, Societies, and Conferences 111
B Participant Surveys 113
C Design Problem Statements 117
D Design Task Genealogy Trees 125
List of Figures
1-1 Urlich and Eppinger’s Product Development Process . . . 21
1-2 Department of Defense Acquisition Process . . . 21
1-3 The Design Process taught by Stanford’s d.school . . . 22
1-4 The Design Process developed by Paris-Est d.school . . . 22
1-5 The Jet Propulsion Laboratory Engineering Design Process . . . 23
1-6 The Double Diamond Design Process developed by Service Design Van-couver . . . 23
1-7 The Design Process developed by the Chicago Architecture Foundation 24 1-8 Cost Commitment Curve from Rush and Rajkumar . . . 25
2-1 Notional Layout of Rapid Innovation Center . . . 36
2-2 Presented Brainstorming Instructions . . . 39
2-3 Presented Modified 6-3-5 Instructions . . . 40
2-4 Sketch Modeling Supplies and Tools . . . 40
2-5 Presented Sketch Modeling Instructions . . . 41
2-6 Histogram of Participants’ Years of Experience . . . 42
2-7 Participants’ Engineering Domain Expertise . . . 42
2-8 Years of Experience per Group by Domain Expertise and Gender . . 43
2-9 Example of Concept for Task #2: Ideas for Detecting and Disabling an Incoming Drone . . . 44
2-10 Sample Genealogy Tree of an Idea Set . . . 45
2-11 Example of two similar ideas which differ in the detail stage . . . 45
2-12 Example of two similar ideas at different concept stages . . . 46
2-13 Example of a Novel and Common Idea for Task #1 . . . 47
2-14 Partial Genealogy Tree for Task #1 used to Determine Novelty Scores 48 3-1 Concept Generation Methods which are New to Participants . . . 52
3-2 Participant Responses to Comfort with Ideation Methods . . . 52
3-3 Participant Responses to Generation Effectiveness of Ideation Methods 52 3-4 Participant Responses to Refinement Effectiveness of Ideation Methods 53 3-5 Participant Creativity Self-Assessment . . . 53
3-6 Correlation of Participant Survey Responses . . . 54
3-7 Participants’ Preferred Concept Generation Method . . . 55
3-8 Participants’ Preferred Concept Generation Method by Teamwork Pref-erence . . . 55
3-9 Participants’ Preferred Concept Generation Method by Gender . . . . 56
3-10 Comparison of Quantity per Person per Group to Constraint, Concept Generation Method, and Task Variations . . . 60
3-11 Comparison of Quantity per Person per Group to Combined Constraint and Concept Generation Method Variations . . . 60
3-12 Comparison of Quantity per Person per Group Split by Task . . . 61
3-13 Comparison of Variety per Group to Constraint, Concept Generation Method, and Task Variations . . . 63
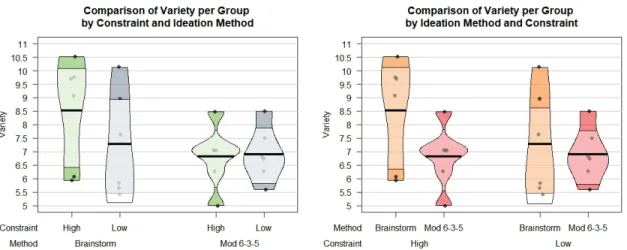
3-14 Comparison of Variety per Group to Combined Constraint and Con-cept Generation Method Variations . . . 64
3-15 Novelty Scores per Group . . . 65
3-16 Comparison of Novelty Scores by the Level of Constraint, Concept Generation Method, and Design Task . . . 67
3-17 Pairwise Comparison of Novelty Scores by Constraint and Concept Generation Method . . . 67
3-18 Pairwise Comparison of Novelty Scores by Design Task . . . 68
3-19 Pairwise Comparison of Novelty Scores for Task #1 . . . 68
3-20 Pairwise Comparison of Novelty Scores for Task #2 . . . 69
3-21 Quality Scores per Group . . . 71
3-22 Comparison of Quality Scores by the Level of Constraint, Concept Generation Method, and Design Task . . . 72
3-23 Pairwise Comparison of Quality Scores by Constraint and Concept Generation Method . . . 73
3-24 Pairwise Comparison of Quality Scores for Task #1 . . . 73
3-25 Pairwise Comparison of Quality Scores for Task #2 . . . 74
3-26 Comparison of Creativity Score per Group by Constraint and Method 75 3-27 Comparison of Creativity Score per Group by Constraint and Method for Task #1 . . . 76
3-28 Comparison of Creativity Score per Group by Constraint and Method for Task #2 . . . 76
3-29 Correlation of Group Performance and Characteristics . . . 77
3-30 Correlation of Group Performance and Characteristics for Brainstorm-ing Method . . . 78
3-31 Correlation of Group Performance and Characteristics for Modified 6-3-5 . . . 80
3-32 Correlation between Novelty and Quality . . . 81
3-33 Group 1A Sketch Model . . . 82
3-34 Group 1B Sketch Model . . . 83
3-35 Group 1C Sketch Model . . . 83
3-36 Group 2A Sketch Model . . . 83
3-37 Group 2B Sketch Model . . . 84
3-38 Group 2C Sketch Model . . . 84
3-39 Group 3A Sketch Model . . . 84
3-40 Group 3B Sketch Model . . . 85
3-42 Group 4A Sketch Model . . . 85 3-43 Group 4B Sketch Model . . . 86 3-44 Group 4C Sketch Model . . . 86 3-45 Overview of the Type of Sketch Models Created & Groups which began
Sketch Model with Initial Idea Sketches . . . 88 3-46 Comparison of Types of Sketch Models created based on Starting with
an Initial Sketch . . . 88
4-1 Comparison of Ideation Metrics by Constraint . . . 90 4-2 Comparison of Ideation Metrics by Concept Generation Method . . . 92 4-3 Comparison of Ideation Metrics by Design Task . . . 95
List of Tables
1.1 Definition of Process, Method, Technique, and Tool . . . 19
1.2 Metrics for Creativity and Ideation Effectiveness . . . 27
2.1 Design Study Test Matrix . . . 37
2.2 Scoring Rubric for Requirement Satisfaction Feasibility . . . 49
2.3 Scoring Rubric for Technical and Implementation Feasibility . . . 50
3.1 Examples of Participant Written Responses about Ideation Methods . 56 3.2 Summary of Non-Redundant Quantity Results per Group . . . 59
3.3 3-Way Type II ANOVA for Quantity . . . 59
3.4 90% Bootstrapped BCa Confidence Intervals for Quantity . . . 59
3.5 Number of Branches at Each Conceptual Stage for Task #1 . . . 62
3.6 Number of Branches at Each Conceptual Stage for Task #2 . . . 62
3.7 Summary of Variety Scores per Group . . . 63
3.8 3-Way Type II ANOVA for Variety . . . 64
3.9 90% Bootstrapped BCa Confidence Intervals for Variety . . . 64
3.10 Summary of Novelty Scores per Group . . . 66
3.11 Results for Task #1 Novelty Scores Pairwise Comparison Tukey Test 69 3.12 Type II ANOVA for Task #2 Novelty Scores . . . 70
3.13 90% Bootstrapped BCa Confidence Intervals for Task #2 Novelty Scores 70 3.14 Summary of Quality Scores per Group . . . 71
3.15 Results for Quality Pairwise Comparison Tukey Test . . . 73
3.16 90% Bootstrapped Basic Percentile Confidence Intervals of Quality for Brainstorming vs. Modified 6-3-5 . . . 74
3.17 Sketch Model Summary by Group . . . 87
A.1 Prominent Design-Related Journals . . . 111
A.2 Prominent Professional Design-Related Societies . . . 112
Chapter 1
Introduction & Background
“Our potential is limited only by the quality of our ideas. What we become as individuals, companies, and nations depends primarily on our ideas and our ability to realize them.”
Douglas Graham & Thomas Bachman Ideation: The Birth and Death of Ideas
1.1
Introduction
1.1.1
Motivation
For the last 6 years, I have worked as an engineer and designer for naval systems at the Naval Undersea Warfare Center Division Newport (NUWCDIVNPT). NUWC-DIVNPT provides research, development, test and evaluation, engineering, analysis, and assessment, and fleet support capabilities for submarines, autonomous underwa-ter systems, undersea weapon systems, and other emerging technologies in support of undersea warfare [1].
My work at NUWCDIVNPT has given me an astute understanding of the design process that are prescribed and practiced by engineers and designers in such a highly stimulating, yet bureaucratic government environment. My experiences and observa-tions of both the successes and shortfalls of the naval systems acquisition and design process are the impetus for this research. I strongly maintain that how we design is just a important as what we design, and if we can design with a better process than we can build better products. It is my aspiration that this research can begin to improve how NUWCDIVNPT and the Navy perceives design research and conducts concept development to provide more innovative and effective solutions for the warfighter.
(DoD) as a whole, are encouraged to be innovative and creative to solve some of the most complex and difficult technical problems, from planning tactical operations to developing advanced warfighting systems. The Department of the Navy views innovation and creativity as a priority in order to accelerate advanced capabilities to the fleet and keep pace with the rapidly changing technological environment. In 2014 the Secretary of the Navy established his Defense Innovation Initiative stating that “. . . we must find new and creative ways to sustain, and in some areas expand, our advantages even as we deal with limited resources [2].” As a result of this initiative, in 2015 the Secretary of the Navy released the Department of the Navy Innovation Vision which provides guidance for how the Navy can be more innovative [3]. In this document the Secretary of the Navy recognizes that “cumbersome processes” are the nature of how the Navy does business but, “we must never allow them to constrain our ability to think and innovate.”
While the Secretary of the Navy and other senior leaders promote an admirable vision, in practice Navy engineers and designers are still subject to a myriad of design re-quirements and constraints due to regulations, policies, and limited resources. These constraints typically relate to one of the following categories: performance, geome-try, environment, safety, system interface, security, cost, and time. Because naval systems can be incredibly complex with many requirements, often only a limited number of design alternatives are considered during the concept development stage. Additionally, concept generation activities are mostly limited to unstructured and unfacilitated individual or group brainstorming. This led me to question whether there was a better way to generate concepts in a highly constrained design problems, like those commonly encountered in the Department of the Navy.
A review of existing literature and research, which will be discussed further, reveals that while there is a substantial body of work on product development processes, design research, ideation methods, and even the use of constraints for design evalu-ation and optimizevalu-ation, there is lack of research to show how constraints influence ideation effectiveness and creativity. This research seeks to understand the relation-ship between design constraints and concept generation methods in order to support innovation and creativity in the design of complex systems. With improved under-standing of the design constraints that either benefit or impede the ideation process, better design tools and methods can be developed to foster better concepts earlier in the design process. While this study was conducted with the Navy in mind, its findings can be applied to any area or discipline.
1.1.2
Framework
The research presented in this thesis investigates and discusses how creativity can be increased in early concept development of a highly-constrained design project. To that end, this work is divided into four chapters. This chapter, Chapter 1, will explain
the motivation and objective of this research, as well as provide background on the previous work done in the areas of product development, concept generation, and creativity. The goal of Chapter 1 is to convince you, the reader, that the research questions to be addressed are valuable to the design community and fills a gap that has not previously been addressed in literature. Chapter 2 will discuss the design study that was conducted to test the research hypotheses. The goal of Chapter 2 is to explain the experimental methodology and how data was collected and evaluated. Chapter 3 will present the experimental results from the study. The goal of Chapter 3 is to provide robust analysis on the collected data to glean any significant trends or findings. Chapter 4 will discuss the results from the design study, conclusions, and recommendations for future work. The goal of Chapter 4 is to present what was learned from the design study and how these lessons could be applied to future projects.
1.2
Thesis Objective
The objective of this thesis research is to investigate the influence of design constraints and requirements on early stage concept generation and ideation processes. The relationship between constraints and concept generation methods will be studied by measuring the resulting ideation effectiveness metrics from several design studies, which will be presented in more detail in Chapter 2. At this point, it will suffice to say the four metrics that are traditionally used to measure ideation effectiveness are: quantity, quality, novelty, and variety.
The key research questions to be addressed are the following:
Q1. Do strict requirements help or hinder innovation and creativity, as measured by ideation effectiveness metrics?
There are differing opinions on the value of requirements and constraints in design. Requirements may produce more novel ideas that would not have been thought of otherwise, yet they could also prevent the pursuit of a novel, but viable, solution. Due to the lack of quantitative data in existing research ad-dressing this question, the results will be interesting to investigate.
Q2. In a highly constrained design problem, which concept generation method is more effective in generating creative ideas?
Previous work has shown that formal and structured ideation methods tend to perform better over informal ad-hoc methods. However, it is unknown whether these same results will hold true for a highly constrained design problem.
Q3. How can rapid prototyping be integrated into the ideation process to quickly evaluate concept feasibility?
With the advent of new manufacturing processes and materials, rapid proto-typing is a particular area of emphasis for the Navy to expedite delivery of products to the fleet. However, within an organization where prototypes are often reserved as the final deliverable for a project, it is interesting to explore how simple prototypes could be used early in the design process at the concept generation and evaluation stages.
The following hypotheses will be tested:
H1. Design problems with more constraints will result in ideas that score lower on quantity and variety, but higher in novelty and quality as compared to design problems with no constraints.
Because constraints restrict the potential design trade space, it is expected that the total number of ideas and the variety of ideas will be negatively impacted. However, in order to satisfy the imposed constraints, it is expected that there will be more unique ideas that are still realistic, which will increase novelty and quality scores.
H2. A formal concept generation method will result in ideas that score higher on all ideation metrics as compared to an unstructured concept generation method.
Due to previous research, it is expected that a formal and structured concept generation method will result in increased performance on quantity, variety, novelty, and quality for both high and low constraint variations. Especially in a highly constrained design problem, it anticipated that a formal concept generation method will perform better at fostering ideas when the problem seems more difficult.
H3. Rapid prototyping with simple materials can benefit the initial con-cept generation stage by providing early feedback and evaluation. Previous research and experience has shown that rapid prototypes, even simple sketch models, have great value during concept development. While prototypes will not be used initially to generate ideas in this study, it is expected that “quick-and-dirty” prototypes can offer value in evaluating and refining early concepts.
1.3
Ideation and the Design Process
1.3.1
What is design?
To some, design is a creative artistic endeavor, to others it is a systematic process, and then there are those who view it as the skillful application of technical knowledge
to a problem to get a desired outcome. Design can refer to an action, an artifact, a methodology, a profession, or a discipline of study. My goal is not to fully describe or explain what design is or is not, as there are many excellent books and literature on the topic. For our purposes, it will suffice to define design as creation with intention or purpose. Intention implies that there is thought, planning, and rationale behind every designed object or artifact; in essence design requires a designer. There are no modifiers or caveats on what is creation; anything that requires human involvement to plan, analyze, develop, build, or construct all falls within the purview of design. Thus it is no surprise that the design field is so diverse and inter-disciplinary, ranging from engineering design to interior design.
Considering the definition of design, a design problem, then, is a problem which requires design to solve; in the same way that you might say a math problem requires math. In other words, a design problem is a perceived gap between an existing situation and a desired future goal, which requires a carefully crafted solution [4]. Design problems are typically not deterministic, meaning that there is often no one right answer. There could be many potential solutions to a design problem, yet each may be a trade-off between various desired effects or parameters. Due to the complexity of design problems, it is helpful to follow a design process in the pursuit of an appropriate solution.
Design has been the subject of academic and professional research for several decades. Design research is a broad term which generally refers to the study of design theory, processes, methods, tools, and techniques, which can be applied to various disciplines from engineering to architecture to art. (See Table 1.1 for a description of each of these terms adapted from Dr. Alex Gray [5] and the Oxford Dictionary [6, 7, 8, 9].)
Table 1.1: Definition of Process, Method, Technique, and Tool
Term Definition Example
Process
A series of systematic steps to achieve a particular design goal, typ-ically being the successful develop-ment of a product or solution.
The design process, a company’s product development process, Navy Acquisition, Systems Engineering
Method
The way in which design alternatives are explored, understood, analyzed, and selected for a given design pro-cess.
Divergent and convergent think-ing, set-based design, prototypthink-ing, model-based systems engineering
Technique
A particular way to execute a task or function in the design process or method.
Brainstorming, mind-mapping, group voting, focus groups, decision matrix
Tool
Supports design methods and tech-niques by providing useful informa-tion to enable design decision mak-ing.
Modeling and simulation, optimiza-tion, engineering analysis
Design research has been supported by many societies, academic conferences, and journals since the 1960’s, though there has been increased interest since the late 1980’s and 1990’s. While this area is considered new compared to other fields of study, like physics or biology, design research has since become recognized as an established field of scientific study and inquiry. A list of some of the prominent design societies, conferences and journals is provided as a useful reference in Appendix A.
The goal of design research is the understanding and development of all aspects of design knowledge from cognition and philosophy, to methods and tools, from research theory to practice. Design research covers a broad range of topics [10] including, but not limited to:
∙ Theory and Research Methods ∙ Design Processes
∙ Information and Knowledge ∙ Design Innovation
∙ Systems Engineering
∙ Engineering Design Practice ∙ Design Methods
∙ Organization and Management ∙ Design Support Tools
∙ Human Behavior ∙ Sociotechnical Issues ∙ Industrial Design ∙ Design Education
As part of the design process, ideation related research often falls into this larger cat-egory of design research. The underpinning premise of most ideation related research is that if the process of generating and evaluating concepts and ideas can be better understood and improved through methods, techniques, and tools, then the resulting final product will be improved as well.
1.3.2
What is the design process?
Since the 1960’s, design and development processes have been studied, analyzed, and modeled by academic scholars. A common product development process, originally proposed in 1995 by Urlich and Eppinger [11], is shown in Figure 1-1. This process proposes six development stages through which the designer would ideally progress linearly: Planning, Concept Development, System-Level Design, Detail Design, Test-ing and Refinement, and finally Production Ramp-Up. At the completion of each stage, there is a milestone or gate review where management provides the design team with the approval to move forward to the next stage. While not shown ex-plicitly in the chart, there is an understanding that in industry, design is rarely so dogmatic and there will be lots of iterations and “do-overs” along the way.
The design process generally encompasses product development stages from concept development through testing and refinement. The concept development stage of the
Figure 1-1: Urlich and Eppinger’s Product Development Process (reprinted from [11])
design process requires three important activities: concept generation, concept eval-uation, and concept selection. All of these activities can happen simultaneously as new concepts and ideas are generated as a result of analysis or testing of a selected candidate concept. The goal at the end of this stage is to select the appropriate concept to pursue for further detailed design. The first of these activities, concept generation is sometimes referred to more broadly as idea generation, or ideation.
Variations of the product development process are used by industries around the globe and even correspond with the acquisition process used by the Navy, shown in Figure 1-2, and the systems engineering process [12, 13]. The design process has also been diagrammed in many ways, as shown in Figure 1-3 thru Figure 1-6. This is not intended to be an exhaustive list, but rather to illustrate the variety of design processes that exist. No matter the process details or specific design discipline, all design processes contain some version of concept generation or ideation. Hugh Dubberly’s How Do You Design? A Compendium of Models [14], Stanford’s d.school design process gallery [15], and Marc O’Brien’s design thinking blog [16] are excellent resources to find other variations and representations of the design process.
Figure 1-2: Department of Defense Acquisition Process (reprinted from [17])
Figure 1-3: The Design Process taught by Stanford’s d.school (reprinted from [18])
Figure 1-4: The Design Process developed by Paris-Est d.school at Ecole des Ponts, adopted from IDEO (reprinted from [19])
Figure 1-5: The Jet Propulsion Laboratory Engineering Design Process (reprinted from [20])
Figure 1-6: The Double Diamond Design Process developed by Service Design Vancouver (reprinted from [21])
Figure 1-7: The Design Process developed by the Chicago Architecture Foundation (reprinted from [22])
1.3.3
What is ideation?
All of these design process models beg the question, “What is ideation and concept generation?” Simplistically, ideation is the creation of ideas, whereas concept gen-eration is the gengen-eration of concepts. While we could debate the psychological and linguistic differences between an idea and a concept, this is counter-productive and tangential to the goal of this work. In this research, the terms idea and concept may be used interchangeably as both represent a vague notion or early stage thoughts about functions or attributes of an object.
However, more specifically, according to Urlich and Eppinger, “A concept is a descrip-tion of the form, funcdescrip-tion, and features of a product [11].” Another researcher proffers that a “[c]oncept is defined as that which refers to the figure of an object, along with other representations such as attributes or functions of the object, which existed, is existing, or might exist in the human mind as well as in the real world [4].” In accor-dance with these definitions, this work will refer to an idea as a single thought which embodies one function of an entire concept, while a concept refers to a collection of ideas which provides a rough approximation of a potential design solution. These words are very similar, but it’s important to note that an idea is individual, while a concept is holistic. Thus, ideation is the creation of a single individual solution which meets a single function or need, whereas, concept generation is the culmination of all of these ideations to create a holistic concept.
emer-gent, much of which focuses on design theory [23, 24, 25], improved concept generation methodologies [26, 27, 28], concept evaluation and selection techniques [29, 30, 31, 32, 33], concept modeling and optimization tools [34, 35, 36, 37], and the understanding of group dynamics during the ideation phase [38, 39, 40].
1.3.4
Why does ideation matter?
Ideation early in the concept development phase is crucial in the development of any product as it determines a majority of the product’s functions, attributes and lifecycle cost [41]. Researchers generally agree that as much as 60-80% of a product’s cost is committed by the end of the conceptual design stage [42, 43, 44, 45, 46, 12], illustrated in Figure 1-8. Thus, the most effective way to reduce the cost of a product is during the concept development when there is maximum flexibility and the cost of design modifications is relatively low. According to Rush and Rajkumar, “Making a wrong decision at this stage is extremely costly further down the development process. Product modifications and process alterations are more expensive the later they occur in the development cycle [45].” If a majority of the cost of a product is already committed or built-in to the design during the concept stage, then it is vastly important to generate and select the best concept to further develop. Therefore, ideation and concept generation are foundational to the design process and greatly influence a product’s success.
Figure 1-8: Cost Commitment Curve from Rush and Rajkumar (reprinted from [45])
1.4
Ideation, Creativity, and Innovation
Creativity is “the ability to generate novel ideas, as well as the ability to think in original ways. . . It can also be defined as the ability to come up with a unique approach to create a new product, whether it is a piece of music, a poem, a work of art, or a scientific theory [47].” It is implied here that creativity is a positive attribute and it results in works that are seen as useful or valuable. Thus, creativity refers to the ability to generate something new, original, novel, or unexpected, but in a useful or beneficial way. George, in accordance with other researchers [48], states that “both novelty and usefulness must be present for an idea to be considered creative [49].”
Innovation is “the process of developing and bringing to market new products, ser-vices, ideas, or solutions to problems. . . For an invention to be an innovation, it must be introduced into the marketplace and become generally accepted [50].” Thus, in-novation refers to the implementation and acceptance of a creative solution.
Taking these definitions together, creativity is a required element of innovation, in the sense that both refer to the development of new things. The newness of an object is not necessarily a universal measurement, but rather based upon the perception of the creator, observer, or the adopter of the object [51]. Describing an idea, process, or product as creative is a positive affirmation of novelty, originality, and usefulness. Describing the same idea, process, or product innovative not only assumes creativity, but also assigns value, quality, or desirability, because it is worth being accepted and adopted in the marketplace or society.
Creativity is important because “[v]ery fundamentally, without creativity there would be no new inventions, sub-optimized solutions would dominate our world, and there would be little change from year to year [52].” In essence, creativity is important because it gives rise to new ideas. “Ideas are important because they are the source of every aspect of human endeavor. Our potential is limited only by the quality of our ideas. What we become as individuals, companies, and nations depends primarily on our ideas and our ability to realize them [53].” Creative ideas are the source of innovation which is critical to entrepreneurial success, technological progress, and societal change. Management of creativity and innovation within large organizations is a popular topic of study [48, 54], though it is outside the scope of this research.
If the goal of creativity is to generate novel and useful ideas, then ideation effectiveness could be used as a measure of creativity. The Torrance Tests of Creative Thinking is a common creativity test where creative individuals score high on the four different metrics [55]. These creativity metrics are consistent with the metrics for ideation effectiveness proposed by Shah, Smith, and Vargas-Hernandez [56] as seen in Table 1.2 below which compares these metrics.
While ideation effectiveness is generally meant to determine the “goodness” of an ideation method, it is proposed that an ideation method which scores high on all
Table 1.2: Metrics for Creativity and Ideation Effectiveness
Torrance Creativity Metrics Ideation Effectiveness Metrics Fluency. The total number of interpretable,
meaningful, and relevant ideas generated in response to the stimulus.
Quantity. The total number of ideas gener-ated.
Flexibility. The number of different cate-gories of relevant responses.
Variety. A measure of the explored solution space during the idea generation process. Originality. The statistical rarity of the
re-sponses.
Novelty. A measure of unusual or unex-pected an idea is as compared to other ideas.
Elaboration. The amount of detail in the responses.
Quality. A measure of the feasibility of an idea and how close it comes to meet the design specifications.
of these metrics is also indicative of high creativity. Ultimately, an ideation method which assists the thinker to fluently and divergently consider more of the design space and combine disparate thoughts in unexpected yet feasible ways, will also increase creativity of the ideas generated.
1.5
Ideation and the Influence of Constraints
A constraint is a limit on any design variable or factor which narrows the potential design space. These constraints bound the design solution to that which is desired by a user or stakeholder, possible given available technology, or feasible given project resources. Constraints are also sometimes referred to as requirements, needs, or specifications [12].
Constraints provide a framework for designers to explore the trade-space of a solution; they help define what the solution can be and what it cannot. Raney and Jacoby [57] eloquently describe this role of constraints for designers: “Designers are inspired by constraints: what they aren’t afforded actually gives them something to work with. If a product can only cost a certain amount of money, the designer must make different choices of what materials to use; if a website must service millions of users, that will influence how it is designed. Constraints are a critically-important stake in the ground, as they create an agreement around what exactly is being designed.” Similarly, Lawson considers constraints to be an asset to the designer as they can sometimes “determine the whole form of design” and are the “very essence of the special, and possibly unique, circumstances which make a design different [58].” When applied appropriately, these design practitioners would agree that constraints and boundaries actually help designers to be more inventive and creative in their solutions. Indeed, design constraints are also especially useful in developing computational or optimization tools for concept exploration and evaluation [59, 60].
However, constraints are paradoxical - no constraints at all might make a designer feel lost without a starting point, but too many constraints may prematurely force a single solution. Perhaps you have experienced this dilemma in the common scenario of asking a group of friends, “Where do you want to eat for dinner?” only to receive the resounding response “I don’t know, anywhere is fine with me.” Or perhaps you have that friend who says, “Anywhere is fine with me, as long as it’s not seafood, barbecue, or Mexican, all the food is locally sourced, there are peanut-free and gluten-free options, entrees are less than $10, and it’s within walking distance.” Too many choices can be crippling and lead to prolonged indecision, but too few choices can result in an inadequate option for everyone. In both cases, constraints could result in a lack of creativity and imagination where we finally decide to “just have dinner at the same place we ate last night.”
On the other hand, some designers thrive in this boundary-free, limitless environment where they are free to be as imaginative and wild as possible. Some researchers would argue that good ideas are formed when the mind is free to wander and make serendipitous connections [61]. Carter similarly claims that because ideation requires imagination, “[t]o effectively develop ideas, there should be no rules. There should be no limits on the creative process [52].”
Clearly, there is still debate amongst researchers and practitioners on whether creativ-ity or concept generation is limited in some way due to design constraints. Specific research on the use of constraints in early stage design has been underway for several decades often investigating how to model constraints [60, 59] or use optimization to determine the best concept solutions in a specific design problem [62, 63, 64]. A study conducted with students in a resource constrained prototyping environment showed inconclusive results about whether the timing of when the resource constraints were introduced had any effect on the concepts generated [65]. In regards to timing, a study investigated time constraints during concept generation and found that time pressure tended to increase productivity during ideation sessions [66]. Another study investigated how the quantity, change rate, and risk in design requirements relate to project success in student projects [67]. None of these studies looked specifically at the impact of constraints in the design problem itself on ideation effectiveness. There is clearly a noticeable gap in research that addresses quantitatively how design con-straints, that is, constraints within the design problem, not just resource limitations, influence the concept generation process.
1.6
Current Ideation Methods
There are a myriad of ideation methods and techniques including well known ones such as brainstorming, sketching, and rapid prototyping, as well as obscure ones like Design by Analogy [68, 69], Design by Function [70], mind-mapping with WordTrees [27], and Theory of Inventive Problem Solving (TRIZ) [71]. For certain well-defined
problems, there may even be mathematical and physics-based models to help the designer explore various options at the same time [72]. For this effort, only brain-storming, brainwriting, sketching, and prototyping will be discussed and investigated.
1.6.1
Group Brainstorming
Concept generation methods have historically been dominated by group brainstorm-ing, a method presented by Alex Osborn in the 1950’s [73]. Brainstorming is an a free-form approach where participants freely share and discuss their ideas verbally as they think of them, typically in a focused exercise. The key premise of brainstorming is that the more ideas that can be generated, the higher the likelihood that you’ll come across a good idea, i.e. quality is highly correlated with quantity. Osborn maintained that “Creative success is usually in ratio to the number of alternatives thought up [74].” Additionally Osborn believed that the collective power of the group allowed for increased stimulation and combination of ideas, which improved the outcome. Osborn introduced rules during brainstorming sessions to maximize the quantity of ideas produced: 1) Go for quantity, 2) Withhold criticism, 3) Welcome wild ideas, and 4) Combine and improve ideas.
However, as shown by many researchers since its introduction, brainstorming does have disadvantages, including productivity loss due to group interaction, social loaf-ing, evaluation apprehension, and design fixation [75]. Studies by Paulus [76] and Nijstad [77] have validated that groups generate fewer ideas due to production block-ing than nominal groups despite the fact that those in groups felt more satisfied with their work. However, Henningsen and Henningsen showed that while nominal groups produce more ideas than groups in a short amount of time, groups can continue to produce ideas for a longer period [78]. Even strong supporters for group concept generation admit the challenges with the method and provide varied suggestions for how to better facilitate group brainstorming sessions and deal with the strong per-sonalities that may hinder the creative process [79, 80]. Some go so far as to claim that brainstorming should only be an individual activity and groups hinder creativity [81].
Alternate brainstorming techniques have been proposed and tested by researchers to reduce these negative side-effects of group brainstorming including providing a large variety of stimulus ideas, taking short breaks during ideation activity, using a trained facilitator, interspersing group brainstorming with individual brainstorming, and al-lowing for dissent in the group [75]. Smith and Linsey suggest that changing your environment or context, redefining the problem in a different way, and using analo-gies can be effective ways to overcome fixation effects [82]. One study where hybrid groups alternated between group brainstorming and individual brainstorming demon-strated increased performance over only group brainstorming or nominal groups [83]. Also, allowing and encouraging debate and criticism during group brainstorming has
been shown to increase the quantity of ideas produced over traditional brainstorming groups [84].
Group brainstorming, despite some of its drawbacks, will remain a staple ideation method and does provide good results when implemented correctly [85]. Because there are no special tools nor intensive set-up, it is easy to implement anywhere. Group brainstorming mimics our natural human inclination to converse with others about ideas, get feedback, or ask questions. While specific techniques can help focus these interactions and make them more effective, “the most productive tool for generating good ideas remains a circle of humans at a table, talking shop [61].”
1.6.2
Brainwriting and Collaborative Sketching
As an effective alternative to group brainstorming, brainwriting and collaborative sketching are popular choices. Brainwriting, in particular, has been promoted on various blogs and online articles [86, 87, 88, 89]. Both methods essentially require that you write or sketch all of your ideas and communicate them to the group in a non-verbal exercise, rather than shout them out from around a table. These methods have been developed and gained popularity because they “eliminate production blocking, reduce social loafing, and encourage careful processing of shared ideas [90].” However, in contrast to traditional group brainstorming, these methods are structured and require “a greater temporal, personal, group, and logistical investment [91].”
While brainwriting includes various techniques [92] (e.g. pool technique, 6-3-5 method, electronic brainstorming), in general, several studies have concluded that brainwrit-ing outperforms verbal brainstormbrainwrit-ing groups and nominal groups in terms of the quantity of ideas generated [93, 91, 90]. Additionally, one study suggested that elec-tronic brainstorming generates results in more ideas than use a pen-and-paper pool technique [93]. However, there are still research questions regarding how and when to use brainwriting over brainstorming, taking into account factors like individual personalities, group diversity, organizational culture, and the need for high quality ideas [91].
One particular brainwriting technique of interest is called Method 635, or simply 6-3-5, which was introduced in 1969 by Bernd Rohrbach [41, 94, 95]. To implement this technique, six people sit around a table with a stack of paper and writing instruments. Each person silently generates three ideas over the course of five minutes and writes them on a separate pieces of paper, or in a single cell on one sheet of paper. The papers are then passed to the right for the next person build onto or use as inspiration to generate three new ideas for another five minutes. The rounds continue for 30 minutes until the papers return to their originator, i.e. a total of six rounds. If every person generates three new ideas each round, then it’s possible to generate 108 ideas in 30 minutes! This technique allows everyone to participate and build on each others’ ideas in a equitable atmosphere. Pahl claimed that 6-3-5 is advantageous
because it allows for ideas to be developed more systematically and reduces problems of group leadership, but unfortunately results in “[r]educed creativity by the individual participants owing to isolation and lack of stimulation in the absence of overt group activity [41].” However, there is other research to suggest that 6-3-5 results in higher ideation effectiveness over group brainstorming [96].
A common variation of brainwriting incorporates sketching rather than just text. Sketches and drawings have long been seen as important to visual thinking and con-cept generation process [95, 97, 98]. Designers use sketches as a primary means to express shape and form of a concept as they portray visual and spatial information in a way that words and text cannot. Due to this, sketches are effective explanatory communication tools [99]. In fact, sketch quality has been shown to correlate posi-tively with the perceived quality and creativity of the concept [100]. Much research is conducted to develop electronic sketching tools that allows designers to better col-laborate and/or convert their sketches into useful information for analysis [101, 102].
In order to combine the benefits of both 6-3-5 and sketching, many practitioners and researchers merge the techniques so that 6-3-5 incorporates sketching rather than only text. This technique is known as Collaborative Sketching, or C-Sketch. C-Sketch has been shown to result in higher quality, novelty, and variety over 6-3-5 [103]. Another research study suggests that using a modified C-Sketch technique produces better results than using traditional brainstorming approach on all ideation metrics [104]. However, more ideas are generated by using a combination of various techniques rather than simply using C-sketch alone [27].
1.6.3
Prototypes and Models
While traditionally, prototyping may be seen as the activity performed near the end of the design process, many design researchers and design practitioners promote the value of prototypes and models during the early concept development stage. A model is the general term used to refer to any representation or simulation of a design artifact. This artifact may be a tangible physical object or it may be an intangible process or software. As such, models can be digital or physical, two-dimensional or three-dimensional, material or analytical. Models may embody some form or they may be purely mathematical. A prototype is a specific type of model and refers to a representation of a design artifact which is a precursor to the final production product. Prototypes are incomplete realizations or embodiments of a design idea intended to serve as a tool for exploration, visualization, communication, and evaluation.
Insights from the automotive industry reveal that early prototypes help design teams to explore different concepts and reduce technical uncertainty, communicate with stakeholders, and gain a better understanding of product requirements [105]. Fur-thermore, Raney and Jacoby claim that the process of prototyping and building is part of decision-making. “As [designers] build and learn, something interesting happens:
through the iterations, the best option often reveals itself and other less-appropriate options fall by the wayside. By trying things, designers navigate large decisions through smaller trials [57].” While there is a place for analysis, simulation, and rig-orous concept evaluation, sometimes a quick mock-up of a concept will easily reveal which ideas work and which do not. Similarly, Coughlan, Suri, and Canales agree that “[b]uilding prototypes helps a group to move beyond talking and thinking about a problem to actually making progress toward action. . . rather than discussing, ana-lyzing, or hypothesizing in abstract terms before acting, creating tangible expressions of ideas early enables organizational thinking to develop concretely through action [106].” The iterative prototyping process is a powerful tool for learning, deciding, communicating, and refining ideas and concepts. All of these factors illustrate that prototyping is just as critical in the early concept development stages as in detailed design and testing.
The term “prototype” is often used to refer to some tangible object or product, but it may also be used to refer to intangible objects like software or code. Prototypes can be at various levels of fidelity and resolution depending on its goal. According to Tim Brown of IDEO, “Prototypes should only command as much time, effort, and investment as are needed to generate useful feedback and evolve an idea [107].” Prototypes can refer to a wide range of semblance to the final product, ranging from “quick and dirty” prototypes made of cardboard or foam to explore an object’s form to high fidelity “alpha” or “beta” prototypes manufactured with final design materials to conduct first article testing [106].
Although, prototypes can be quite simple and made of basic craft materials, they still provide value to the design team. “With prototypes made from inexpensive and accessible materials—such as paper or card, foamcore, or wood models—we can explore many different possibilities with respect to physical form, human interactions, and how mechanical elements might work [106].” These low fidelity prototypes are often called “mock-ups” or “sketch models.” A sketch model allows the designer to explore certain aspects of the design for low cost and low risk early in the process.
While it’s commonly agreed that prototyping is beneficial in overall concept develop-ment, prototyping, particularly sketch modeling, can also assist in the act of concept generation. One research study suggests that for expert designers, rapid prototyping with blue foam produced a higher quantity and novelty of concepts than sketching and computer-aided design in the same amount of time [24]. In this case, the design-ers of the study were building quick mock-ups of their ideas while they were thinking of them; maybe even not yet fully formed until they started to cut foam. Working with physical, tangible, and concrete materials can inspire ideas and concepts in a way that the thinking, writing, or sketching cannot.
1.7
Differentiation of this Research
Much of current ideation research focuses on evaluating methods and processes, with little focus on the design problem that is being performed by the participants. This is emphasized by the fact that in many cases undergraduate students are the participants in studies because it is part of their classwork. However, in a professional environment, finding the best solution to a design problem is the most important part of the process – not necessarily how that solution may have arisen. In many industries, and especially in the Navy, design problems can be large, complex, and messy; further complicated by constraints like cost, schedule, system interfaces, or rigid standards. In general, while creativity is encouraged at NUWC, technical engineering rigor to ensure that the design can meet all of the requirements is the priority.
While many early stage design strategies, like those previously discussed, have been shown to be effective in simple product design applications, how might these tech-niques be applied to complex and highly-constrained system design to promote cre-ativity? Complex design problems require solutions from experienced engineers and are not well suited for undergraduate design or psychology students. Moreover, it is still unclear how formal concept generation methodologies are influenced by this type of constrained design problem.
In light of these deficiencies in previous research, the focus of this thesis differentiates itself in the following ways:
∙ Participants include practicing engineers and scientists from a variety of back-grounds and domain expertise, rather than students or novices as is typical in much of academic research.
∙ The design problems were carefully crafted to simulate the type of complex design problems experienced in industry, rather than simple test problems found in much of academic research.
∙ The constraints in the design problem are tested an independent variable, mean-ing that the number of design constraints are varied between study groups. This approach hasn’t been previously explored in academic research.
Chapter 2
Experimental Methodology & Results
“In the end a good design is one which respects all the constraints to some degree in a balance which is thought acceptable.”
Bryan Lawson How Designers Think
2.1
Experimental Methodology
In order to test out the hypotheses laid out in Chapter 1, a design study was conducted over four separate sessions. Participants in the study were formed into small groups of four people and asked to conduct three design tasks each using a different ideation method. Details of the design problems are discussed in Section 2.1.2 and details of the concept generation methods are discussed in Section 2.1.3. Each session consisted of three participating groups working simultaneously in order to minimize the time required to collect the necessary data. Each group worked on the same design problem using the same ideation method for ease of instruction. To minimize any cross-influence between groups, there were barriers between each group’s working area. The sessions were held at the Naval Undersea Warfare Center (NUWC) Rapid Innovation Center (RIC); a notional top view of the room’s layout is shown in Figure 2-1.
For the first two design tasks participants generated ideas and concepts for a given design problem. In order to test how constraints and concept generation methods are related, the number of constraints in the provided design problem and the ideation method were varied. Regardless of the design problem variant provided, participants used a group brainstorming method for their first task and then a modified 6-3-5 method for their second task. The first 30 minutes of the design task was devoted to only concept generation, where participants were asked to write down or sketch
Figure 2-1: Notional Layout of Rapid Innovation Center
as many ideas as possible in that time. An additional 15 minutes were devoted to concept evaluation and selection, where participants were asked to select their top three concepts and develop them further as time allowed. Concepts generated by the group were documented and collected for analysis and evaluation.
For the third and final design task, participants were asked to create a simple sketch model using basic craft materials (Figure 2-4) in 30 - 40 minutes of at least one aspect of their top concept from a design problem they already worked on. While this task is not directly comparable to the other two, it provided participants with a helpful learning exercise about a hands-on way to develop concepts which may have been unfamiliar. It is also interesting to note the participants’ feedback and preferences about this method compared to the others.
Participants received brief training (about 15 minutes) on how to perform each con-cept generation method before they completed their design task. Additionally, all participants were asked to complete brief pre-survey before the experiment and post-survey after the experiment to collect relevant biographical information, assess their current background knowledge and experience, and obtain feedback. The full sur-veys are provided in Appendix B. An entire session was four hours long with breaks between design tasks and time to provide feedback on the process.
2.1.1
Design Study Test Matrix
The design study also doubled as a training event, so it was important that par-ticipants learn about various ideation methods that they can use for other design problems they may encounter in their jobs. Thus each group practiced all three ideation methods, which progressed from familiar to unfamiliar. Groups first used brainstorming, then modified 6-3-5, and lastly sketch modeling. To minimize bias or carry over of ideas from the first design task to the second, groups worked on two different design problems. For the third design task participants conducted a sketch modeling exercise. As the primary goal was to introduce sketch modeling as an alternate concept generation approach, and due to limited time, one of the design problems was repeated.
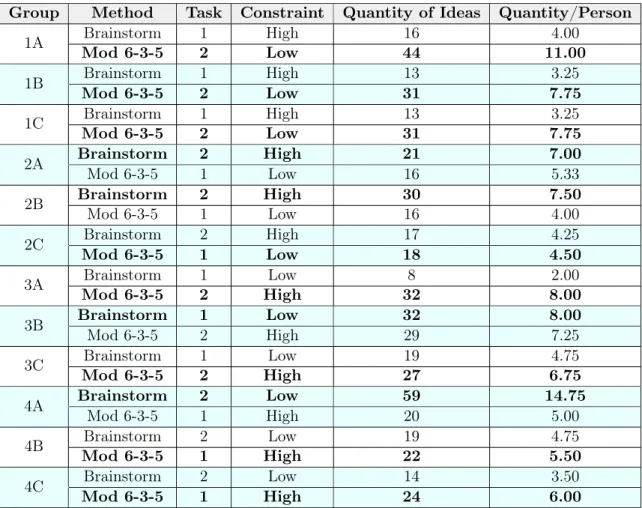
The entire experimental test matrix is shown in Table 2.1. Each design task variant (design problem and constraint level) was conducted twice by six different groups, so there are a total of twelve data sets per variant. While this may not be large enough to be completely conclusive, this is a sufficient data size to identify trends.
Table 2.1: Design Study Test Matrix
Task 1: Task 2: Task 3:
Control Method Formal Method Prototyping Method
(Brainstorming) (Modified 6-3-5) (Sketch modeling)
Session 1: Problem #1 Problem #2
Group 1A/1B/1C High Constraint Low Constraint Create a sketch
Session 2: Problem #2 Problem #1 model of at least
Group 2A/2B/2C High Constraint Low Constraint one aspect of a
Session 3: Problem #1 Problem #2 top concept from
Group 3A/3B/3C Low Constraint High Constraint Problem #1
Session 4: Problem #2 Problem #1
Group 4A/4B/4C Low Constraint High Constraint
2.1.2
Design Problems
Two different design problems were provided each group of participants. The design problems were intended to be complex enough that there could be many possible so-lutions, yet also general enough so that specific domain knowledge was not required to understand the problem statement. Additionally, while these design problems could be extrapolated to current design challenges in the Navy, they intentionally do not involve military or Navy specific knowledge to avoid any incoming biases from par-ticipants’ current work. The design problems had two different constraint variations — a low constraint variant and high constraint variant. The low constraint vari-ant included no additional imposed requirements. For the high constrained varivari-ant,
there were five constraints, each which fall into typical requirement categories: 1) Performance, 2) Geometry, 3) Environment, 4) Safety, and 5) System Interface.
A summary of the design problem with their constraints is listed below. The full design problem statements that were given as a handout to participants are provided in Appendix C.
Design Problem 1: How might an autonomous car be refueled without any human intervention?
∙ Performance: The time to refuel autonomously must take the same or less time than to refuel manually.
∙ Geometry: Existing gas stations should be able to implement the autonomous refueling system without major alterations.
∙ Environment : Due to the projected increase of electric vehicles, both gasoline-powered and electric vehicles must be accommodated.
∙ Safety: For safety concerns, manual refueling must still be accommodated as a back-up.
∙ System Interface: To minimize vehicle impacts, the existing fuel interface (i.e. fuel filler for a gasoline-powered vehicle or charge port for an electric vehicle) should not be altered.
Design Problem 2: How might a celebrity estate be protected and secured from intrusion of a small commercial drone?
∙ Performance: The drone must be detected from at least 100 yards away.
∙ Geometry: The drone must be prevented from entering within 50-yard range from the house.
∙ Environment : Due to frequent droughts in California, additional water cannot be employed for any security measures.
∙ Safety: Due to safety concerns, if the drone is disabled or destroyed, it must not injure nearby people or damage local structures.
∙ System Interface: Any exterior security equipment or components must not obstruct the visual appeal of the house and its surroundings.
2.1.3
Ideation Methods
The three ideation methods used consisted of traditional group brainstorming as the unstructured control method, a modified 6-3-5 method as a formal structured method, and sketch modeling as a prototyping method. Descriptions and previous research on these techniques were presented in Chapter 1.
Groups used traditional group brainstorming in their first design task because it is most familiar [108] and serves as a good baseline of comparison before learning new methods. There was no assigned facilitator, but groups could self-designate one if they chose. Groups were asked to capture each of their ideas on a separate piece of paper. A whiteboard could also be used if desired, though it was discouraged. Presented brainstorming instructions are shown in Figure 2-2.
Figure 2-2: Presented Brainstorming Instructions
While typically 6-3-5 involves six people who generate three ideas in six rounds of five minutes each, the method was modified so that four people generate three ideas (or as many as possible) in five rounds of six minutes each. This modification still provides 30 minutes of total generation time, but gives each participant more time each round, as well as provides an additional round to allow participants to see any comments or additions others made to their original ideas from the first round. While not required, it was also encouraged for participants to sketch their ideas. For these reasons, this technique is referred to as “Modified 6-3-5” or “Mod 6-3-5.” For this method, participants were also asked to use different colored markers for ease of evaluation. Presented Modified 6-3-5 instructions are shown in Figure 2-3.
Figure 2-3: Presented Modified 6-3-5 Instructions
For sketch modeling, the groups were provided with a variety of craft supplies and tools in order for groups to build quick mock-ups of their ideas. Groups were specifi-cally asked to build at least one sketch model to explore the appearance, operation, or user interaction of their concept. Materials provided included foam, foamcore, paper, wooden shapes, string, play-doh, springs, various fasteners and adhesives, and more (See Figure 2-4).
Participants were shown how to use a foam wire cutter, as this was a new tool to most. Participants were also encouraged to use any other materials or tools they could find if desired. Presented instructions are shown in Figure 2-5. The materials and time for the sketch modeling was not tightly controlled as this design task was intended to be a training exercise for qualitative observations.
Figure 2-5: Presented Sketch Modeling Instructions
2.1.4
Participants
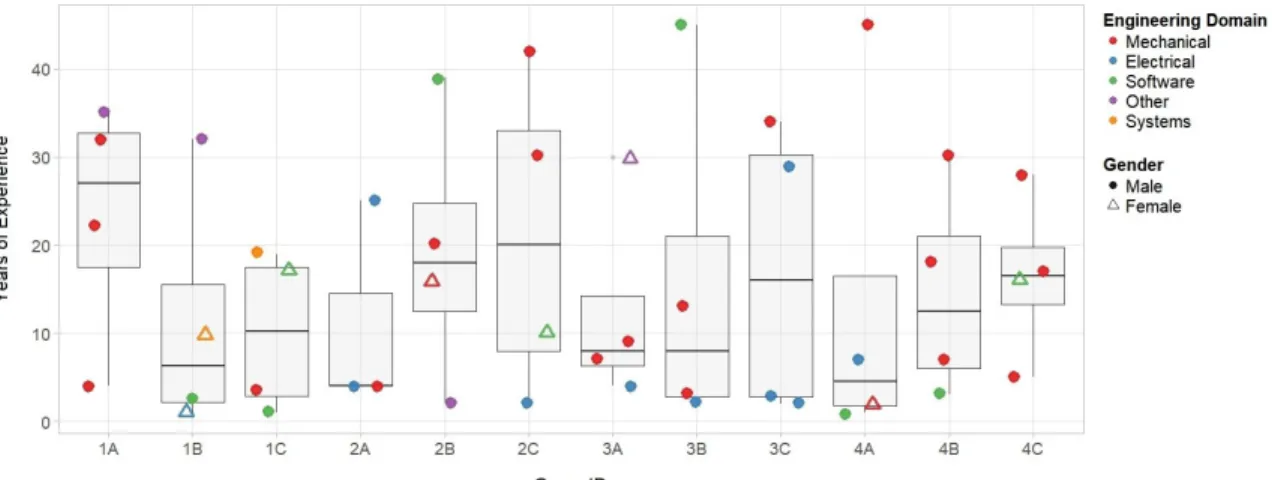
Participants were recruited via email amongst the engineers at the Naval Undersea Warfare Center Division Newport from the different technical departments. Par-ticipants were provided a charge number for their time. A total of 47 engineering professionals participated in the design study. (While 48 were needed so that each group could have four people, unfortunately, one participant did not show up for the session.) Thus, there were 11 groups of four participants and one group with three. There were 39 males accounting for 83% of the participants and 8 females accounting for 17% of the participants. While it was desired to have more female representation, these percentages are consistent with the overall professional workforce at NUWC as of 2014 [109]. All the participants represented different levels of experience and areas of expertise, as shown in the Figures 2-6 thru 2-7. A majority of the participants were mechanical engineers and had less than 10 years of experience.
To the maximum extent possible, groups were arranged so that there was sufficient diversity amongst all of the members based on their technical department, area of expertise, years of experience, and gender. While ensuring that each group had
Figure 2-6: Histogram of Participants’ Years of Experience
at least one female and similar average years of experience was difficult due to the availability of those who volunteered, each group did have representation from at least two domain areas of expertise. Seven of 12 groups had at least one female, where one group had two females. The cumulative years of experience per group ranged from 93 to 33 years and the average years of experience ranged from 23 to 10 years. See Figure 2-8.
Figure 2-8: Years of Experience per Group by Domain Expertise and Gender
2.2
Scoring Approach for Ideation Effectiveness
Met-rics
All generated ideas are evaluated on four different metrics: quantity, variety, nov-elty, and quality. Each idea or concept that was written or sketched was reviewed, counted, categorized, and scored by two evaluators. Potential solutions for the design problems consisted of multiple functions due to the problems’ complexity. Scored ideas represent an individual possible solution for a single function or aspect of the problem.
For example, Figure 2-9 shows a concept sketched for Design Task #2. In this figure, there are several ideas for both how to detect an incoming drone (i.e. cameras and audio) and how to disable the incoming drone (e.g. a counter-drone with a net or a paintball gun). In this case, there are four separate functional ideas which are counted: 1) Detecting an incoming drone with cameras, 2) Detecting an incoming drone with audio, 3) Disabling the incoming drone with a net, and 4) Disabling the incoming drone with a paintball.
Figure 2-9: Example of Concept for Task #2: Ideas for Detecting and Disabling an Incoming Drone
2.2.1
Quantity Score Measurement
Traditionally, ideation effectiveness is determined by simply measuring the quantity of unique ideas, as quantity has been shown to correlate with quality and novelty. Additionally, idea quantity is objective and simple to measure. Each individual idea for a given function that was written or sketched was counted. Duplicate ideas were removed from the data set. Because there were three people in one group and four in the remaining groups, the number of ideas per person provides a more comparable metric. In this case, quantity per group is calculated by the following formula:
Quantity = Number of non-redundant ideas/Number of people in group
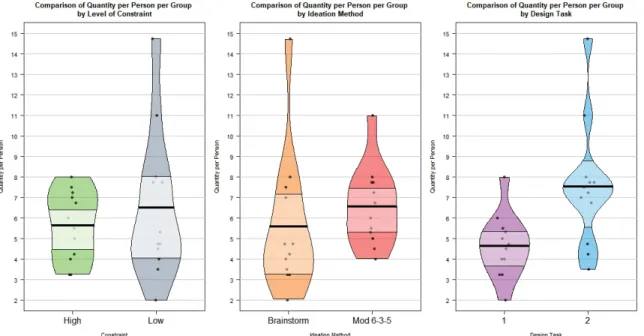
Results for quantity scores are provided in Section 3.2.2.
2.2.2
Variety Score Measurement
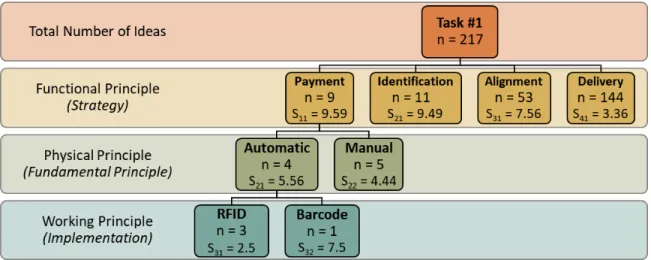
Variety is a metric which applies to the entire set of ideas generated and describes how much of the solution space was explored. To determine variety, a genealogy tree for each design task was developed based on all the ideas generated, which is provided in Appendix D. The genealogy tree categorizes all of the ideas into their
![Figure 1-6: The Double Diamond Design Process developed by Service Design Vancouver (reprinted from [21])](https://thumb-eu.123doks.com/thumbv2/123doknet/14447935.518094/23.918.243.680.638.962/figure-double-diamond-process-developed-service-vancouver-reprinted.webp)
![Figure 1-7: The Design Process developed by the Chicago Architecture Foundation (reprinted from [22])](https://thumb-eu.123doks.com/thumbv2/123doknet/14447935.518094/24.918.302.618.115.458/figure-design-process-developed-chicago-architecture-foundation-reprinted.webp)