aKaj Blennow and Henrik Zetterberg contributed equally to this work. *Corresponding author: Jens Kuhle, MD, PhD, Neurology,
Departments of Medicine, Biomedicine and Clinical Research, University Hospital Basel, Basel, Switzerland,
Phone: +41 (0)613287191; Fax: +41 (0)612654100, E-mail: [email protected]
Christian Barro, Tobias Derfuss and Raija Lindberg: Neurology, Departments of Medicine, Biomedicine and Clinical Research, University Hospital Basel, Basel, Switzerland
Ulf Andreasson, Åsa Sandelius, Victor Liman and Kaj Blennow: Institute of Neuroscience and Physiology, Department of Psychiatry and Neurochemistry, The Sahlgrenska Academy, University of Gothenburg, Mölndal, Sweden
Niklas Norgren: UmanDiagnostics, Umeå, Sweden
Henrik Zetterberg: Institute of Neuroscience and Physiology, Department of Psychiatry and Neurochemistry, The Sahlgrenska Academy, University of Gothenburg, Mölndal, Sweden; and UCL Insitute of Neurology, Department of Psychiatry and Neurochemistry, Queen Square, London, UK
Jens Kuhle*, Christian Barro, Ulf Andreasson, Tobias Derfuss, Raija Lindberg, Åsa Sandelius,
Victor Liman, Niklas Norgren, Kaj Blennow
aand Henrik Zetterberg
aComparison of three analytical platforms for
quantification of the neurofilament light chain in
blood samples: ELISA, electrochemiluminescence
immunoassay and Simoa
DOI 10.1515/cclm-2015-1195
Received December 2, 2015; accepted March 7, 2016; previously published online April 12, 2016
Abstract
Background: Neuronal damage is the morphological
substrate of persisting neurological disability.
Neurofila-ments (Nf) are specific cytoskeletal proteins of neurons
and their quantification has shown encouraging results
as a biomarker for axonal injury.
Methods: We aimed at comparing a widely used
con-ventional ELISA for Nf light chain (NfL) with an
electro-chemiluminescence-based method (ECL assay) and a
newly developed single-molecule array (Simoa) method
in clinically relevant cerebrospinal fluid (CSF) and serum
samples.
Results: Analytical sensitivity was 0.62 pg/mL for Simoa,
15.6 pg/mL for the ECL assay, and 78.0 pg/mL for the
ELISA. Correlations between paired CSF and serum
samples were strongest for Simoa (r = 0.88, p < 0.001) and
the ECL assay (r = 0.78, p < 0.001) and weaker for ELISA
measurements (r = 0.38, p = 0.030). CSF NfL measurements
between the platforms were highly correlated (r = 1.0,
p < 0.001). Serum NfL levels were highly related between
ECL assay and Simoa (r = 0.86, p < 0.001), and this was less
visible between ELISA-ECL assay (r = 0.41, p = 0.018) and
ELISA-Simoa (r = 0.43, p = 0.013). Multiple sclerosis (MS)
patients had significantly higher serum NfL levels than
controls when measured with Simoa (p = 0.001) but not
with the other platforms.
Conclusions: We found Simoa to be more sensitive than
ELISA or the ECL assay. Our results support the feasibility
of quantifying NfL in serum; the results correlate with the
more-established CSF NfL test. The highly sensitive Simoa
technology deserves further studies in larger patient
cohorts to clarify whether serum NfL could be used in the
future to measure disease severity and determine
progno-sis or response to treatment interventions in neurological
diseases.
Keywords: immunoassay; neurodegeneration;
neurofila-ment light chain; serum.
Introduction
Highly sensitive methods for detecting soluble
biomark-ers for neuro-axonal damage are urgently needed in
neu-rodegenerative diseases. Neurofilaments (Nf) are highly
specific major structural proteins of neurons consisting
predominantly of three Nf subunits: Nf light (NfL), Nf
medium (NfM), and Nf heavy (NfH) chains [1]. Disruption
to the axonal membrane releases Nf into the interstitial
fluid and eventually into the cerebrospinal fluid (CSF)
and blood. Therefore, blood Nf levels could potentially
be useful for both predicting and monitoring disease
pro-gression and for assessing the efficacy and/or toxicity of
future neuroprotective treatment strategies. Numerous
previous studies have demonstrated the presence of NfH
and NfL in CSF in a wide range of neurological diseases
[2, 3]; however, obtaining longitudinal CSF samples is
relatively invasive, precluding the broader clinical use
of Nf. In contrast, serial blood samples can be readily
collected; hence, reliable quantification of NfL in blood
would be a major stride towards a biomarker of the course
of neurodegeneration.
A commercially available ELISA (UmanDiagnostics
NF-light assay ELISA) uses two highly specific,
non-com-peting monoclonal antibodies (mAB47:3 and mAB2:1) to
quantify soluble NfL, but this assay is not recommended
for blood measurements by the producer [4].
Electro-chemiluminescence (ECL)-based assays are known to
be highly sensitive, exhibit a broad dynamic range, and
require small sample volume. We have recently
devel-oped an ECL immunoassay suitable for NfL
measure-ments in serum based on these mABs (ECL assay) [5].
Single-molecule array (Simoa) technology for digital
immunoassays has the potential to improve sensitivity
significantly further [6, 7]. The aim of this study was to
compare the ELISA and ECL assay for NfL with a newly
developed method based on Simoa technology using the
same set of antibodies in clinically relevant and matched
CSF and serum samples.
Materials and methods
CSF and serum samples
We selected pairs of CSF and serum samples based on previous serum NfL measurements with the ECL NfL assay: nine CSF and serum pairs with high (50–1800 pg/mL, high), eight with medium (5–15 pg/mL, medium), and seven with low ( < 4 pg/mL, low) serum NfL levels. In the group of patients with high NfL levels, four patients suffered from amyotrophic lateral sclerosis (ALS), three had Guillain-Barré syndrome (GBS), and one patient each had a major stroke or acute disseminated encephalomyelitis (ADEM). The group of patients with medium NfL levels consisted of three patients with multiple sys-tem atrophy (two Parkinsonian type and one cerebellar type), two patients each with non-infectious myelitis or stroke, and one patient with recurrent aseptic meningitis; the low NfL level group included four patients with tension-type headaches and one patient each with cryptogenic epilepsy, encephalopathy due to cannabis con-sumption and a radiologically isolated syndrome (RIS). In addition, we included nine CSF and serum pairs from patients with multiple sclerosis (MS) that had not been measured before. Six patients had a relapsing remitting disease course [median expanded disability sta-tus scale (EDSS): 6.5, interquartile range (IQR): 4.6–7.0, five patients with an acute relapse at sampling with onset of new symptoms within 30 days] and three were in the secondary progressive disease stage (median EDSS: 7.0, IQR: 6.5–7.5, three with acute relapse).
Samples were collected during routine diagnostic investigations as indicated by the treating physicians and collected and processed
at room temperature within two hours (Neurology, University Hos-pital Basel, Switzerland). Serum samples were spun at 2000 × g and CSF samples at 400 × g at room temperature for 10 min, aliquoted in polypropylene tubes and stored at –80 °C [8].
ELISA and ECL NfL assay
The NF-light assay ELISA was performed as described by the manu-facturer. The ECL assay [5] was slightly modified: Coating was done with 0.05 M carbonate-bicarbonate buffer (pH 9.6) at 4 °C. Nonspe-cific binding sites were blocked with 100 μL of TBS, containing 3% milk powder, per well for 1 h. We used 25 μL of TBS containing 1% milk powder, 0.1% Tween-20, and 600/300 μg/mL HeteroBlock® (Omega Biologicals, Bozeman, MT, USA) as sample diluent. Calibra-tors were prepared in TBS containing 1% milk powder, 0.1% Tween-20, and 300 μg/mL HeteroBlock®.
Simoa NfL assay
The Simoa NfL assay was established using the NF-light assay ELISA kit from UmanDiagnostics (UmanDiagnostics, Umeå, Sweden), transferred onto the Simoa platform with a homebrew kit (Quanterix Corp, Boston, MA, USA), and detailed instructions can be found in the Simoa Homebrew Assay Development Guide (Quan-terix). In short, paramagnetic carboxylated beads (Quanterix) were activated using 1-ethyl-3-(3-dimethylaminopropyl) carbodiimide (EDAC) (Quanterix) by adding 5% (v/v) 10 mg/mL EDAC to a mag-netic beads solution with 1.4 × 10⁶ beads/μL. Following a 30-min incubation at room temperature (RT), the beads were washed using a magnetic separator, and an initial volume, i.e. EDAC+beads solu-tion volumes in the previous step, of 0.3 mg/mL ice cold solusolu-tion of the monoclonal capture antibody (mAB47:3, UmanDiagnostics) was added. After a 2-h incubation on a mixer (2000 rpm, Multi-Tube Vortexer, Allsheng, China) at RT, the beads were washed and an initial reaction volume of blocking solution was added. After three washes, the conjugated beads were suspended and stored at 4 °C pending analysis. The monoclonal detection antibody (1 mg/mL, mAB2:1, UmanDiagnostics) was biotinylated by adding 3% (v/v) 3.4 mM EZ-Link™ NHS-PEG4-Biotin (Quanterix) followed by a 30-min incubation at RT. Free biotin was removed using spin fil-tration (Amicon® Ultra-2, 50 kDa, Sigma) and the biotinylated antibody was stored at 4 °C pending analysis. The assay was run on a Simoa HD-1 instrument (Quanterix) using a 2-step Assay Dilu-tion 2.0 protocol using 25 μL conjugated beads, 75 μL diluent [PBS; 0.1% Tween-20; 2% BSA; 10 mcg/mL TRU Block (Meridian Life Sci-ence, Inc., Memphis, TN, USA)], 20 μL biotinylated antibody, and 25 μL sample (or calibrator), which was followed by a 47 cadances incubation (1 cadance = 45 s). After washing, 100 μL of streptavidin-conjugated β-galactosidase (Quanterix) was added, followed by a 7-cadence incubation and a wash. Prior to reading, 25 μL Resorufin β-D-galactopyranoside (Quanterix) was added. The calibrator curve was constructed using the standard from the NF-light assay ELISA (NF-light®, UmanDiagnostics).
All measurements (ELISA, ECL assay, Simoa) were performed by board-certified laboratory technicians, who were masked to clinical data using one batch of reagents.
Ethics statement
Written informed consent was obtained from all patients, and the study was approved by the Common Institutional Review Board of the Cantons of Basel.
Analytical and statistical analysis
Samples below the lowest calibrator reaching acceptance criteria [calibrator: accuracy: 80%–120%, coefficients of variation (CVs) of duplicate determination ≤ 20%] were assigned the concentration of the lowest calibrator reaching these criteria [9]. We used the con-centration of the lowest calibrator fulfilling these acceptance cri-teria as an estimate of the “analytical sensitivity” of each platform rather than the “limit of detection” that is often incorrectly used to describe assay “sensitivity”. The lower limit of quantification was not formally assessed for each of the platforms in this comparison study [10]. Samples above the highest calibrator (10,000 pg/mL) were assigned a concentration of 10,000 pg/mL. Repeatability (within-run precision) and intermediate precision (between-run precision) were calculated according to [11]. Intra-assay CVs were assessed between the concentrations of duplicates of the measured samples. All meas-urements on the Meso Scale Diagnostics (MSD) and Simoa platforms were done in duplicates; the ELISA measurements were performed in single measurements, since based on large previous experience, intermediate precision and repeatability for the ELISA are below 20% and 10%, respectively.
Data are described by median and IQR if not stated other-wise. NfL levels were compared between MS and each of the other groups (low, medium, high) by the Mann-Whitney test. Spearman correlation coefficients were calculated between NfL levels in CSF and serum and between the different platforms. All analyses were performed using GraphPad Prism 6.00 for Windows [GraphPad software, La Jolla, CA, USA (www.graphpad.com)] and IBM SPSS Statistics, version 22.
Results
Sensitivity of ELISA, ECL assay, and Simoa
Analytical sensitivity was 0.62 pg/mL for Simoa, 15.6 pg/
mL for the ECL assay, and 78.0 pg/mL for the ELISA. All
CSF samples in all assays had concentrations above these
levels. Eighteen of 33 (54.5%) serum measurements and
20 of 33 (60.6%) were below sensitivity in the ELISA and
ECL assay, respectively (Table 1). Of note, several ELISA
serum measurements showed very high NfL
concentra-tions also in low and medium (low: 1/7 with very high
NfL concentration, measured concentration: 3201 pg/mL;
medium: 4/8, measured concentrations: 199, 219, 517, and
1209 pg/mL). These five samples were all below analytical
sensitivity when measured by the ECL assay and had low
concentration with Simoa (range 7–18 pg/mL).
Intermediate precision, repeatability, and
sample CVs for the ECL assay and Simoa
All samples were measured on the same day. Based on
results from the previous 15 runs performed on separate
days, intermediate precision/repeatability were 6.6%/3.6%
(sample with mean concentration 72.8 pg/mL), 8.8%/6.4%
(52.3 pg/mL) and 14.8%/9.2% (9.1 pg/mL), respectively, for
the ECL assay. All sample CVs of duplicate measurements
were below 10.8%.
Since the protocol for the Simoa assay is still under
development, mainly due to planned upgrades of the
platform, no complete formal validation has been
per-formed. Based on results from the previous 13 runs using
the current protocol, intermediate precision/repeatability
was 17.0%/6.6%, respectively (sample with mean
concen-tration of 64 pg/mL). All sample CVs of duplicate
measure-ments were below 12.5%.
Correlations between CSF and serum NfL
Correlations between paired CSF and serum samples were
strongest for Simoa (r = 0.88, p < 0.001, Figure 1C) and the
ECL assay (r = 0.78, p < 0.001, Figure 1B). This was less clear
for the ELISA measurements (r = 0.38, p = 0.030, Figure 1A)
(Table 1).
Correlations between ELISA, MSD and Simoa
measurements
CSF
CSF NfL measurements on the three different platforms
were highly correlated (ELISA-ECL assay: r = 1.0, p < 0.001,
Figure 1D; ELISA-Simoa: r = 1.0, p < 0.001, Figure 1E; and
ECL assay-Simoa: r = 1.0, p < 0.001, Figure 1F).
Serum
For serum measurements, NfL levels were highly
corre-lated between the ECL assay and Simoa (r = 0.86, p < 0.001,
Figure 1I), whereas this relation was less strong for
ELISA-ECL assay (r = 0.41, p = 0.018, Figure 1G) and ELISA-Simoa
(r = 0.43, p = 0.013, Figure 1H).
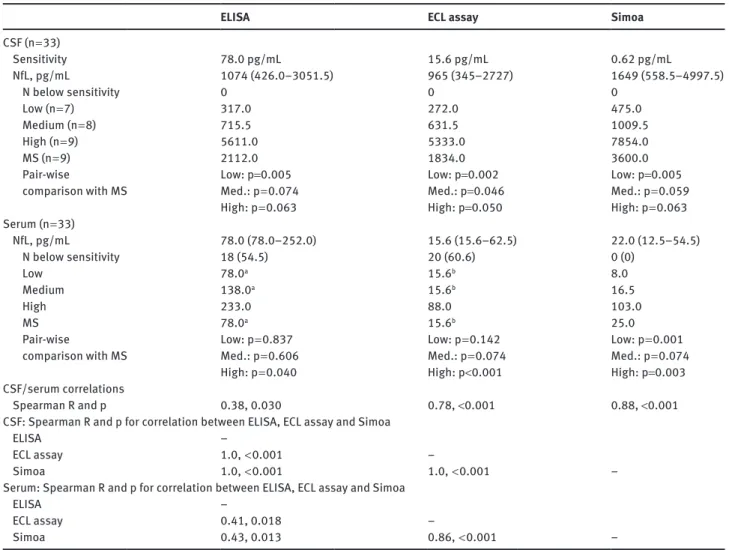
Table 1: Results of CSF and serum NfL measurements in ELISA, ECL assay and Simoa.
ELISA ECL assay Simoa
CSF (n = 33) Sensitivity 78.0 pg/mL 15.6 pg/mL 0.62 pg/mL NfL, pg/mL 1074 (426.0–3051.5) 965 (345–2727) 1649 (558.5–4997.5) N below sensitivity 0 0 0 Low (n = 7) 317.0 272.0 475.0 Medium (n = 8) 715.5 631.5 1009.5 High (n = 9) 5611.0 5333.0 7854.0 MS (n = 9) 2112.0 1834.0 3600.0 Pair-wise
comparison with MS Low: p=0.005Med.: p = 0.074 High: p = 0.063 Low: p=0.002 Med.: p=0.046 High: p=0.050 Low: p=0.005 Med.: p = 0.059 High: p = 0.063 Serum (n = 33) NfL, pg/mL 78.0 (78.0–252.0) 15.6 (15.6–62.5) 22.0 (12.5–54.5) N below sensitivity 18 (54.5) 20 (60.6) 0 (0) Low 78.0a 15.6b 8.0 Medium 138.0a 15.6b 16.5 High 233.0 88.0 103.0 MS 78.0a 15.6b 25.0 Pair-wise
comparison with MS Low: p = 0.837Med.: p = 0.606 High: p = 0.040 Low: p = 0.142 Med.: p = 0.074 High: p<0.001 Low: p = 0.001 Med.: p = 0.074 High: p=0.003 CSF/serum correlations Spearman R and p 0.38, 0.030 0.78, <0.001 0.88, <0.001
CSF: Spearman R and p for correlation between ELISA, ECL assay and Simoa
ELISA –
ECL assay 1.0, < 0.001 –
Simoa 1.0, < 0.001 1.0, < 0.001 –
Serum: Spearman R and p for correlation between ELISA, ECL assay and Simoa
ELISA –
ECL assay 0.41, 0.018 –
Simoa 0.43, 0.013 0.86, < 0.001 –
aBelow lowest calibrator (78.0 pg/mL): low: 6/7 samples (1/7 measured concentration 3201 pg/mL); medium: 4/8 (4/8: 199 pg/mL, 219 pg/mL, 517 pg/mL, and 1209 pg/mL); MS: 7/9 (2/9: 5595 pg/mL and 1891 pg/mL). bBelow lowest calibrator (15.6 pg/mL): low: 7/7; medium: 8/8; MS: 5/9. CSF, cerebrospinal fluid; ECL, electrochemiluminescence; MS, multiple sclerosis; NfL, neurofilament light chain.
Comparison between MS and low, medium,
and high
CSF
MS patients had CSF NfL levels above low in all three
platforms (ELISA: p = 0.005, ECL assay: p = 0.002, Simoa:
p = 0.005). The difference between MS and medium or high
only reached significance for the ECL assay (p = 0.046 and
p = 0.050, respectively, Table 1).
Serum
Interestingly, the increase in serum NfL in MS vs. low only
reached significance in Simoa (p = 0.001, Table 1). MS had
significantly lower serum NfL than high in all three assays
(ELISA: p = 0.04, ECL assay: p < 0.001, Simoa: p = 0.003).
Discussion
We found the Simoa platform to be 126- and 25-fold more
sensitive than ELISA and the ECL assay, respectively, to
quantify NfL. CSF and serum NfL measurements were
highly correlated in the ECL assay and Simoa
measure-ments, whereas this relationship was weaker with ELISA.
The correlation coefficients for CSF NfL measurements
between the different platforms were 1.0. Conversely,
only the serum NfL results from the ECL assay and Simoa
showed a similar high relationship.
The Simoa technology relies on single-molecule
arrays and the simultaneous counting of singulated
capture microbeads [6, 7]. In contrast to analog
immu-noassays where the enzyme-substrate reaction is
conducted in relatively large reaction volumes (50–
100 μL), Simoa restricts the diffusion of the fluorescent
CSF Serum ELISA
A
B
C
D
E
F
G
H
I
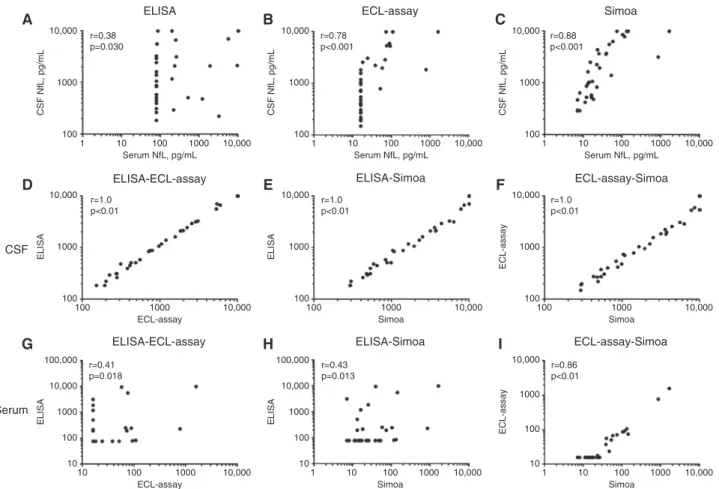
ELISA-ECL-assay ELISA-ECL-assay 10,000 r=0.38 p=0.030 1000 CSF NfL, pg/mL 100 1 10 100 Serum NfL, pg/mL 1000 10,000 10,000 r=1.0 p<0.01 1000 100 100 1000 ECL-assay 10,000 ELISA 100,000 10,000 r=0.41 p=0.018 1000 10 100 10 100 ECL-assay 1000 10,000 ELISA ECL-assay ELISA-Simoa ELISA-Simoa r=0.78 p<0.001 10,000 1000 CSF NfL, pg/mL 100 1 10 100 Serum NfL, pg/mL 1000 10,000 r=1.0 p<0.01 10,000 1000 ELISA 100 100 1000 Simoa 10,000 r=0.43 p=0.013 100,000 10,000 1000 10 100 1 10 100 Simoa 1000 10,000 ELISA Simoa ECL-assay-Simoa ECL-assay-Simoa r=0.88 p<0.001 10,000 1000 CSF NfL, pg/mL 100 1 10 100 Serum NfL, pg/mL 1000 10,000 r=1.0 p<0.01 10,000 1000 ECL-assay 100 100 1000 Simoa 10,000 r=0.86 p<0.01 10,000 1000 10 100 1 10 100 Simoa 1000 10,000 ECL-assa yFigure 1: CSF and serum NfL correlation in different assays (A–C), associations between NfL measurements on different platforms in CSF (D–F) and serum (G–I).
Correlations between paired CSF and serum samples were strongest for Simoa (r = 0.88, p < 0.001, Figure 1C), and the ECL assay (r = 0.78, p < 0.001, Figure 1B). This was less clear for the ELISA measurements (r = 0.38, p = 0.030, Figure 1A). CSF NfL measurements on the three different platforms were highly correlated: ELISA-ECL assay: r = 1.0, p < 0.001, Figure 1D; ELISA-Simoa: r = 1.0, p < 0.001, Figure 1E; and ECL assay-Simoa: r = 1.0, p < 0.001, Figure 1F. For serum measurements, NfL levels were highly correlated between ECL assay and Simoa (r = 0.86, p < 0.001, Figure 1I), whereas this relation was weaker for ELISA-ECL assay (r = 0.41, p = 0.018, Figure 1G) and ELISA-Simoa (r = 0.43, p = 0.013, Figure 1H).
molecules by femtoliter-sized wells that can be counted
with a camera simultaneously in thousands of
micro-wells. The counting of active and inactive wells
consti-tutes a digital signal corresponding to the presence or
absence of single enzyme molecules. This gain in
sen-sitivity permits the use of low quantities of the
labe-ling reagent, which lowers nonspecific interactions
and increases signal-background ratios [7]. Indeed, we
found the Simoa platform to be more than 100-fold more
sensitive (0.62 pg/mL) than ELISA (78.0 pg/mL), and
importantly, also 25-fold more sensitive than our
previ-ously described and validated ECL assay (15.6 pg/mL)
[5]. For any potential future clinical application, it is of
utmost importance to note that all serum samples were
well in the measurable range of the Simoa NfL assay,
with the lowest serum sample displaying a
concentra-tion of 2.0 pg/mL, 3.2-fold above the sensitivity of the
assay. In contrast, more than 50% of the samples were
not reliably quantifiable by the ECL assay and ELISA in
our study.
Brain proteins access the blood flow either via CSF
drainage in the venous blood or by diffusion through
the blood-brain barrier. We have previously shown
asso-ciations between CSF and serum in ALS, Alzheimer’s
disease, GBS and healthy controls [5, 12], which is in line
with the present results. Indeed, CSF and serum
meas-urements were highly correlated with the ECL assay
(r = 0.78, p < 0.001, Figure 1B) and Simoa (r = 0.88, p < 0.001,
Figure 1C), but less so with ELISA (r = 0.38, p = 0.030,
Figure 1A). We postulate that lower sensitivity together
with unexpected high serum NfL measurements in some of
the serum samples, caused by matrix effects like the
pres-ence of heterophilic antibodies, contributed to this smaller
correlation between CSF and serum ELISA measurements
(see footnote Table 1) [13]. Heterophilic antibodies are also
likely the cause for the apparently higher rate of
measure-ments below sensitivity with the ECL assay compared with
the ELISA, which does not contain a blocker for this type
of interference.
NfL measurements in CSF were perfectly correlated
between the three platforms (Figure 1D–F). Of note, absolute
CSF NfL levels tended to be higher with Simoa (1649 pg/mL),
whereas concentrations measured by ELISA (1074 pg/mL)
and the ECL assay (965 pg/mL) were more similar. This is an
important observation and points to the need for
standardi-zation of calibrators and further work to allow direct
com-parability of concentrations between different platforms,
centres, and studies. Also, despite the fact that our results
seem to be, to some extent, expected (as all three platforms
used the same mABs), several examples from the
peer-reviewed literature clearly show the difficulty of
reproduc-ing findreproduc-ings even with identical reagents and platforms [14,
15]. These examples clearly point to the importance of
thor-ough biomarker validation, including longitudinal cohort
studies, before implementing biomarkers for research,
clini-cal trials, or routine use in cliniclini-cal practice [16].
Correlations between ELISA serum measurements
and ECL assay or Simoa were visible and significant, but
limited likely by the ELISA’s shortcomings described above
(Figure 1G–H). Serum measurements between ECL assay
and Simoa were highly associated (Figure 1I), with the ECL
assay’s limitation that it cannot quantify concentrations
below 15.6 pg/mL (20 of 33 samples). Our data confirm
that serum NfL can be reproducibly measured on different
sufficiently sensitive assay platforms and support the use
of NfL measurements as a biomarker of neuronal damage
also in the blood compartment.
We attempted to investigate CSF and serum NfL levels
in MS vs. the preselected defined range samples (low,
medium, high). We saw significantly higher CSF NfL levels
in MS vs. low for all three platforms. Conversely, serum
NfL in MS was only significantly higher than low for the
Simoa measurements, whereas neither ELISA nor the ECL
assay allowed quantification of any samples from the low
or medium category. With the ECL assay, it was possible to
quantify five of nine MS samples vs. zero with the ELISA
(Table 1).
In conclusion, our results support the feasibility of
quantifying NfL in CSF and serum samples as a measure
of axonal injury. The highly sensitive Simoa technology
especially deserves further studies in large and
well-characterized longitudinal patient cohorts. Large studies
including longitudinal sampling will also be needed
to clarify whether serum NfL can be used in the future
to measure disease severity and determine prognosis
or/and response to treatment interventions in various
neurological diseases.
Acknowledgments: We thank M. Limberg for technical
assistance.
Author contributions: All the authors have accepted
responsibility for the entire content of this submitted
manuscript and approved submission.
Research funding: The study was supported by grants
from the Swiss MS Society, Swiss National Science
Foun-dation (Grant/Award Number: ‘320030_160221’), Bayer
(Switzerland) AG, Genzyme, Novartis, Swedish Research
Council, VINNOVA, the Torsten Söderberg Foundation,
the Knut and Alice Wallenberg Foundation, Swedish State
Support for Clinical Research, and Frimurarestiftelsen.
Employment or leadership: None declared.
Honorarium: None declared.
Competing interests: The funding organization(s) played
no role in the study design; in the collection, analysis, and
interpretation of data; in the writing of the report; or in the
decision to submit the report for publication.
References
1. Teunissen CE, Khalil M. Neurofilaments as biomarkers in multiple sclerosis. Mult Scler 2012;18:552–6.
2. Deisenhammer F, Egg R, Giovannoni G, Hemmer B, Petzold A, Sellebjerg F, et al. EFNS guidelines on disease-specific CSF investigations. Eur J Neurol 2009;16:760–70.
3. Teunissen CE, Iacobaeus E, Khademi M, Brundin L, Norgren N, Koel-Simmelink MJ, et al. Combination of CSF N-acetylas-partate and neurofilaments in multiple sclerosis. Neurology 2009;72:1322–9.
4. Norgren N, Karlsson JE, Rosengren L, Stigbrand T. Monoclonal antibodies selective for low molecular weight neurofilaments. Hybrid Hybridomics 2002;21:53–9.
5. Gaiottino J, Norgren N, Dobson R, Topping J, Nissim A, Malaspina A, et al. Increased neurofilament light chain blood levels in neurodegenerative neurological diseases. PLoS One 2013;8:e75091.
6. Rissin DM, Kan CW, Campbell TG, Howes SC, Fournier DR, Song L, et al. Single-molecule enzyme-linked immunosorbent assay detects serum proteins at subfemtomolar concentrations. Nat Biotechnol 2010;28:595–9.
7. Wilson DH, Rissin DM, Kan CW, Fournier DR, Piech T, Campbell TG, et al. The simoa HD-1 analyzer: a novel fully automated digital immunoassay analyzer with single-molecule sensitivity and multiplexing. J Lab Autom 2015 [Epub ahead of print]. 8. Teunissen CE, Petzold A, Bennett JL, Berven FS, Brundin L,
Comabella M, et al. A consensus protocol for the standardiza-tion of cerebrospinal fluid collecstandardiza-tion and biobanking. Neurology 2009;73:1914–22.
9. Valentin MA, Ma S, Zhao A, Legay F, Avrameas A. Validation of immunoassay for protein biomarkers: bioanalytical study plan
implementation to support pre-clinical and clinical studies. J Pharm Biomed Anal 2011;55:869–77.
10. Lee JW, Devanarayan V, Barrett YC, Weiner R, Allinson J, Fountain S, et al. Fit-for-purpose method development and validation for successful biomarker measurement. Pharm Res 2006;23:312–28. 11. Andreasson U, Perret-Liaudet A, van Waalwijk van Doorn LJ,
Blennow K, Chiasserini D, Engelborghs S, et al. A Practical Guide to Immunoassay Method Validation. Front Neurol 2015;6:179. 12. Lu CH, Macdonald-Wallis C, Gray E, Pearce N, Petzold A, Norgren
N, et al. Neurofilament light chain: a prognostic biomarker in amyotrophic lateral sclerosis. Neurology 2015;84:2247–57. 13. Lundberg M, Curbo S, Reiser K, Masterman T,
Braesch-Andersen S, Arestrom I, et al. Methodological aspects of ELISA
analysis of thioredoxin 1 in human plasma and cerebrospinal fluid. PLoS One 2014;9:e103554.
14. Kuhle J, Pohl C, Mehling M, Edan G, Freedman MS, Hartung HP, et al. Lack of association between antimyelin antibod-ies and progression to multiple sclerosis. N Engl J Med 2007;356:371–8.
15. Brickshawana A, Hinson SR, Romero MF, Lucchinetti C, Guo Y, Buttmann M, et al. Investigation of the KIR4.1 potassium chan-nel as a putative antigen in patients with multiple sclerosis: a comparative study. Lancet Neurol 2014;13:795–806.
16. Teunissen CE, Malekzadeh A, Leurs C, Bridel C, Killestein J. Body fluid biomarkers for multiple sclerosis–the long road to clinical application. Nat Rev Neurol 2015;11:585–96.