HAL Id: hal-00001676
https://hal.archives-ouvertes.fr/hal-00001676
Submitted on 10 Jun 2004HAL is a multi-disciplinary open access
archive for the deposit and dissemination of sci-entific research documents, whether they are pub-lished or not. The documents may come from
L’archive ouverte pluridisciplinaire HAL, est destinée au dépôt et à la diffusion de documents scientifiques de niveau recherche, publiés ou non, émanant des établissements d’enseignement et de
Structure and growth of titanium buffer layers on
Al2O3(0001)
E. Sondergard, O. Kerjan, Cyrille Barreteau, J. Jupille
To cite this version:
E. Sondergard, O. Kerjan, Cyrille Barreteau, J. Jupille. Structure and growth of titanium buffer layers on Al2O3(0001). Surface Science, Elsevier, 2004, 559, pp.131-140. �10.1016/j.susc.2004.03.072�. �hal-00001676�
ccsd-00001676, version 1 - 16 Jun 2004
Epitaxy and growth of titanium buffer layers
on
Al
2O
3(0001)
E. Sønderg˚
ard
a,∗ , O. Kerjan
a, C. Barreteau
band J.Jupille
ca
Laboratoire CNRS-Saint Gobain, ”Surface du Verre et Interfaces”, 93303 Aubervilliers, France.
b
DSM/DRECAM/SPCSI, CEA Saclay, F-91 191 Gif sur Yvette, France c
Groupe de Physique des Solides, Universit´es Paris 6 et 7, 140 rue de Lourmel, 75015 Paris, France
Abstract
The structure and growth of thin films of titanium on α−Al2O3at room temperature were investigated though in situ RHEED observations. Two different structures coexists at low coverage. One corresponds to the Ti(0001) k Al2O3(0001), Ti[1100]k Al2O3[2110] and Ti[1010] k Al2O3[1100] epitaxy of the α phase of titanium reported before for thick films prepared at high temperature. The other structure can be explained by co-existence of α and ω Ti in thin films. It was shown, with the use of tight-binding total energetic calculations that, the ω phase could actually be stabilized by the substrate. In addition, it was demonstrated that the presence of this extra structure has a dramatic effect on the epitaxial growth of the Ag overlayers on the system. This can be the origin of the non-trivial buffer effect of titanium previously observed.
1 Introduction
Finding surface treatments which can force layer-by-layer growth is among the key issues in heteroepitaxy (1). Indeed, many attempts have been made to promote the wetting of materials of different and non interacting nature such as the metal on oxide interface (2; 3). The challenge is not only to grow durable interfaces but also to control the morphology of the metal film as it affects the physical properties of the system. The subject is of increasing importance as many industrial applications rely on the mastering of interfaces such as ∗ Corresponding author.
copper interconnects on oxides for microelectronics and silver on oxides for optical purposes. As a trend, adhesion energy decreases from early transition metals to noble metals (4; 5), due to the increased filling of the 3d band (6; 7). These differences have major consequences regarding the wetting properties of metals on oxides and lead to a large variety of growth situations. The thermodynamic condition for two-dimensional growth of a metal film on a substrate requires the adhesion energy β to be equal to or higher than twice the surface energy of the metal σM. The way β compares to σM is of central importance for the growth of the film. While the condition β < σM implies θ > 90◦ and a growth in a three-dimensional fashion up to very high coverage, β > σM implies θ < 90◦ and leads to a quickly percolating film. Clearly, noble metals and late transition metals on wide band gap oxides belong to the first category (8) and early transition metals to the second (9). A method often used to improve the wetting of noble metals on oxide surfaces is pre-deposition of early transition metals (10). This so-called buffer effect involves both electronic and geometric contributions (10).
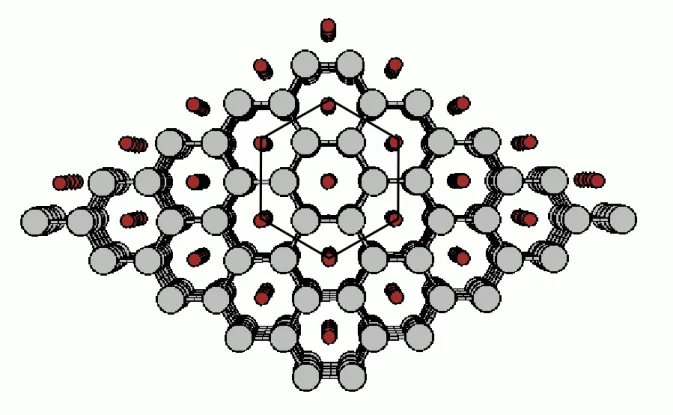
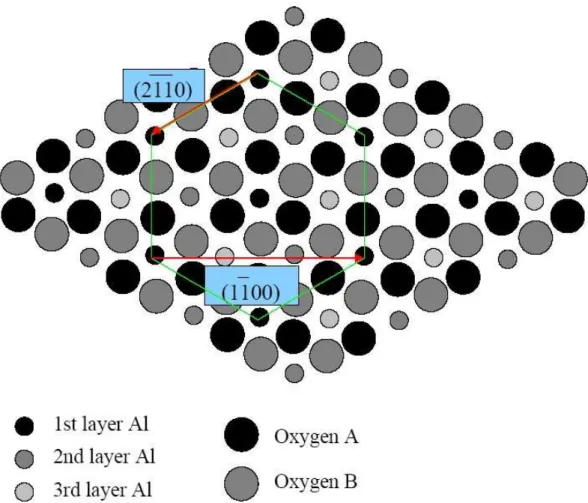
In the present work, attention is focused on the effect of titanium buffers for noble metal growth on alumina, a subject receiving attention because of its ap-plication in microelectronic devices (3; 10), and references therein. Suzuki et al. (11) found by ion scattering that there is no interdiffusion at the interface be-tween the titanium overlayer and the Al-terminated α−Al2O3(0001) substrate. By performing surface diffraction experiments on a 20 monolayer thick tita-nium film annealed to 1100 K, they showed that the epitaxial relationship was Ti(0001) k Al2O3(0001), Ti[1100] k Al2O3[2110] and Ti[1010] k Al2O3[1100]. This means that the triangular lattice of Ti(111) is rotated by 30◦ with respect to the triangular lattice formed by the outer Al atoms of Al2O3(0001), see fig-ure 1. Dehm et al. (3) came to similar conclusions through combined transmis-sion electron microscopy (TEM) and reflection high energy electron diffraction (RHEED) observations of a 10-100 nm thick titanium film on Al2O3(0001). These authors did not investigate in details the crystal structure of the in-terface Ti/Al2O3. Recently, a first principle calculation of Ti on Al2O3(0001) predicted a tendency to intermixing for aluminium and titanium at the inter-face such that the most stable site for the titanium adatoms is above or in replacement of the surface aluminium atoms (12). These results have still not been experimentally verified.
Concerning the buffer effect it was reported in Ref. (3) that copper grew in a epitaxial manner on thick titanium films (10-100 nm) on Al2O3(0001). The buffer effect of titanium was indirectly demonstrated on silver for much thinner films through optical reflection in situ measurements of the silver plasmon (13). It was found that the use of titanium buffers had a significant influence on the morphology of silver films, although the effect of the titanium film was shown to depend highly on its thickness. Very thin titanium layers (< 0.3 nm) hardly produce any change in the three dimensional growth of silver with respect to
the bare Al2O3 surface. In contrast, a titanium layer of 0.6 nm leads to a better wetting of silver between silver and the substrate. However, for higher titanium coverage, the quality of the wetting decreases, although it remains better than on the bare surface. Similar results where obtained by surface diffraction experiments (14). The very intriguing complexity of this scenario can hardly be explained by the surface energy of titanium alone. In the present work the structure of the titanium buffer is investigated as a fonction of its thickness. The corresponding behavior of a silver overlayer is further discussed.
2 Experimental
Single crystalline Al2O3(0001) substrates from Mateck Gmbh with a ≤ 0.5◦ miscut were prepared using acetone plus ultrasonic bath followed by a cleaning in a 10 percent dilution of a standard buffered basic soap with PH=10.6. After washing in deionized water and drying in isopropanol vapor, an ex situ annealing at 1320 K was performed under an atmospheric pressure of oxygen to obtain a good crystallinity. Afterwards, samples were inserted in a MECA2000 molecular beam epitaxy apparatus, annealed under a partial pressure of 5·10−5 torr O2 to get rid of carbon contamination, first at 820 K over a couple of hours and then at 1070 K for one hour. Samples were cooled under oxygen prior to transfer to the evaporation chamber where the base pressure was 1 ·10−10torr. In a similar vacuum chamber equipped with a photoemission analyser, is was checked that this treatment leads to clean Al2O3(0001) surfaces (13).
Titanium and silver films were evaporated on the samples using a Telemark electron gun. The flux was between 0.08-0.1 nm per min and the samples were held at 400 K. As titanium is a very reactive material special care was taken to keep the chamber pressure within the 10−10torr range during evaporation. The thickness was measured with a quartz microbalance calibrated using ex situ electron microprobe measurements to obtain the number of atoms deposited. To eliminate any distorsions of the diffraction pattern due to stray fields from the electron guns, special care was taken to align the optical center of the RHEED with the electron guns in operation condition. The evolution of the growth was followed by a Staib RHEED instrument and the diffraction pat-terns were on a CCD camera. During the deposition any physical movement of the samples used for the lattice measurements were avoided to keep the substrate reference for the diffraction patterns. When analysing short lattice spacings, for which the diffraction patterns would be outside the screen, the scattered beams were deflected on the screen by the means of an electrostatic device. It was verified several times that this method does not introduce any errors on the positions of the diffraction peaks on the bare sapphire substrate.
3 Results
The following section first presents the results and the discussion related to the growth of titanium on Al2O3. The influence of titanium on the growth of silver is then briefly considered. Directions along which RHEED analysis is performed are always given with respect to the crystallographic axes in figure 1. Distances in real and reciprocal space will be labelled l and g respectively.
3.1 Growth of the titanium film
Figure 2 shows the typical evolution of the RHEED pattern of a titanium layer collected along the Al2O3[1100] zone axis which means that the observed sur-face streaks correspond to the Al2O3[2110] axis. The film starts growing with a reciprocal lattice parameter close to the substrate lattice, gs2. Up to 1 nm, the broad and not very intense diffraction rods indicate a low degree of order. Upon increasing the titanium coverage, the diffraction pattern globally gains intensity. Between approximately 1.8- 6 nm, two separated lattice parameters gω2and gα1 coexist. At lower coverage, the external rod gω2is the most intense (figure 2, 0.3-3.6 nm.). For increasing coverage the internal rod gα1 increases in intensity to finally dominate the pattern (figure 2, 5.6 nm). Note that the thickness where the switch in intensity between gω2 and gα1 occurs depends on the sample. For some crystals it is impossible to get a correct diffraction pat-tern below 2 nm of Ti - for others the switching between the lattice spacings gω2 and gα1 is already observed at a lower coverage. But, in all cases, in-plane rotations of 360◦ show that the symmetry of the structure is 6 over the whole thickness range.
To collect the peak corresponding to Ti[1010], the RHEED pattern of the growing titanium was also recorded along the Al2O3[2110] azimuth. This was delicate because the working distance in the RHEED setup is mainly aimed at analysing large lattice spacings. Small lattice spacings can only be observed by deflection of the diffraction pattern on the CCD camera. Therefore, the diffraction patterns were collected by halfs. To get a complete image the two halfs were recombined using the (00) streaks as a reference (figure 3). The corresponding lattice parameters were obtained as the mean value found from the half images. The diffraction patterns in the Al2O3[2110] zone axis were in general of low intensity. Interestingly, the patterns obtained around 2 nm of titanium are close to those of the clean substrate (figure 3). This pattern disappears as the streaks corresponding to the Ti[1010] appear. A full rotation of the sample reveals a six fold symmetry of the pattern.
in the Al2O3[1100] zone axis. In order to smooth the noise of the data, three photos recorded for each film thickness were summed and intensities were cumulated along the diffraction peaks. To avoid zones where the diffraction streaks can be curved only the part of the diffraction pattern close to the shadow edge of the sample was used. Intensity profiles are showed in figure 4 (upper right corner). The analysis of this data is complicated by the presence of two overlapping and broad peaks. Nevertheless, since in a wide coverage range, the streaks are split into two lines separated by a valley, it has been chosen to decompose the profiles into two components over the whole titanium coverage range. Diffractions peaks are Lorenzian functions but deviations from this are expected when working with a CCD camera. Therefore several types of functions were tested to obtain the best possible model over as large a range of coverage as possible. It proved to be a Voigt function with a 80% ratio of the Lorenzian to Gaussian. All the diffraction peaks could be independently fitted by means of two Voigt functions of equal width (figure 4). Due to the high background level and the presence of Kikuchi lines, profiles associated with low titanium coverage were difficult to decompose. In particular for cov-erage below 2 nm, the existence of the gα1 line could be questioned. But at higher coverage of titanium the fits are unambiguous. The fact that the in-plane atomic distances are constant over a wide range of coverage (figure 5) while the residue of the decomposition is very small (figure 4) proves that the decomposition of the diffraction line in two peaks is physically sound.
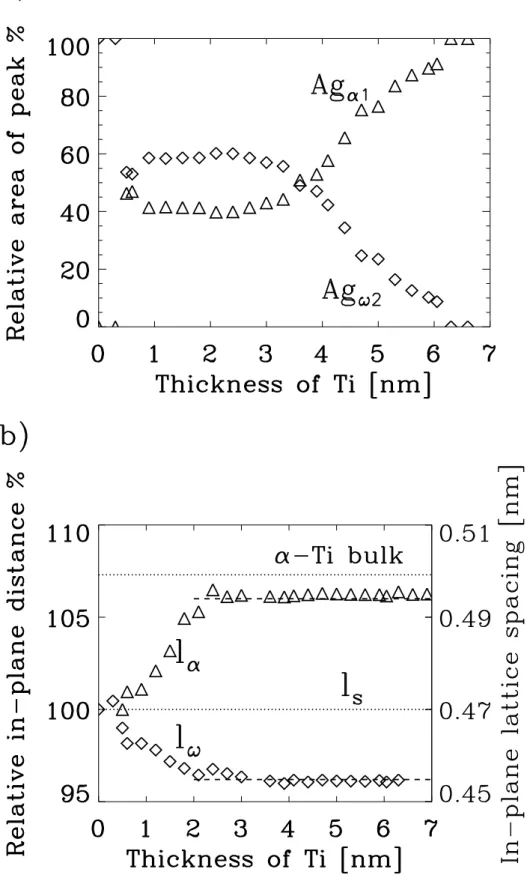
Figure 5 a) shows the evolution of the area of the fitted peaks. In the 1-3 nm range, the gα1 and gω2 peak areas are about constant with Agω2 > Agα1, while, above 3 nm, gα1 increases and gω2 progressively vanishes. Due to the existence of multiple diffraction effects in RHEED these intensities are only a qualitative indications of the presence of the structures corresponding to the observed peaks in the film. The relative positions of the fitted peaks gα1 and gω2 converted into the real space lattice constants lα and lω are presented in figure 5 b). Titanium first grows with a lattice constant close to that of the substrate ls and then undergoes a contraction of ≈ 4% to a lattice constant lω and finally it expands to the value lα close to the interatomic distance of bulk Ti[1100] which is 7.3% larger than ls, see ref. (19). The intermediate contraction of the film is very surprising as the titanium lattice is already contracted on the substrate, there should be no gain in energy by a further contraction.
An analysis along the Al2O3[2110] zone axis also reveals a change in lattice spacing of the titanium film even if the diffraction patterns are more blurred than along the Al2O3[1100] axis (figure 3). Around 2 nm, gω1 streaks are observed in a position which corresponds to a compression by 4% with respect to the substrate. These streaks disappear while the gα2 streaks become visible.
3.2 Titanium as a buffer layer for silver growth
To elucidate the role of the thickness of the titanium buffer effect, 2 nm thick silver films were grown with titanium buffers of different thickness. Figure 6 shows typical RHEED patterns of the silver films with the beam along the Al2O3[1100] axis. On the bare Al2O3(0001) substrate, between 300-600 K, silver grows without any epitaxial relation and develops the ring structure typical for polycrystalline films constituted of three dimensional domains (fig-ure 6 a). For a titanium layer of 0.5-1.5 nm, silver deposition leads to streaks indicating a better spread of the film (figure 6 b.). A full rotation in the plane shows that the film has a sixfold symmetry corresponding to an epitaxy of a Ag(111) plane. However, at ±15◦ around the principal axes of the substrate, the diffraction pattern does not change considerably and only decreases in in-tensity meaning that the epitaxy is loose. On thicker titanium films (2-4 nm), when the two streaks gω2 and gα1 are present, the silver layer exhibits a pecu-liar structure (figure 6 c). The diffraction pattern is composed of dots which suggest a bad wetting of the silver on substrate. The pattern seen in figure 6 c) presents spots which are characteristic of a long range order, but do not cor-respond to any low index direction of silver. Finally, when silver is deposited on a titanium film thicker than 4 nm and when the gα1 streak dominates, the diffraction streaks are unperturbed by the silver deposition, which means that the silver wets the substrate and grows epitaxially (figure 6d). Therefore, the behavior of the silver film unambiguously shows that an important change occurs in the titanium buffer between 4 and 5 nm.
4 Discussion
4.1 Growth of titanium
The data connected to the growth of the titanium film will first be dis-cussed. At high titanium coverage, the epitaxial relationship is dominated by Ti(0001) k Al2O3(0001), Ti[1100]k Al2O3[2110] and Ti[1010] k Al2O3[1100] in agreement with the epitaxy found by other groups for thicker films at much higher temperature (3; 11). But at lower coverage, extra structures appear in the diffraction diagram in both zone axes in the surface plane (figures 2 and 3). As the gω1 and the gω2 streaks show up in the same coverage range and behave similarly, it is reasonable to attach them to the same structure. The extra streaks can either be due to multiple scattering between the principal streaks and an overlying domaine structure or the existence of another epi-taxial relation between the substrate and the titanium film. Both structures exhibit the same 6 fold symmetry as the substrate and they are the only
visi-ble structures during a full rotation of the sample. The dramatic change in the growth mode of the silver overlayers is the indication of a significant difference between the underlying structures of the titanium. This and the absence of extra streaks around the zero order peak and the asymmetry of the gω1 and the gω2 streaks make the existence of a domaine structure unlikely.
If we assume that the observed pattern is the diffraction from a crystal plane then the ratio gω2/gω2 =
√
3 suggests a hexagonal structure with a lattice parameter a ≈ 0.455 nm. The orientation of the hexagon is the same as the hexagon formed by the outer Al atoms on the Al2O3(0001) surface. This plane does not correspond to any hexagonal plane of the α-Ti but it compares with that of the (001) plane of the high pressure hexagonal ω phase of titanium (21). Therefore, the double peak observed in figure 2 can be explained by the coexistence between two epitaxial hexagonal configurations, one is α phase and the other is considered to be the ω phase of titanium .
The ω-Ti phase is a distorted bcc and one of the first steps in the high pressure hcp to bcc phase transition exhibited in the IV metals (20). This phase is frequently encountered in studies of the mechanical properties of titanium. The different high pressure phases of titanium were recently extensively studied both experimentally in a diamond anvil cell (21; 22) and theoretically (23; 24). Under hydrostatic pressure the ω phase coexists with the α phase from around 2 GPa to 9 GPa where the ω phase dominates. The phase is stable up to 116 GPa. Once the ω phase is obtained it can be kept at the ambient pressure although it is metastable. The ω-Ti(001) plane has been schematized ( figure 7) using the lattice parameters given in Ref. (23) and the structure description in Ref. (25). The ω phase can be seen as the successive stacking of a hexagonal lattice and a graphite like sheet, the hexagon being the origin of the periodicity of the lattice. The parameter of this hexagon a=0.4598nm (25) is indeed close to what was observed herein.
A few substrate-induced phase transitions have been observed in metal on metal epitaxial systems. One of most studied exemples is the fcc - bcc marten-sitic transition of iron on metallic substrates like Cu and Cu3Au(001). A very elaborated exemple is the STM and RHEED study of the Bains transition of iron on Cu3Au(001), (26; 27; 28). As in the present case, the authors ob-tained a critical thickness for the fcc phase between 1 and 10 ML depending on the substrate preparation and the films exhibited a high amount of in-plane disorder.
To evaluate the energetic balance between the α and ω phases under vari-ous compressive and extensive conditions a serie of total energy calculations was undertaken. The very small energy difference between the α and ω phase makes such calculations difficult. As a matter of fact, this phase transition is not properly described by first-principles methods by which the equilibrium
ω-Ti phase is found to be slightly lower in energy (about 7 meV) than α-Ti (23). Therefore, a total energy calculations was performed using the set of tight-binding parameters recently developed by Papaconstantopoulos and co-workers (23; 30) to reproduce as accurately as possible the α to ω phase transition. The calculated equilibrium lattice constants of the α-Ti and ω-Ti phases are aα = 0.294 nm (i.e, lα =
√
3aα = 0.51 nm) and aω = 0.459 nm re-spectively, showing a lattice mismatch with respect to the substrate of +7.4% and −3.4%. The total energy per atom of α-Ti (resp. ω-Ti) has been calcu-lated for hexagonal lattice parameters ranging from perfect matching with the substrate, up (resp. down) to the equilibrium lattice constants (figure 8). Each point of the curve is obtained by fixing the hexagonal lattice param-eter a and minimizing the total energy with respect to the paramparam-eter c. It clearly appears that, at the lattice constant giving the perfect matching with the substrate, ω-Ti is favored with respect to α-Ti, whereas it is the reverse at the equilibrium lattice constant. The small energy difference between the two states makes the coexistence between the two phases over a range of de-posited thicknesses very plausible. The presence of defects on the substrate surface can also modify the energetic balance between the two phases. The RHEED data do not give any indication about the arrangement of the two phases which are assumed to coexists within the titanium layer nor does it give insight about the burried part of for the titanium. However, data show clearly that above a certain thickness the surface of the titanium film is exclusively made of the α- Ti with the Ti(0001) k Al2O3(0001), Ti[1100] k Al2O3[2110] and Ti[1010] k Al2O3[1100] epitaxy.
4.2 Influence of the cristallography of titanium on the wetting of silver
Concerning the growth of silver on titanium the strength of the metallic bond should clearly favor the good spreading of silver on titanium. Furthermore the lattice spacing the of two most compact hexagonal planes of titanium and silver are the Ti(0001) with a = 0.295 nm and the Ag(111) with a = 0.2889 nm (19). Therefore, it can be anticipated that the Ag/Ti epitaxy is favored over the Ag/Al2O3epitaxy because it corresponds to a lower mismatch (-2% versus 5.34%). Thus, both the surface energetic and the lattice constants seems to be in favor of a better wetting of silver on titanium on Al2O3 at least when bulk values are considered.
The data presented in figure 6 present a more complex picture and suggest that a part of the buffer effect of titanium on silver is linked to the structure and the stress of the interface. On the bare alumina substrate silver grows as three dimensional polycrystals. Silver does not wet the alumina which transfers little order to the metal overlayer. However, the presence of very thin titanium films improves the wetting of alumina by silver (≈ 1 nm, see Ref. (13), the silver film
showing a texture around Ag(111) orientation meaning that the titanium film transfers a part of the substrate order. Taking into account the very diffuse diffraction patterns for thin Ti layers in this region it is possible that the silver film only replicates the underlying Ti structure. At higher coverage, for titanium layers where gω2 dominates and the gα1 just starts to become visible, the wetting of the substrate by silver becomes poor, figure 6c. Finally, when the titanium film is thicker and has a nearly relaxed lattice parameter, silver grows epitaxially in a laminar way. The Ag(111)kTi(0001), Ag[110]kTi[2110] epitaxy corresponds to expectation and it is similar to that found for the Cu/Ti/Al2O3 system (3). Such a structure is consistent with the observation of a pure α Ti phase by electron diffraction. The bad wetting of silver on the intermediate titanium coverage is an evidence that a titanium structure drastically different from α Ti is present. Indeed, a like explanation is the presence of the ω Ti at the surface of the titanium film. The change in the interfacial energy is due the large mismatch (9.9%) between ω Ti(0001) and Ag(111) and prevents the spreading of silver.
The present data show that the silver layers exhibit a remarkable amount of different textures. Laminar growth is only obtained when the lattice constant of the titanium film is very close to the silver bulk value. Therefore, the buffer effect of titanium for noble metals is not only the result of a change in surface and interface energies. It is also very dependent on the crystallography of the buffer and therefore on the elastic contributions to the interfacial energy.
5 Conclusion
The room temperature growth of thin titanium films on α − Al2O3(0001) has been shown be more complex than hereto reported. For films above 4 nm the α-Ti phase is obtained in an epitaxial relation already observed and described in literature for the high temperature growth of thick titanium films on sapphire. For thin films an additional structure is present. This structure is assigned to the (0001) plane of the ω phase where the hexagon is aligned with the one of an Al-terminated α − Al2O3(0001). The two phases coexist at the beginning of the growth of the titanium film in the range of coverage (≈ 1-4 nm). The substrate-induced existence of an ω phase is plausible when taking simple lattice considerations into account, but the details behind the growth and stabilisation of this phase still need to be explained.
The structure of the titanium film has a dramatic influence on the so-called buffer effect, which has been tested herein by depositing silver on a α − Al2O3(0001) surface pre-covered by titanium at various coverage. Indeed, the titanium film structure and strain was proved to strongly affect, not only the structure, but also the wetting of the silver film. The silver film, which clearly
grows in a 3D manner when the film structure contains the structure we as-sign to the ω-Ti phase, spreads out on the α-Ti phase. Therefore, the growth mode and spreading of noble metals deposited on titanium-covered alumina arises not only from thermodynamics but from a subtle interplay between the structure and the surface energy of the titanium film.
6 Acknowledgements
We wish to thank the group of Dr. Claude Fermon at the CEA-France for the use of their RHEED/UHV facility. Furthermore Dr. A. Marty gave helpful comments during the redaction of this paper. Dr. C. Barreteau wish to thank the Drs. D.A. Papaconstantopoulos and N. Bernstein at the Naval Research Center for the access to their tight binding code and the stay at NRL founded by an ONR grant. The group of Dr. Patrice Lehuede, Saint Gobain Recherche, helped with the electron microprobe measurements.
References
[1] P. S. Peercy in Materials Report, E. G. Bauer, B. W. Dodson, D. J. Ehrlich, L. C. Feldman. C. P. Flynn, M. W. Geis, J. P. Harbison, R. J. Matyi, P. S. Peercy, P. Petroff, J. M. Phillips, G. b. Stringfellow, A. Zangwill, J. Mater. Res. 5 (1990) 852.
[2] A. G. Evans, J. W. Hutchinson and Y. Wei, Actamater, 47 (1999) 4093. [3] G. Dehm, C. Scheu, M. R¨uhle and R. Raj, Acta Mater., 46 (1998) 759 [4] T.C. Campbell, Surf. Sci. Rep. 27 (1997) 1.
[5] F. Didier and J. Jupille, J. Adhesion Sci. Technol. 10 (1996) 373 ; J. Adh. 58 (1996) 253
[6] K. H. Johnson and S. V. Pepper, J. Appl. Phys. 53 (1982) 6634.
[7] P. Alemany, R. S. Boorse, J. M. Burlitch and R. Hoffmann, J. Phys. Chem. 97 (1993) 8464.
[8] D. Chatain, L. Coudurier and N. Eustathopoulos, Rev. Phys App. 23 (1988) 1055. verification
[9] C. H. F. Peden, K. B. Kidd and N. D. Shinn, J. Vac. Sci. Technol. A 9 (1991) 1518.
[10] S.K¨ostlmeier and C. Els¨asser, J. Phys. Condens. Matter 12 (2000) 1209. [11] T. Suzuki, S. Hishita, K. Oyoshi and R. Souda, Surf. Sci., 437 (1999) 289. [12] C. Verdozzi, P.A. Schultz, R. Wu, A.H. Edwards and N. Kioussis, Phys.
Rev. B, 66 (2002) 125408.
[13] R. Lazzari and J. Jupille, Surf. Sci., 482-85 (2000) 823.
[14] E. Sønderg˚ard, O.Kerjan, D.Abriou and J.Jupille, Eur. Phys. J. D. 24 (2003) 343.
[15] R.W.G. Wyckoff, Crystal structures, 2nd ed.,6, Chapter 5, Interscience, New York, (1964).
[16] P. Gu´enard, G. Renaud, A. Barbier, and M. Gautier-Soyer, Surf.Rev.Lett. 5 (1998) 321.
[17] C. F. Walters, K. F. McCarty, E.A. Soares, M.A. van Hove, Surf. Sci, 464 (2000) L732.
[18] E.A. Soares, M.A. van Hove, C. F. Walters and K.F. McCarty, Phys. Rev. B, 65 (2002) 195405.
[19] Landolt-B¨ornstein, New series vol 3b, Structure data of elements and intermetallic phases, Springer, Berlin (1971).
[20] K. Otsuka and C. M. Wayman (eds), Shape Memory Materials, Cam-bridge University Press, 1998.
[21] H. Xia, G. Parthsarathy, H. Luo, Y.K. Vohra, and A.L. Ruoff, Phys. Rev. B. 42 (1990) 6736.
[22] Y.K. Vohra and P.T. Spencer, Phys. Rev. Lett.86 (2001) 3068.
[23] M. J. Mehl and D.A. Papaconstantopoulos, Europhys. Lett. 60 (2002) 248.
[24] D.R. Trinkle, G.R. Henning, S.G. Srinivasan, D.M. Hatch, M.D. Jones, H.T.Stokes, R.C. Albers, J.W. Wilkins, Phys. Rev. Lett. 91 (2003) 25701. [25] http://cst-www.nrl.navy.mil/lattice/struk/C34.html
[26] X.F. Lin, S. Maekawa, J.N. Chapman, J. Phys 19 (2002) 2332.
[27] M.T. Lin, J. Shen, W. Kuch, H. Jenniches, M. Klaua, C.M. Schneider, J. Kirschner, Surf. Sci. 410 (1998) 290.
[28] R. Roldan Cuenya, M. Doi, S. L¨obus, R. Courths and W. Keune, Surf. Sci. 493 (2001) 338.
[29] Y. Mishin, M.J Mehl,D. Papaconstatopoulos, A.F. Voter and J.D. Kress, Phys. Rev. B. 63 (2001) 224106.
[30] N. Bernstein, M.J. Mehl and D.A. Papaconstantopoulos, Phys. Rev. B 66 (2002) 075212.
Fig. 1. Schematic Top view of an Al terminated α Al2O3(0001) surface. The hexagon indicates the position of the outer Al- layer.
Fig. 2. RHEED images showing the growth of the Ti film with the beam along the Al2O3[1100] axis.
Fig. 3. RHEED images showing the growth of the Ti film with the beam along Al2O3[2110]. The images presented were obtained as the recombination of two
de-Fig. 4. The intensity profiles of the diffraction streaks recorded along Al2O3[1100] axis (figure 2) for titanium films of thickness ranging from 0.9 to 6 nm and their corresponding fits with Voigt functions. The gradual shift in intensity from gω2 to gα1 positions is seen on the inserted figure.
Fig. 6. The diffraction patterns of silver on various Ti/Al2O3 films. Observed with the beam along Al2O3[1100].
Fig. 7. Schematic top view of the ω(0001) surface. The structure can be seen as the successive stacking a triangular lattice and a graphite like sheet. The indicated hexagon with an edge of 0.455 nm corresponds to the underlying lattice.
Fig. 8. Calculated total energy per atom of α-Ti (full line) (resp. ω-Ti (dashed line)), for lattice parameters ranging from the one giving the perfect lattice matching with the substrate (i.e. aα = 0.475/
√
3 nm for α-Ti and aω= 0.459˚Afor ω-Ti), up (down) to the equilibrium lattice constant. Note that the total energy of α-Ti is represented as a function of lα =
√
3aα whereas the total energy of ω-Ti is represented as a function of lω= aω.
![Fig. 2. RHEED images showing the growth of the Ti film with the beam along the Al 2 O3[1100] axis.](https://thumb-eu.123doks.com/thumbv2/123doknet/13233743.394871/14.892.162.883.177.924/fig-rheed-images-showing-growth-film-beam-axis.webp)
![Fig. 3. RHEED images showing the growth of the Ti film with the beam along Al 2 O 3 [2110]](https://thumb-eu.123doks.com/thumbv2/123doknet/13233743.394871/15.892.158.633.102.1019/fig-rheed-images-showing-growth-ti-film-beam.webp)
![Fig. 4. The intensity profiles of the diffraction streaks recorded along Al 2 O 3 [1100]](https://thumb-eu.123doks.com/thumbv2/123doknet/13233743.394871/16.892.152.667.220.887/fig-intensity-profiles-diffraction-streaks-recorded-al-o.webp)
![Fig. 6. The diffraction patterns of silver on various Ti/Al 2 O 3 films. Observed with the beam along Al 2 O 3 [1100].](https://thumb-eu.123doks.com/thumbv2/123doknet/13233743.394871/18.892.137.777.357.770/fig-diffraction-patterns-silver-various-films-observed-beam.webp)