Original Contributions
*Assistant Director of Nursing, University Hospital Center of Charleroi
†Biostatistician, University Hospital Center of Charleroi
‡Biostatistician, University of Liege §Professor of Biostatistics, University of Liege 㛳Professor of Anesthesia, University Hospital Center of Charleroi
Address correspondence to Ms. Bardiau at the Department of Anesthesia, University Hospital Center of Charleroi, 92 blvd. Paul Janson, 6000 Charleroi, Belgium.
Received for publication February 18, 1999; revised manuscript accepted for publication August 10, 1999.
Effectiveness of an Acute Pain
Service Inception in a General
Hospital
Franc¸oise M. Bardiau, RN, MS,*
Monique M. Braeckman, BSc,†
Laurence Seidel, MSc,‡ Adelin Albert, PhD,§
Jean G. Boogaerts, MD, PhD
㥋Department of Anesthesiology, University Hospital Center, Charleroi, Belgium, and Department of Biostatistics, University of Liege, Liege, Belgium
Study Objectives: To assess the effects of an Acute Pain Service (APS) inception on
postoperative pain management in a general teaching hospital using pain indicators as performance measures.
Design: Open, prospective, nonrandomized, observational study.
Setting: Postanesthesia Care Unit, surgical wards of University Hospital Center of
Charleroi.
Patients: 1304 patients in the pre-APS inception phase and 671 patients after its
implemention who have undergone various types of surgery (orthopedics, gynecology, urology, neurosurgery, stomatology, ear, nose, and throat, ophthalmic, abdominal, vascular-thoracic, plastic, and maxillofacial).
Interventions: An APS, nurse-based, anesthesiologist-supervised model was devised,
based on the concept that postoperative pain relief can be greatly improved by providing in-service training for surgical nursing staff and optimal use of systemic analgesics.
Measurements and Main Results: Postoperative pain was assessed using a visual
analog scale (VAS) every 4 hours for 72 hours in the two phases. Analgesic consumption was registered at the same time. Time-related VAS scores were summarized using several pain indicators. There was an overall improvement in the pain scores after APS inception. The differences were most pronounced, around 50%, in patients undergoing vascular, maxillofacial, gynecologic, and urologic surgeries, and stomatology. Regular administra-tion of paracetamol and nonsteroidal antiinflammatory drugs decreased morphine consumption in the second phase.
Conclusion: This study validates the benefits of a formal APS, using continuous
monitoring of rest pain intensity and analgesic consumption in the postoperative period. Results not only support previous research findings but also offer outcome-based tools to evaluate current practices as compared with desired outcomes. © 1999 by Elsevier Science Inc.
Keywords:Analgesics, opioid; morphine; pain, postoperative; pain service, acute: audit; visual analog scale.
Introduction
In September 1990, in their “Report of the Working Party on Pain After Surgery,” The Royal College of Surgeons of England and the College of
Journal of Clinical Anesthesia 11:583–589, 1999
Anesthetists suggested that all major hospitals should establish an Acute Pain Service (APS).1 Since then, the problem of acute pain has been addressed by a number of professional bodies, including the Agency for Health Care Policy and Research (AHCPR) in 1992, the International Association for the Study of Pain (IASP) in 1992, the American Pain Society, and the American Society of Anesthesiologists (ASA) in 1995.2–5
First described by Ready et al.6 in 1988, a number of publications on the establishment of APSs have appeared during the last few years.6 –12 Two main types of APS models have been proposed: anesthesiologist-based or nurse-based. Anesthesiologist-based APS organizations usually provide “high-tech” pain management services.6 This situation is not surprising, as anesthesiologists clearly have special expertise in the field of advanced analgesic techniques, such as patient-controlled or epidural analge-sia. Although implementation of an anesthesiologist-based APS has had considerable impact on pain management in surgical wards, only a small percentage of patients receive the benefits of the Service.12
Others have proposed a complete approach to the management of postoperative pain, e.g., the nurse-based anesthesiologist-supervised APS model described by Rawal and Berggren12in 1994, which is expected to benefit to all surgical patients. As these authors stated, the solution to the problem of inadequate postoperative pain relief lies not so much in the development of new techniques but rather in the establishment of a formal organization inside the hospital.
In Europe, a survey of APS availability in 105 hospitals from 17 countries showed that 50% of anesthesiologists were dissatisfied with postoperative pain management on surgical wards. Only 34% of hospitals had an organized APS, and few hospitals used quality assurance measures such as repeated pain assessment and documentation.13
The present study was intended to describe the effec-tiveness of a nurse-based APS inception on postoperative pain management in a general teaching hospital. We also attempt to define criteria, including pain indicators and analgesic consumption, which might be considered as performance measures.
Materials and Methods
The study was conducted in a general university teaching hospital of 1,005 beds, 240 of which are located on surgical wards. University Hospital Center of Charleroi Local Eth-ics Committee approval was obtained prior to the start of the study, and verbal informed consent was given by all patients who agreed to participate.
Phase I: The Pre-APS Period
An initial survey of postoperative pain management qual-ity was performed over a 6-month period (January to June 1997), including all surgical inpatients, undergoing vari-ous procedures [orthopedics, gynecology, urology, neuro-surgery, stomatology, ear, nose, and throat (ENT), oph-thalmic, abdominal, vascular-thoracic, plastic, and
maxillofacial surgeries]. Patients were included in the study if they were more than 15 years old, were able to read and understand French, had normal mental health, and were hospitalized for elective surgery. Inclusion was prospective and consecutive. At the time of the preopera-tive visit, patients were familiarized with a 10-cm visual analog scale (VAS) device (0⫽ no pain at all, 10 ⫽ worst imaginable pain). Exclusion criteria involved patients un-able to understand or realize the VAS test, patients trans-ferred directly to an intensive care unit (ICU) bypassing the postanesthesia care unit (PACU), and patients with emergency or ambulatory procedures. Patients receiving postoperative epidural analgesia were observed in the ICU and excluded from the present survey.
The study focused on postoperative VAS pain scores of patients treated with systemic analgesics administered intravenously (IV), including patient-controlled analgesia (PCA), intramuscular (IM) and oral routes, prescribed by anesthesiologists, and administered by ward nurses. No special instructions were given to the attending anesthesi-ologist regarding anesthesia and postoperative analgesia regimens.
On arrival in the PACU, patients were asked to rate their pain experience on the VAS device, which was held by the nurse. This process was repeated every 2 hours for the first 4 hours. When the patient moved to the general surgical ward, it was continued every 4 hours for 72 hours. Only rest pain was assessed, defined as the pain experi-enced by the patient while lying in bed. The pain thresh-old was set at 3 cm on the VAS scale.12 Pain was not assessed while the patient was asleep. Participation of nurses was voluntary at first, based on interest and/or involvement in the pain management process, but it rapidly was extended to all surgical ward staff as a new nursing activity.
All analgesic medications given for pain control were carefully recorded for each patient on a specially designed documentation form. This included the type, dose, and frequency of injected opioid ordered by the attending anesthesiologist. All results were later expressed in terms of mg morphine equivalents.14 The administration of peripherally acting analgesics, such as paracetamol and nonsteroidal antiinflammatory drugs (NSAIDs), was regis-tered. Patient records were reviewed in detail by the study investigators.
The demographic and clinical variables used in this study included age, gender, type of surgery, type of anesthesia (regional or local/regional), VAS scores, mor-phine consumption (mg), paracetamol consumption (g), and NSAID administration (no/yes) during the 72-hour postoperative period.
Phase II: The APS Inception Period
An APS nurse-based anesthesiologist-supervised model was set up in October 1997. This model, developed by Rawal and Berggren,12is based on the concept that postopera-tive pain relief can be greatly improved by providing in-service training for surgical nursing staff, and optimal use of systemic paracetamol, NSAIDs, and opioids.12
Reg-ular assessment of pain intensity by VAS every 4 hours and recording of treatment efficacy on a bedside vital-sign chart are the cornerstones of this model. The organization is based on an acute pain nurse (APN) and pain represen-tatives, namely, acute pain and section anesthesiologists, ward ,surgeons and day or night nurses. The APN makes daily rounds on all surgical departments and registers problems with analgesia, side effects of treatments, and patient satisfaction. The satisfaction of patient is assessed using a four-point verbal descriptive scale as follows: very dissatisfied, dissatisfied, satisfied, and very satisfied. The pain representatives day and night nurses are responsible for implementation of pain management guidelines and monitoring routines on his or her surgical ward, and the pain representative surgeon is in charge of pain manage-ment for his or her surgical specialty. They participate at quarterly “pain representative” meetings. Pain manage-ment guidelines were established by the departmanage-ment of anesthesia and agreed on by surgeons, with an emphasis on multimodal pain therapy using a combination of paracetamol, NSAIDS, and opioid analgesics.2,15,16 Anal-gesia option includes routine 6-hourly use of paracetamol IV or orally, and subcutaneous morphine injection if VAS is greater than 3 cm. If the patient reports inadequate pain relief within 45 minutes after injection (VAS ⬎ 3), he or she is administered a rescue injection that corresponds to 50% of the initial dose of morphine. If pain control is still unsatisfactory, the anesthesiologist on call is contacted. NSAIDs are given at fixed dosage, depending on the type of surgical procedure. Intensive in-service training of nursing and medical staff was undertaken. Nursing guide-lines establishing the assessment of pain every 4 hours and reassessment 45 minutes after rescue medication were defined. The 4-hourly interval was chosen in consideration of the 3- to 4-hour duration of morphine action and our nursing care schedule.2Information pamphlets are given to all patients, whereby they are informed preoperatively that every effort would be made to maintain their VAS below the previously defined threshold of 3 cm. Patient-controlled analgesia prescription is restricted to selected patients suffering severe pain or for long-duration treat-ment. All these pain management procedures were in-stalled and implemented simultaneously following the Rawal and Berggren12APS description.
Phase III: The Post-APS Period
Four months after the APS inception, a new survey was conducted during a 3-month period (February to April 1998) on consecutive surgical inpatients, using the same methodology as that described for Phase I.
Statistical Analysis
Results were expressed as means ⫾ SD for quantitative variables and as frequencies for categorical findings. Time-related VAS measurements were summarized using a series of pain indicators as described elsewhere: AUC: Area under the VAS-time curve (cm ⫻ hr); Mean VAS (cm);
VASmax: peak of VAS (cm); Tmax: time of VASmax (h);
PVAS⬎ 3: the persistence of VAS over 3 cm, i.e., the time
period during which VAS was above the critical threshold (h); Pdur: pain duration, i.e., the time period during which the patient reported pain (VAS⬎ 0) during the 72 hours (h).17 The comparison of mean values (age, pain indicators, and paracetamol and morphine consumption) observed in the pre-APS and post-APS periods was done by the Student t-test, whereas proportions (gender, NSAID use) were compared by the classic 2 test. To assess the efficacy of the APS on pain indicators and drug consump-tion while adjusting for age, gender, type of anesthesia, and surgical procedure, a general linear model (GLM) was applied to the data. The number of patients included in the post-APS study period was based on a power calculation assuming a 20% reduction in pain indicators, with␣ ⫽ 0.05 and  ⫽ 0.20. All statistical calculations were carried out using the SAS package (version 6.12; SAS Institute, Cary, NC) and always using all data available. Results were considered to be significant at the 5% critical level (p⬍ 0.05).
Results
A total of 1,304 patients with complete file was included in the pre-APS study period, and 671 patients were retained for the post-APS phase. Patients of the two groups were homogenous with respect to age and gender (Table 1). Mean age was 48.4⫾ 17.9 years in the evaluation study and 47.7⫾ 17.4 years in the reevaluation study (p ⫽ 0.39). In the pre-APS phase, there were 704 (54%) women and 600 Table 1. Demographic Data and Distribution of Patients Ac-cording to Type of Surgery and Type of Anesthesia in the Pre-APS and Post-APS Phases
Variable Pre-APS (nⴝ 1,304) Post-APS (nⴝ 671) p-Value Age (yrs) 48.4⫾ 17.9 47.7⫾ 17.4 0.394 Gender Female 704 (54%) 354 (53%) 0.603 Male 600 (46%) 317 (47%) Type of surgery Orthopedic 407 (31%) 141 (21%)* ⬍0.001 Neurosurgery 140 (11%) 54 (8.1%) Vascular 37 (2.8%) 32 (4.8%) Ophthalmology 42 (3.2%) 8 (1.2%)* Maxillofacial 55 (4.2%) 41 (6.1%) Gynecologic 84 (6.4%) 69 (10%)* Urologic 68 (5.2%) 58 (8.6%)* Plastic 54 (4.1%) 32 (4.8%) Abdominal 339 (26%) 184 (27%) Stomatology 22 (1.7%) 23 (3.4%)* ENT 56 (4.3%) 29 (4.3%) Type of anesthesia GA 990 (76%) 480 (72%) 0.034 LRA 314 (24%) 191 (28%)
APS ⫽ Acute Pain Service; ENT ⫽ ear, nose, and throat; GA ⫽ general anesthesia; LRA⫽ local/regional anesthesia.
(46%) men. In the post-APS phase, 355 (53%) women and 316 (47%) male patients were involved (p⫽ 0.60).
The distribution of patients according to type of sur-gery differed significantly between the two phases (p ⬍ 0.001). Multiple comparisons revealed that this fact was due mainly to a decrease in the proportion of orthopedic patients (31% in the pre-APS phase vs. 21% in the post-APS phase) and to a lesser extent of ophthalmologic patients (3.2% vs. 1.2%), compensated by a relative in-crease in the proportion of patients undergoing gyneco-logic (6.4% vs. 10%), urogyneco-logic (5.2% vs. 8.6%), and stomatology (1.7% vs. 3.4%) interventions.
As for the type of anesthesia, we found a significantly higher proportion of patients operated given local/re-gional anesthesia in the post-APS phase (28% vs. 24% in the pre-APS phase; p⫽ 0.034). As seen from Table 2, this increase essentially occurred in gynecologic and plastic surgery interventions.
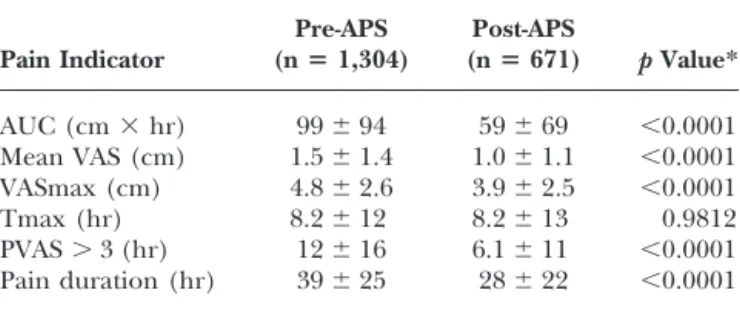
The values of pain indicators observed in the pre-APS and post-APS periods are listed in Table 3. A highly significant reduction (p ⬍ 0.0001) of all pain indicators was observed after APS inception, except for the time of maximum VAS, which remained unchanged. The APS effect on pain indicators remained highly significant, even when adjusting for age, gender, surgical procedure, and type of anesthesia (p⬍ 0.0001). As seen in Table 4, there was a major improvement (⬎50%) in the pain scores observed following APS inception in patients undergoing vascular, maxillofacial, gynecologic, and urologic surger-ies, and stomatology. In the post-APS phase, pain intensity was the highest in orthopedics and neurosurgery patients. In the latter group, most of the patients underwent disc surgery. In ophthalmology, ENT, and plastic surgeries, pain scores did not significantly improve in the post-APS phase.
Analgesic consumptions in the pre-APS and post-APS phases are listed in Table 5. Paracetamol and NSAID use increased markedly in the post-APS as compared with the pre-APS phase (paracetamol: 5.3⫾ 4.0 g vs. 9.7 ⫾ 6.2 g;
p⬍ 0.0001; NSAIDs: 20% vs. 64% of patients, p ⬍ 0.0001).
At the same time, morphine administration decreased significantly from 14⫾ 23 mg to 11 ⫾ 23 mg (p ⫽ 0.038). When adjusting for age, gender, surgical procedure, and type of anesthesia, results remained highly significant (p⬍ 0.0001) for paracetamol and NSAIDs but became nonsig-nificant for morphine (p ⫽ 0.51). Table 6 lists analgesic consumption in the various surgical groups. In the post-APS phase, paracetamol and NSAIDs were given more regularly to patients of all but one (ophthalmology) surgical department. However, morphine consumption increased in neurosurgery (from 15⫾ 26 mg to 28 ⫾ 36 mg; p ⬍ 0.001) but significantly decreased in vascular, gynecologic, urologic, and abdominal surgeries. The range of morphine consumption was extremely variable, from 0 to 177 mg in the pre-APS period and 0 to 240 mg in the post-APS period. No life-threatening respiratory events associated with opioid administration were re-ported during the study period.
Patient-controlled analgesia prescription did not in-crease after APS inception: 20 patients (1.5%) received PCA in the pre-APS and 10 in the post-APS (1.4%) phases (NS).
Discussion
This study demonstrates the improvement in pain man-agement quality after introducing a nurse-based, anesthe-siologist-supervised, APS model into a general teaching hospital. All surgical subpopulations benefited from the new organization of pain management. These results are in agreement with previous surveys.8 –10,12,18,19But, in our survey, the improvement was more pronounced in some surgical specialties, such as vascular, maxillofacial, gyneco-logic, and urologic surgeries, and stomatology, than after painless procedures, such as ophthalmology, ENT, and plastic surgeries.20
Rest pain intensity was measured using five endpoints Table 2. Number (percent) of Patients According to Type of
Surgery and Type of Anesthesia in the Pre-APS and Post-APS Phases Type of Surgery Pre-APS Post-APS GA LRA GA LRA Orthopedic 246 (60.4) 161 (39.6) 74 (52.5) 67 (47.5) Neurosurgery 129 (92.1) 11 (7.9) 51 (94.4) 3 (5.6) Vascular 15 (40.5) 22 (59.5) 13 (40.6) 19 (59.4) Ophthalmology 42 (100) 0 8 (100) 0 Maxillofacial 52 (94.5) 3 (5.5) 41 (100) 0 Gynecologic 78 (92.9) 6 (7.1) 54 (78.3) 15 (21.7)* Urologic 33 (48.5) 35 (51.5) 25 (43.1) 33 (56.9) Plastic 54 (100) 0 28 (87.5) 4 (12.5)* Abdominal 263 (77.6) 76 (22.4) 137 (74.5) 47 (25.5) Stomatology 22 (100) 0 20 (87.0) 3 (13.0) ENT 56 (100) 0 29 (100) 0 Total 990 (75.9) 314 (24.1) 480 (71.5) 191 (28.5) APS ⫽ Acute Pain Service; GA ⫽ general anesthesia; LRA ⫽ local/regional anesthesia; ENT⫽ ear, nose, and throat.
*Proportions of LRA patients in pre-APS and post-APS significantly different (p⬍ 0.05).
Table 3. Comparison of Pain Indicators in the Pre-APS and Post-APS Phases Pain Indicator Pre-APS (nⴝ 1,304) Post-APS (nⴝ 671) p Value* AUC (cm⫻ hr) 99⫾ 94 59⫾ 69 ⬍0.0001 Mean VAS (cm) 1.5⫾ 1.4 1.0⫾ 1.1 ⬍0.0001 VASmax (cm) 4.8⫾ 2.6 3.9⫾ 2.5 ⬍0.0001 Tmax (hr) 8.2⫾ 12 8.2⫾ 13 0.9812 PVAS⬎ 3 (hr) 12⫾ 16 6.1⫾ 11 ⬍0.0001 Pain duration (hr) 39⫾ 25 28⫾ 22 ⬍0.0001 APS ⫽ Acute Pain Service; VAS ⫽ visual analog scale; PVAS ⫽ persistence of VAS over 3 cm.
*p-Values remained significant when adjusting for age, gender, surgical procedure, and type of anesthesia.
during the 72-hour study period: AUC, mean VAS, VASmax, PVAS⬎ 3, and Pdur. These items, which may be considered as outcome measurements, were sensitive enough, particularly AUC, mean VAS, PVAS ⬎ 3, and Pdur, to demonstrate the predictable reduction of pain in the post-APS phase. They appear clinically relevant to pain management practices, and they are both reliable and valid. In conducting the present study, a database was instituted, which can serve as a source of information for further statistical analysis and research, and it ensures that trends of efficacy or complications can be addressed. The five endpoints described in the present study may be used to monitor quality of pain relief, providing the hospital with clear information on which areas of pain manage-ment need improvemanage-ment. These outcome data also could be used as report cards.21Designing tools to guide physi-cians and nurses to initiate and modify analgesic treat-ments expertly is an immediate challenge for implement-ing a quality assurance project.
Nurse-based APS have been previously described. Gould et al.9 reported improvement in postoperative an-algesia after introduction of such services. The general organization of our APS has been modeled on the APS described by Rawal and Berggren12in 1994. The Swedish model has been introduced in our hospital without any
modification. Briefly, pain management is based on regu-lar recording of patient’s pain intensity using VAS, reguregu-lar administration of paracetamol and NSAIDs, and optimal use of systemic opioids protocols. Pain management guidelines, standard order, and monitoring routines have been developed for each surgical specialty in cooperation with surgeons and section anesthesiologists. An acute pain anesthesiologist and a nurse coordinate pain management and chair the quarterly APS meetings of section anesthe-siologists, surgeons, and pain representative ward nurses. The usual topics of discussion at these meetings are practical pain problems, protocol modifications, sugges-tions for improvement of services, and introduction of newer techniques. Adoption of a multidisciplinary team approach leads to marked improvement in postoperative pain relief. The acute pain anesthesiologist has the overall responsibility for the APS, including monitoring routines and teaching programs for all staff. Another advantage of this model is the low cost, estimated at $3 to $4 U.S. per patient.12
Our data are in line with previous studies or suggestions from different professional groups, such as the American Pain Society, ASA, and AHCPR, showing that a multidisci-plinary approach leads to marked improvement in post-operative pain relief.2,4 –10
One of the major goals of the study was implementa-tion of clinical nursing standards for pain management. Standardization and stabilization of nursing practice re-lated to pain management is an essential aspect of improv-ing patient clinical outcomes. This findimprov-ing is in agreement with the literature, which advocates the necessity of devel-oping institutional programs for improving pain manage-ment.22,23
Morphine is still the treatment of reference for the relief of acute postoperative pain.24 The most common method of opioid use is IM or subcutaneous administra-tion on an as-needed basis. Nevertheless, the inadequacies of this method of pain management have long been recognized.25–27 In our protocol, morphine is adminis-Table 4. Comparison of Three Major Pain Indicators in the Pre-APS and Post-APS Phases According to Type of Surgery
Type of Surgery
AUC (cmⴛ h) PVAS > 3 (h) Pain duration (h)
Pre-APS Post-APS Pre-APS Post-APS Pre-APS Post-APS
Orthopedic 112⫾ 101 86⫾ 94 15⫾ 18 9.8⫾ 15 40⫾ 26 33⫾ 23 Neurosurgery 136⫾ 123 98⫾ 80 17⫾ 21 12⫾ 14* 46⫾ 24 38⫾ 23 Vascular 62⫾ 67 22⫾ 31 6.4⫾ 12 2.1⫾ 4.5* 27⫾ 19 13⫾ 15 Ophthalmology 19⫾ 18 27⫾ 30* 0.93⫾ 1.7 2.0⫾ 5.3* 13⫾ 10 13⫾ 13* Maxillofacial 92⫾ 83 55⫾ 47 11⫾ 15 5.0⫾ 7.2 39⫾ 26 28⫾ 17 Gynecologic 105⫾ 97 52⫾ 67 14⫾ 16 5.4⫾ 10 39⫾ 27 25⫾ 25 Urologic 77⫾ 91 33⫾ 47 9.7⫾ 15 3.1⫾ 7.7 32⫾ 29 18⫾ 18 Plastic 87⫾ 69 57⫾ 73* 9.3⫾ 13 6.1⫾ 14* 41⫾ 22 27⫾ 20 Abdominal 102⫾ 79 57⫾ 54 11⫾ 14 5.1⫾ 8.8 45⫾ 23 30⫾ 20 Stomatology 34⫾ 24 17⫾ 20 4.2⫾ 5.2 0.8⫾ 1.8 16⫾ 6 13⫾ 14* ENT 40⫾ 45 34⫾ 40* 2.8⫾ 5.8 2.2⫾ 4.3* 23⫾ 18 18⫾ 19*
APS⫽ Acute Pain Service; AUC ⫽ area under the curve; PVAS ⫽ persistence of visual analog scale over 3 cm; ENT ⫽ ear, nose, and throat surgery. *NS.
Table 5. Comparison of Analgesic Consumption in Pre-APS and Post-APS Phases
Drug Pre-APS Post-APS p-Value
Paracetamol (g) 5.3⫾ 4.0 9.7⫾ 6.2 ⬍0.0001
NSAIDs (%) 20% 64% ⬍0.0001
Morphine (mg) 14⫾ 23 11⫾ 23 0.0385
APS⫽ Acute Pain Service; NSAIDs ⫽ nonsteroidal antiinflammatory drugs.
*p-Values remained significant when adjusting for age, gender, surgical procedure, and type of anesthesia, except for morphine (p⫽ 0.51).
tered if the level of pain reached 3 on the VAS. With attentive nursing care, conventional subcutaneous opioid therapy appears as effective as PCA.12,28As Choinie`re et
al.28recently stated, most studies establishing the analgesic superiority of PCA compare PCA with on-demand IM dosing, and not with a regularly scheduled mode of administration of the drug. These authors also showed that PCA is more costly and does not appear to have clinical advantages in terms of patient satisfaction, the side-effect profile, or the rate of postoperative recovery after hysterectomy.28 Sophisticated analgesia techniques such as PCA is neither necessary nor realistic for all surgical patients. Equipment problems are an additional concern. In our hospital, PCA is targeted specifically to patients expected to do poorly with regularly administered subcutaneous injections (e.g., severe pain or long dura-tion of treatment) representing 1.4% of patients in the post-APS phase.29,30Perhaps PCA is better suited to other patient categories or surgical procedures.
Paracetamol and NSAIDs given by the clock and sup-plemented with subcutaneous opioid remain the mainstay of postoperative pain relief.31 In our study, these “basic analgesics” induce a light, nonsignificant morphine-spar-ing effect, but the range of morphine consumption is extremely variable. This finding is in line with previous surveys.24 In addition, Egberg et al.32 showed that the postoperative requirement for morphine could be re-duced by one half by providing preoperative information about severity and duration of postoperative pain and twice daily postoperative visits and support. This phenom-enon of “opioid sparing” by the nonpharmacologic method of providing psychological support and informa-tion to patients must be integrated. Although comparison with other studies is difficult, these results compare favor-ably with published data on opioid analgesia.
Regional techniques were restricted to selected patients not included in the present survey. These patients were managed in the ICU, where staff and equipment ensure appropriate monitoring and management of
complica-tions. In the present study, we focused only on patients managed in surgical wards. We are convinced that re-gional techniques are ideal after most major surgical procedures and that their use should be extended to the general wards after development of appropriate facilities. Formal protocols, with monitoring of sedation level, res-piration, and blood pressure, permit systematic and epi-dural analgesic drugs to be given safely in the general wards.15,33
The principal limitation related to the study design is that only rest pain was assessed. Adequate control of this kind of pain is easier than movement pain.9 Further studies will now focus on pain during mobilization using the same methodologic approach. Moreover, the impact of improved postoperative analgesia in terms of overall surgical outcome remains to be determined.
The present study validates the benefits of a formal nurse-based APS, using continuous monitoring of rest pain intensity and analgesic consumption in the postop-erative period. Results not only support previous research findings but also offer outcome-based tools to evaluate current practices as compared with desired outcomes.
References
1. Report of a working party. Royal College of Surgeons of England and College of Anesthetists Commission on Provision of Surgical Service. London, September 1990.
2. Acute Pain Management Guideline Panel: Acute Pain Manage-ment: Operative or Medical Procedures and Trauma. Clinical Practice Guideline. AHCPR Publication No. 92-0032. Rockville, MD: Agency for Health Care Policy and Research, Public Health Service, US Department of Health and Human Services, February 1992.
3. Ready LB, Edwards WT (eds): Management of Acute Pain: A Practical Guide. Seattle: International Association for the Study of Pain (IASP) Publications, 1992.
4. Practice guidelines for acute pain management in the perioper-ative setting. A report by the American Society of Anesthesiolo-Table 6. Comparison of Analgesic Consumption in Pre-APS and Post-APS Phases According to Type of Surgery
Type of Surgery
Paracetamol (g) NSAIDs Morphine (mg)
Pre-APS Post-APS Pre-APS Post-APS Pre-APS Post-APS
Orthopedic 5.1⫾ 3.9 10⫾ 7.3 93 (23) 81 (57) 19⫾ 26 22⫾ 37* Neurosurgery 5.3⫾ 3.6 12⫾ 6.5 29 (21) 43 (80) 15⫾ 26 28⫾ 36 Vascular 4.6⫾ 2.8 7.5⫾ 5.9 0 (0) 16 (50) 5.6⫾ 9.8 1.3⫾ 4.8 Ophthalmology 2.8⫾ 1.7 3.0⫾ 2.4* 2 (5) 1 (12)* 1.4⫾ 9.3 0.6⫾ 1.8* Maxillofacial 6.3⫾ 4.5 11⫾ 5.7 15 (27) 27 (66) 13⫾ 17 10⫾ 13* Gynecologic 6.4⫾ 4.0 9.3⫾ 6.9 10 (12) 41 (59) 14⫾ 25 5.1⫾ 10 Urologic 6.0⫾ 4.7 9.5⫾ 5.4 8 (12) 25 (43) 15⫾ 30 3.2⫾ 8.2 Plastic 6.0⫾ 3.5 9.5⫾ 4.5 9 (17) 18 (56) 8.7⫾ 18 14⫾ 15* Abdominal 5.6⫾ 4.4 9.8⫾ 5.7 74 (22) 136 (74) 12⫾ 20 7.6⫾ 12 Stomatology 5.0⫾ 2.3 7.4⫾ 2.2 7 (32) 20 (87) 5.3⫾ 13 2.4⫾ 4.4* ENT 3.8⫾ 2.4 9.3⫾ 5.8 10 (18) 21 (72) 5.7⫾ 13 5.2⫾ 8.5*
Note: Values for paracetamol and morphine are given as means⫾ SD, and values for NSAIDs are given as number (percent). APS⫽ Acute Pain Service; NSAIDs ⫽ nonsteroidal antiinflammatory drugs; ENT ⫽ ear, nose, and throat.
gists Task Force on Pain Management, Acute Pain Section. Anesthesiology 1995;82:1071– 81.
5. American Pain Society, Quality of Care Committee: Quality improvement guidelines for the treatment of acute pain and cancer pain. JAMA 1995;274:1874 – 80.
6. Ready LB, Oden R, Chadwick HS, et al: Development of an anesthesiology-based postoperative pain management service. Anesthesiology 1988;68:100 – 6.
7. Macintyre PE, Runciman WB, Webb RK: An acute pain service in an Australian teaching hospital: the first year. Med J Aust 1990; 153:417–21.
8. Wheatley RG, Madej TH, Jackson IJB, Hunter D: The first year’s experience of an acute pain service. Br J Anaesth 1991;67:353–9. 9. Gould TH, Crosby DL, Harmer M, et al: Policy for controlling pain after surgery: effect of sequential changes in management. Br Med J 1992;305:1187–-93.
10. Schug SA, Haridas RP: Development and organizational struc-ture of an acute pain service in a major teaching hospital. Aust N Z J Surg 1993;63:8 –13.
11. Breivik H: Recommendations for foundation of a hospital-wide postoperative pain service—a European view. Pain Digest 1993;3: 27–30.
12. Rawal N, Berggren L: Organization of acute pain services: a low-cost model. Pain 1994;57:117–23.
13. Rawal N, Allvin R: Acute pain services in Europe: a 17-nation survey of 105 hospitals. The EuroPain Acute Pain Working Party. Eur J Anaesth 1998;15:354 – 63.
14. Freye E: Opioid Agonists, Antagonists and Mixed Narcotic Anal-gesics. Berlin: Springer Verlag, 1987.
15. Dahl JB, Rosenberg J, Dirkes WE, Mogensen T, Kehlet H: Prevention of postoperative pain by balanced analgesia. Br J Anaesth 1990;64:518 –20.
16. Dahl JB, Kelhet H: Non-steroidal anti-inflammatory drugs: ratio-nale for use in severe postoperative pain. Br J Anaesth 1991;66: 703–12.
17. Bardiau FM, Braeckman MM, Boogaerts JG: Postoperative pain assessment: methodology for VAS curve analysis [Abstract]. Br J Anaesth 1998;80:A635.
18. Tighe SQM, Bie JA, Nelson RA, Skues MA: The acute pain service: effective or expansive care? Anaesthesia 1998;53:397– 403. 19. Harmer M, Davies KA: The effect of education, assessment and a standardised prescription on postoperative pain management. The value of clinical audit in the establishment of acute pain services. Anaesthesia 1998;53:424 –30.
20. Benedetti C, Bonica JJ, Belluci G: Pathophysiology and therapy of postoperative pain: a review. In: Benedetti C, Chapman CR, Moricca G (eds): Advances in Pain Research and Therapy. New York: Raven Press, 1984:373– 407.
21. Starck PL, Adams J, Sherwood G, et al: Development of a pain management report card for an acute care setting. Adv Prac Nurs Q 1997;3:57– 63.
22. Miakowski C, Jacox A, Hester NO, et al: Interdisciplinary guide-lines for the management of acute pain: implications for quality improvement. J Nurs Care Qual 1992;7:1– 6.
23. Barnason S, Merboth M, Pozehl B, et al: Utilizing an outcomes approach to improve pain management by nurses: a pilot study. Clin Nurse Specialist 1998;12:28 –36.
24. Ferrante FM: Opioids. In: Ferrante FM, VadeBoncouer TR (eds): Postoperative Pain Management. New York: Churchill Living-stone, 1993:145–209.
25. Spence AA: Relieving acute pain. Br J Anaesth 1980;52:245– 6. 26. Mitchell RWD, Smith G: The control of acute postoperative pain.
Br J Anaesth 1989;63:147–58.
27. Oden RV: Acute postoperative pain: incidence, severity, and the etiology of inadequate treatment. Anesthesiol Clin North Am 1989; 7:1–15.
28. Choinie`re M, Rittenhouse BE, Perreault S, et al: Efficacy and costs of patient-controlled analgesia versus regularly adminis-tered intramuscular opioid therapy. Anesthesiology 1998;89:1377– 88.
29. Moote CA: Postoperative pain management— back to basics [Editorial]. Can J Anaesth 1995;42:453–7.
30. D’Haese J, Vanlersberghe C, Umbrain V, Camu F: Pharmaco-economic evaluation of a disposable patient-controlled analgesia device and intramuscular analgesia in surgical patients. Eur J Anaesthesiol 1998;15:297–303.
31. Tramer MR, Williams JE, Carroll D, Wiffen PJ, Moore RA, McQuay HJ: Combining analgesic efficacy of non-steroidal anti-inflammatory drugs given by different routes in acute and chronic pain: a qualitative systematic review. Acta Anaesthesiol Scand 1998;42:71–9.
32. Egberg LD, Battit GE, Welch CE, et al: Reduction of postopera-tive pain by encouragement and instruction of patients. N Engl J Med 1964;270:825–7.
33. VadeBoncouer TR, Ferrante FM: Management of a postoperative pain service at a teaching hospital. In: Ferrante FM, VadeBon-couer TR (eds): Postoperative Pain Management. New York: Churchill Livingstone, 1993:625–50.