The Volatile Composition of the Inner Coma of Comet 46P
/Wirtanen: Coordinated
Observations Using iSHELL at the NASA-IRTF and Keck
/NIRSPEC-2
Nathan X. Roth1,2,12 , Boncho P. Bonev3,12 , Michael A. DiSanti4,12 , Neil Dello Russo5,12 , Adam J. McKay3,4,12 , Erika L. Gibb6,12 , Mohammad Saki6,12 , Younas Khan6,12 , Ronald J. Vervack, Jr.5,12 , Hideyo Kawakita7,12 , Anita L. Cochran8 , Nicolas Biver9 , Martin A. Cordiner1,10 , Jacques Crovisier9, Emmanuël Jehin11 , and Harold Weaver5 1
Solar System Exploration Division, Astrochemistry Laboratory Code 691, NASA Goddard Space Flight Center, 8800 Greenbelt Road, Greenbelt, MD 20771, USA
nathaniel.x.roth@nasa.gov
2Universities Space Research Association, Columbia, MD 21046, USA 3
Department of Physics, American University, 4400 Massachusetts Avenue NW, Washington, DC 20016, USA 4
Solar System Exploration Division, Planetary Systems Laboratory Code 693, NASA-GSFC, Greenbelt, MD 20771, USA 5
Johns Hopkins University Applied Physics Laboratory, 11100 Johns Hopkins Road, Laurel, MD 20723, USA 6
Department of Physics & Astronomy 1 University Boulevard, University of Missouri-St.Louis, St. Louis, MO 63121, USA 7
Koyama Astronomical Observatory, Kyoto Sangyo University, Motoyama, Kamigamo, Kita-ku, Kyoto, 603-8555, Japan 8
University of Texas at Austin/McDonald Observatory, 2512 Speedway, Stop C1402, Austin, TX 78712, USA 9
LESIA, Observatoire de Paris, Université PSL, CNRS, Sorbonne Université, Université de Paris, 5 place Jules Janssen, F-92195 Meudon, France 10
Department of Physics, Catholic University of America, Washington DC, USA
11Space sciences, Technologies & Astrophysics Research(STAR) Institute, University of Liège, Belgium Received 2020 September 30; revised 2020 December 16; accepted 2020 December 17; published 2021 March 15
Abstract
The 2018 perihelion passage of comet 46P/Wirtanen afforded an opportunity to measure the abundances and spatial distributions of coma volatiles in a Jupiter-family comet with exceptional spatial resolution for several weeks surrounding its closest approach to Earth (Δmin ∼0.078 au on UT December 16). We conducted
near-infrared spectroscopic observations of 46P/Wirtanen using iSHELL at the NASA Infrared Telescope Facility on UT 2018 December 18 in direct coordination with observations using the newly upgraded NIRSPEC-2 instrument at the W. M. Keck Observatory, and securely detected fluorescent emission from CH3OH, C2H6, and H2O. This
coordinated campaign utilizing the two premier near-infrared facilities in the northern hemisphere enabled us to sample distinct projections of the coma into the plane of the sky simultaneously, and provided an unprecedented view into the inner coma of 46P/Wirtanen near closest approach. We report rotational temperatures, production rates, and abundance ratios (i.e., mixing ratios) for all sampled species and compare our iSHELL results to simultaneous (or near-simultaneous) measurements taken with NIRSPEC-2. We demonstrate the extraordinary synergy of coordinated measurements using iSHELL and NIRSPEC-2, and advocate for future cometary studies that jointly leverage the capabilities of these two facilities.
Unified Astronomy Thesaurus concepts: Molecular spectroscopy(2095);High resolution spectroscopy (2096);
Near infrared astronomy(1093); Comae(271);Comets(280)
1. Introduction
The study of comets affords a unique window into the birth, infancy, and subsequent evolution of the solar system. Soon after their accretion from the solar nebula at the time of planet formation, comets were gravitationally scattered across the solar system, with many emplaced in their present-day dynamical reservoirs, the Oort cloud or the Kuiper disk. Here they have remained in the cold outer solar system for the last ∼4.5 Gyr, suffering minimal thermal and radiative processing. Systematically characterizing the compositions of their nuclei should therefore provide insights into the composition and thermochemical processes in the solar nebula where (and when) they formed (Bockelée-Morvan et al.2004; Mumma &
Charnley2011; Dello Russo et al.2016a; Bockelée-Morvan & Biver2017).
The composition of the nucleus is predominantly inferred through remote sensing observations, with each wavelength from the millimeter to the UV probing a distinct chemical and physical domain of the coma. Long-slit, high-resolution near-infrared spectroscopy samples the chemistry of the coma within a few thousand kilometers of the nucleus, providing informa-tion in two dimensions, spectral and spatial. With their wide spectral grasp, modern state-of-the-art near-infrared echelle spectrometers, such as iSHELL at the NASA Infrared Telescope Facility(IRTF) and NIRSPEC-2 at the W. M. Keck Observatory, provide not only compositional information by sampling multiple strong transitions of targeted coma mole-cules, but also spatial information via measurement of molecular column densities along their slits(of length 15″ for iSHELL and 24″ for NIRSPEC-2). These measurements provide abundances of trace species (e.g., ethane (C2H6),
methanol (CH3OH), hydrogen cyanide (HCN), ammonia
(NH3)) relative to water (H2O), the dominant volatile in the
comae of most measured comets, and reveal how volatiles (ices) are associated or segregated in the nucleus by searching © 2021. The Author(s). Published by the American Astronomical Society.
12
Visiting Astronomer at the Infrared Telescope Facility, which is operated by the University of Hawaii under contract NNH14CK55B with the National Aeronautics and Space Administration.
Original content from this work may be used under the terms of theCreative Commons Attribution 4.0 licence. Any further distribution of this work must maintain attribution to the author(s) and the title of the work, journal citation and DOI.
for common or distinct outgassing sources (e.g., Dello Russo et al.2016b).
The 2018 close approach to Earth of Jupiter-family comet (JFC) 46P/Wirtanen (hereafter Wirtanen) presented an oppor-tunity to perform ground-based measurements of coma composition and spatial distributions of the various species with exceptional sensitivity and spatial resolution, making it one of the most favorable JFC apparitions of the decade. Taken near Wirtanen’s closest approach to Earth, our observations with the iSHELL spectrograph at the NASA-IRTF on Maunakea, HI sampled the volatile composition of the innermost 200 km of the coma (as projected onto the sky plane) with a seeing-limited spatial resolution at a scale of ∼9 km pixel−1 at the geocentric distance of the comet.
Coordinated observations of common species with NIRSPEC-2 at the W. M. Keck Observatory were highly complementary, enabling us to measure volatile production and spatial associations in a distinctly different projection of the coma into the plane of the sky from that sampled by iSHELL. Here we report detections and spatial profiles of emissions for the three species targeted by both instruments on December 18: H2O(or its proxy, OH*prompt emission; Bonev et al.2006),
C2H6, and CH3OH. In Section2, we discuss our observations
and data analysis. In Section 3, we present our results. In Section 4, we discuss our results and compare them to coordinated observations with NIRSPEC-2. In Section 5, we advocate for future studies leveraging the capabilities of iSHELL and NIRSPEC-2 in concert.
2. Observations and Data Reduction
Wirtanen is a JFC with a period P= 5.4 yr, and was the original target of the Rosetta (ESA) mission. During its 2018 apparition, Wirtanen reached perihelion (q = 1.05 au) on UT 2018 December 12, and passed closest to the Earth (Δmin= 0.0774 au, approximately 30 lunar distances) on UT
2018 December 16. As part of a coordinated observing campaign, on UT 2018 December 18 we targeted Wirtanen with the high-resolution, near-infrared facility spectograph iSHELL(Rayner et al.2012,2016) at the 3 m NASA-IRTF to
characterize its volatile composition. The observing log is shown in Table 1. We utilized two custom iSHELL settings (referred to as L-Custom and L3-Custom, see Table1) so as to
fully sample a suite of molecular abundances. We oriented the slit along the Sun-comet line. Coordinated observations were
carried out with NIRSPEC-2(Martin et al.2016,2018) at the
10 m W. M. Keck Observatory(Table1). A detailed analysis of
these observations is reported in Bonev et al.(2021).
The iSHELL observations were performed with a 6 pixel (0 75) wide slit with resolving power (λ/Δλ) ∼ 4.5 × 10⁴. We
used a standard ABBA nod pattern in which the telescope is nodded along the slit between successive exposures, thereby placing the comet at two distinct positions along the slit(“A” and“B”) to facilitate sky subtraction. The A and B beams were symmetrically placed about the midpoint along the 15″ long slit and separated by half its length. Wirtanen was bright and easily acquired with iSHELL’s near-infrared active guiding system. Combining spectra of the nodded beams as A–B–B + A canceled emissions from thermal background, instrumental biases, and sky emission(lines and continuum) to second order in air mass. Flux calibration was performed using an appropriately placed bright infraredflux standard star using a wide(4 0) slit.
We employed data reduction procedures that have been rigorously tested and are described extensively in the refereed literature(Bonev2005; DiSanti et al. 2006,2014; Villanueva et al.2009; Radeva et al.2010), including their application to
unique aspects of iSHELL spectra (DiSanti et al. 2017; Roth et al.2020). Each echelle order within an iSHELL setting was
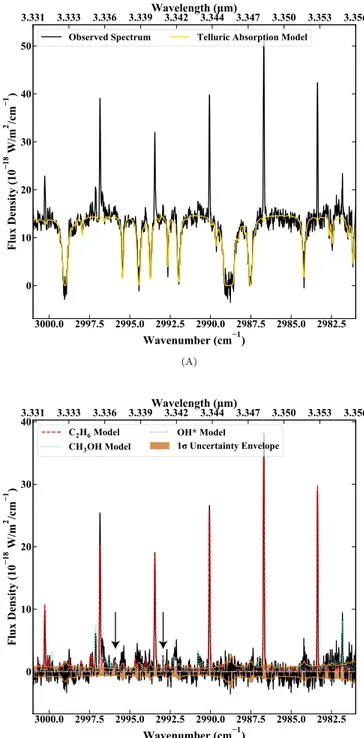
processed individually as previously described, such that each row corresponded to a unique position along the slit, and each column to a unique wavelength. Spectra were extracted from the processed frames by summing the signal over 15 rows (approximately 2 5), seven rows to each side of the nucleus, defined as the peak of dust emission in a given spectral order. We determined contributions from continuum and gaseous emissions in comet spectra as previously described (e.g., DiSanti et al. 2016, 2017) and illustrate the procedure in
Figure 1. We convolved the fully resolved transmittance function to the resolving power of the data( ∼ 4.5 × 10⁴) and scaled it to the level of the comet continuum. We then subtracted the modeled continuum to isolate cometary emission lines and compared synthetic models of fluorescent emission for each targeted species to the observed line intensities.
Nucleocentric(or nucleus-centered) production rates (QNC)
were determined using a well-documented formalism (Dello Russo et al.1998; DiSanti et al.2001; Bonev2005; Villanueva et al. 2011b); see Section 3.2.2 of DiSanti et al. (2016) for
further details. The QNC were multiplied by an appropriate
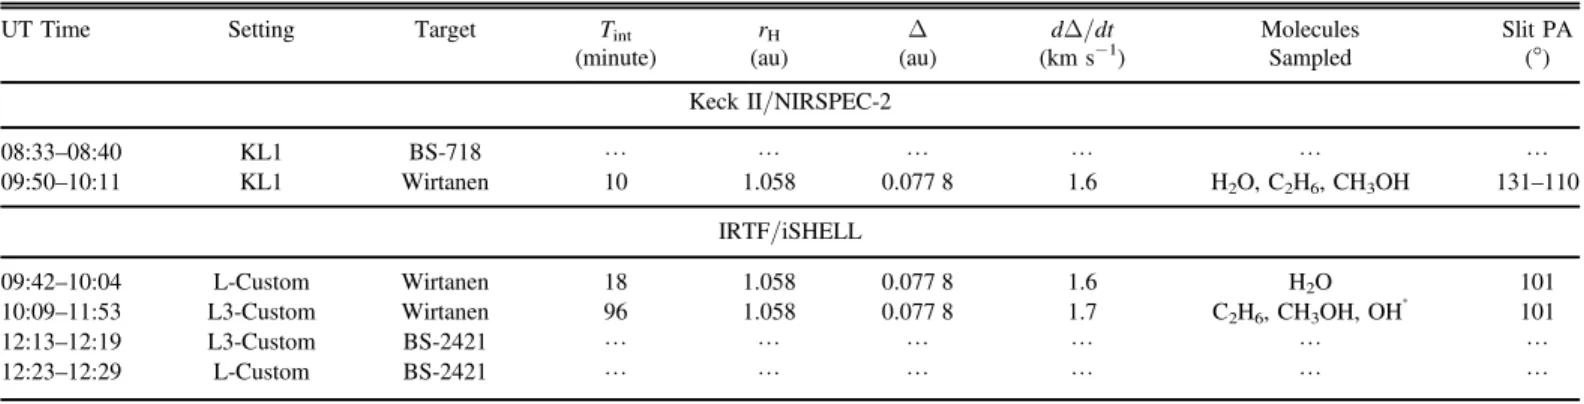
growth factor (GF), determined using the Q-curve Table 1
Observing Log
UT Time Setting Target Tint rH Δ dΔ/dt Molecules Slit PA
(minute) (au) (au) (km s−1) Sampled (°)
Keck II/NIRSPEC-2
08:33–08:40 KL1 BS-718 L L L L L L
09:50–10:11 KL1 Wirtanen 10 1.058 0.077 8 1.6 H2O, C2H6, CH3OH 131–110
IRTF/iSHELL
09:42–10:04 L-Custom Wirtanen 18 1.058 0.077 8 1.6 H2O 101
10:09–11:53 L3-Custom Wirtanen 96 1.058 0.077 8 1.7 C2H6, CH3OH, OH
*
101
12:13–12:19 L3-Custom BS-2421 L L L L L L
12:23–12:29 L-Custom BS-2421 L L L L L L
Note. rH,Δ, and dΔ/dt are the heliocentric distance, geocentric distance, and geocentric velocity, respectively, of Wirtanen at the time of observations. Tintis the integrated time on-source. L-Custom and L3-Custom are custom iSHELL settings spanning 2.81–3.09 μm and 3.12–3.41 μm, respectively.
methodology(e.g., Dello Russo et al.1998; DiSanti et al.2001; Bonev 2005; Gibb et al. 2012) to establish total (or global)
production rates (Q). The Q-curve formalism corrects for atmospheric seeing, which suppresses signal along lines of sight passing close to the nucleus owing to the use of a narrow slit, as well as for potential perpendicular drift of the comet during an exposure sequence. We estimate the uncertainty in Q due to flux calibration to be 3% for the L-Custom setting and
2% for the L3-Custom setting based on the standard deviation offlux calibration factors (Γ, W/m2/cm−1/(counts/s)) within each echelle order taken from eight exposures. We incorporated this additional uncertainty into our production rates. Global production rates for all detected molecules are listed in Table2. GFs were determined for H2O, C2H6, and CH3OH.
2.1. Mixing Ratios of Volatile Species 2.1.1. Molecular Fluorescence Analysis
Synthetic models of fluorescent emission for each targeted species were compared with observed line intensities, after correcting each modeled g-factor (line intensity) for the monochromatic atmospheric transmittance at its Doppler-shifted wavelength (according to the geocentric velocity of the comet at the time of the observations). The g-factors used in synthetic fluorescent emission models in this study were generated with quantum mechanical models developed for H2O
(Villanueva et al. 2012a), C2H6 (Villanueva et al. 2011b),
and CH3OH (Villanueva et al. 2012a; DiSanti et al. 2013).
A Levenburg–Marquardt nonlinear minimization technique (Villanueva et al. 2008) was used to fit fluorescent emission
from all species simultaneously in each echelle order, allowing for high precision results, even in spectrally crowded regions containing many spectral lines within a single instrumental resolution element. Production rates for each sampled species were determined from the appropriatefluorescence model at the rotational temperature of each molecule(Section2.1.2).
2.1.2. Determination of Rotational Temperature
Rotational temperatures (Trot) were determined using
correlation and excitation analyses as described in Bonev (2005), Bonev et al. (2008), DiSanti et al. (2006), Villanueva
et al. (2008). In general, well-constrained rotational
tempera-tures can be determined for individual species having intrinsically bright lines and for which a sufficiently broad range of excitation energies is sampled. Utilizing the large spectral grasp of iSHELL, these conditions were satisfied for H2O, C2H6, and CH3OH.
We found consistent and well-constrained rotational tem-peratures for H2O and C2H6. The Trotfor H2O(94 ± 5 K) was
in formal agreement with that for C2H6(90 ± 3 K). Although
the Trotfor CH3OH(88-+15
18) was consistent with both of these, it was less well-constrained. This is consistent with previous work demonstrating that rotational temperatures for primary species sampled at near-infrared wavelengths are generally in agreement (see for example Gibb et al. 2012; DiSanti et al.
2016, and references therein). 3. Results
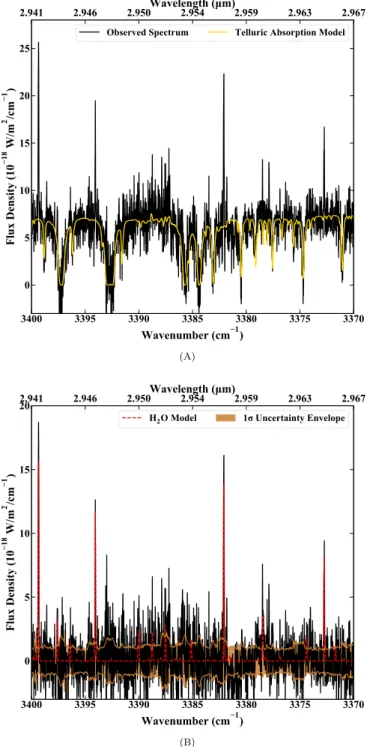
We securely detected molecular emission from H2O, C2H6,
CH3OH, and OH* (prompt emission) in the coma of
Wirtanen. Figures 1 and 2 show clear detections of multiple transitions of each detected species superimposed on the cometary continuum.
3.1. Spatial Profiles
We were able to extract spatial profiles for H2O(measured
directly or through its proxy, OH*; see Bonev et al. 2006),
C2H6, and CH3OH in Wirtanen(Figure3). The high brightness
and small geocentric distance of Wirtanen enabled us to map Figure 1. (A) Extracted iSHELL spectrum showing detections of C2H6,
CH3OH, and OH* in Wirtanen on UT 2018 December 18. The gold trace overplotted on the uppermost cometary spectrum is the telluric absorption model(convolved to the instrumental resolution and scaled to the observed continuum level). (B) Residual emission spectrum (after subtracting the telluric absorption model) with individual fluorescence models overlaid (color coded and styled by species) and the 1σ uncertainty envelope shaded in bronze. Arrows indicate positions of OH*lines.
the inner coma(within ∼200 km to either side of the nucleus) in exceptional detail. The small phase angle (f ∼ 18°) during our observations must be considered when interpreting spatial profiles, as the anti-sunward hemisphere was nearly along the line-of-sight toward the comet. Nevertheless, Figure 3(A)
shows that the spatial profiles for OH*and CH3OH were both
broader than C2H6, and all three gases were broader than the
dust continuum and enhanced in the projected anti-sunward direction. Similarly, Figure3(B) shows that the spatial profile
for H2O was broader than the continuum, and again showed
enhancement in the projected sunward direction. The anti-sunward enhancement for H2O could be indicative of coma
production of H2O, in which icy grains are driven by radiation
pressure into the anti-sunward tail before releasing their H2O
ice into the coma (e.g., Kawakita et al. 2013; Knight & Schleicher 2013).
It is important to note that Figures 3(A) and (B) do not
correspond to simultaneous measurements. The C2H6 and
CH3OH measurements are based on almost two hours of clock
time (i.e., ∼20% of the nucleus rotational period of 9 hr; Farnham et al. 2018; Jehin et al. 2018; Handzlik et al. 2019).
The illumination of active regions on the nucleus could have changed significantly during this time compared with the source region for H2O. Bearing this in mind, the broader H2O
distribution (Figure 3(A)) when compared with co-measured
C2H6is highly consistent with higher signal-to-noise
measure-ments (especially for H2O) from NIRSPEC-2 (Bonev et al. 2021), and independently suggest an additional source of H2O,
perhaps from icy grains.
3.2. Comparison with Other iSHELL Observations During the 2018–2019 Perihelion Passage
The observations reported here represent one component of a multi-date iSHELL observing campaign toward Wirtanen during its 2018–2019 perihelion passage (Dello Russo et al.
2019). Saki et al. (2020) reported H2O production rates and a
stringent upper limit on OCS (carbonyl sulfide) on UT 2018 December 14 and 19, and Khan et al. (2021) reported
detections of C2H6, CH3OH, C2H2, and NH3 and examined
potential short-term variability in H2O and HCN production ,
with emphasis on UT December 21. McKay et al. (2021)
reported detections of H2O, C2H6, and CH3OH, as well as
upper limits on CO and CH4, on UT 2019 January 11–13. Our
H2O production rate,(8.25 ± 0.60) × 1027s−1, is considerably
higher than that reported by Saki et al.(2020) and Khan et al.
(2021) (both papers report ∼ 6 × 1027 s−1). This suggests that H2O production in Wirtanen may have been variable on
timescales of days. Combi et al. (2020) found Q(H2O)
∼1.6 × 1028 s−1 on UT 2018 December 22 based on
SOHO/SWAN observations of Lyα, although these measure-ments span a considerably larger portion of the coma than those from iSHELL and may sample more of the extended H2O
emission from icy grain production.
In terms of the trace species C2H6and CH3OH, our C2H6
mixing ratio is in agreement with that from Khan et al.(2021)
(0.71 ± 0.09% relative to H2O), yet our CH3OH mixing ratio is
lower than the Khan et al. value (4.26 ± 0.34%). In contrast, our CH3OH mixing ratio is in formal agreement with those
reported by McKay et al. (2021) (∼3%), while our C2H6
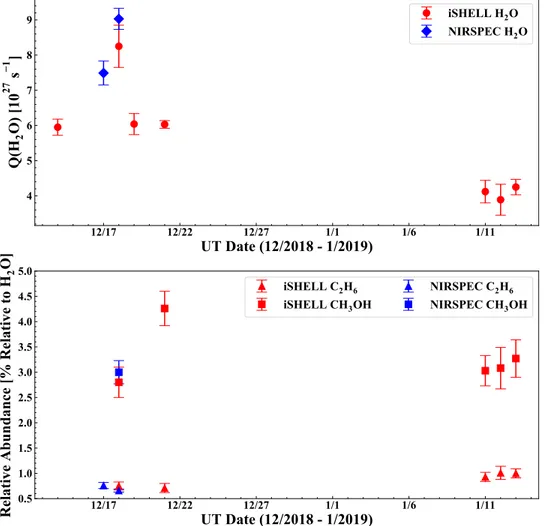
mixing ratio is marginally lower than their value of 1%. Collectively, these results emphasize the complex nature of Wirtanen’s volatile outgassing throughout the 2018–2019 perihelion passage. Figure 4 shows the evolution of Q(H2O)
as well as mixing ratios of C2H6and CH3OH as measured by
iSHELL and NIRSPEC-2 (Section 4; Bonev et al. 2021).
Future work will comprehensively address potential variability in H2O production and trace species mixing ratios in Wirtanen
as measured with iSHELL.
3.3. Comparison with Comets Measured at Near-infrared Wavelengths
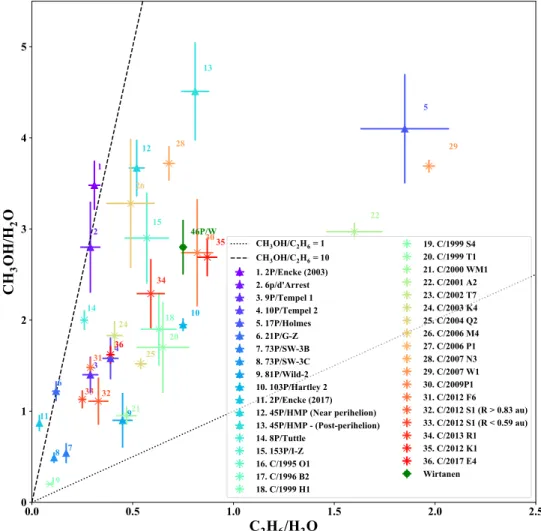
Our results indicate that Wirtanen was enriched in both C2H6
and CH3OH compared with their respective mean abundances
in JFCs characterized to date at near-IR wavelengths (Dello Russo et al.2016a). Figure5reinforces that the abundances of these two molecules in Wirtanen were more similar to those measured in OCCs. Of JFCs characterized to date, perhaps the most similar to our results is 45P/Honda–Mrkos–Pajdus̆áková (points #12 and 13 in Figure 5), which displayed similarly
enriched C2H6and CH3OH (DiSanti et al.2017; Dello Russo
et al. 2020). It is also interesting to compare with the
hyperactive comet 103P/Hartley 2 (point #10), which had a similarly high C2H6 mixing ratio, yet considerably lower
CH3OH. In making these comparisons, it is important to note
that although C2H6, CH3OH, and H2O were measured very
close in time in Wirtanen, this was not necessarily the case for other comets. For a comparison of additional molecules sampled in Wirtanen at near-infrared wavelengths(e.g., HCN, Table 2
Molecular Composition of 46P/Wirtanen as Measured by iSHELL
Setting Species Trota GFb Qc Relative Abundance
(K) (1025 s−1) Qx/QH2O d Qx/QC2H6 e UT 2018 December 18, rH= 1.07 au, Δ = 0.078 au L-Custom H2O 94± 5 2.4± 0.2 825± 60 100 131± 14 L3-Custom C2H6 90± 3 2.05± 0.04 6.3± 0.2 0.75± 0.08 1 CH3OH 88-+1518 2.3± 0.1 22± 2 2.8± 0.3 3.5± 0.2 Notes. a Rotational temperature. b
Growth factor. This represents the ratio of global Q to QNCbased on the central 0 75× 0 83 aperture having peak emission flux.
c
Production rate.
dMixing ratio with respect to H
2O(H2O= 100). L3-Custom mixing ratios were calculated using Q(H2O) as measured with L-Custom. An additional 10% uncertainty was incorporated into the L3-Custom H2O mixing ratios to account for the non-simultaneous observations of H2O.
e
C2H2, CO) during the 2018–2019 perihelion passage in the
context of the comet population, see Khan et al.(2021), McKay
et al.(2021), and Bonev et al. (2021).
4. Coordinated Observations with iSHELL and NIRSPEC-2
Wirtanen’s long on-sky availability from the summit of Maunakea, HI, near the closest approach to Earth enabled us to leverage the capabilities of the two premier near-infrared facilities in the northern hemisphere: iSHELL at the NASA-IRTF and the newly upgraded NIRSPEC-2 at the W. M. Keck Observatory. This allowed a direct comparison of our iSHELL
results with measurements from a 10 m telescope and a somewhat longer (24″) slit, invaluable for spatial-spectral studies of the innermost coma. We coordinated these observa-tions to sample distinct projecobserva-tions of the coma into the plane of the sky, and chose instrument settings so as to target emissions from the same coma volatiles.
Table 1 shows that our L-Custom iSHELL observations sampling H2O were taken nearly simultaneously with
NIR-SPEC-2, whereas our L3-Custom observations sampling C2H6
and CH3OH were taken after the conclusion of the NIRSPEC-2
observations. This short temporal spread reduces the effects of potential short-term variability on the measurements between the two instruments. We discuss the results of measurements from both instruments and advocate for their joint application to future cometary observations.
4.1. Molecular Composition of the Coma
Table3shows a comparison of the rotational temperatures, production rates, and mixing ratios for each molecule in Wirtanen as derived from iSHELL and NIRSPEC-2 observa-tions. As described in Bonev et al. (2021 and references therein), we utilized C2H6 as an alternative compositional
baseline when measuring mixing ratios.
The Trot measured for H2O and C2H6 are in formal
agreement, and the measured iSHELL CH3OH Trot is
consistent with all of these within 1σ uncertainty (the NIRSPEC-2 CH3OH Trotwas assumed). The production rates
and mixing ratios for C2H6agree within 1σ uncertainty for both
instruments, and the H2O and CH3OH production rates agree
within 2σ. Taking into account the different projections of the coma sampled by each measurement, these measurements suggest compositional uniformity of the coma within several hundred km of the nucleus.
4.2. Potential Extended Sources in Wirtanen.
Wirtanen is considered a hyperactive comet(e.g., Lis et al.
2019and references therein), with its unusually high Q(H2O)
for its small size (∼1 km) attributed to significant release of H2O from icy grains in its coma. One of the more well-known
hyperactive comets is 103P/Hartley 2, visited by the EPOXI spacecraft, in which both direct nucleus release and icy grain production of H2O were unambiguously observed (A’Hearn
et al.2011). The long-slit iSHELL and NIRSPEC-2
measure-ments enabled us to search for these putative icy grain contributions to Wirtanen’s coma through analysis of spatial profiles for each volatile. As detailed in Bonev et al. (2021), the
NIRSPEC-2 measurements indicate a significant icy grain contribution to H2O production in Wirtanen(up to 40%), and
potentially an icy grain contribution to CH3OH production
as well.
Similar to the compositional results, our iSHELL measure-ments of spatial associations in Wirtanen are in excellent agreement with those obtained with NIRSPEC-2. We oriented the iSHELL slit along the Sun-comet line(PA 101°) to sample material released into projected sunward- and anti-sunward-facing hemispheres. This provided the most direct measure of the projected sunward versus anti-sunward outflow, although the small solar phase angle(18°) meant that the true Sun-comet direction was oriented nearly along the line-of-sight. The simultaneous/contemporaneous spectra with NIRSPEC-2 were taken in rotator stationary mode, meaning the slit PA changed Figure 2. (A)–(B) Extracted iSHELL spectra showing detections of H2O in
Wirtanen on UT 2018 December 18, with traces and labels as described in Figure1.
continuously yet remained close to the projected Sun-comet direction over the course of those observations(for details see Bonev et al. 2021). For comparison with our December 18
observations, iSHELL measurements on December 21 reported in Khan et al.(2021) provided spatial information along the slit
at two independent orientations(along the Sun-comet PA, and orthogonal to this direction).
In comparing our results on December 18 with iSHELL and NIRSPEC-2, it is important to consider differences in their fields of view. Our iSHELL observations used a 0 75 wide by 15″ long slit, with a spatial scale of approximately 0 167 pixel−1. The NIRSPEC-2 observations used a 0 43 wide by 24″ long slit, with a scale of 0 129 pixel−1. As detailed in Section 2, we extracted spatial profiles—maps of emission intensity along the slit—and used these to establish a GF through the Q-curve methodology, which relates nucleocentric production rate(QNC) to global production rate (Q). Given the
apparent hyperactivity of Wirtanen, coupled with its small Δ during our observations, it is important to address whether the 15″ long iSHELL slit captured as large a contribution from icy grains to H2O production as did the 24″ long NIRSPEC-2 slit.
To address this issue, we carefully examined the spatial profiles for H2O as measured by iSHELL and NIRSPEC-2,
as well as the Q-curve calculation used in determining GF for measurements with each instrument. Figure 6 shows the spatial profiles for H2O, C2H6, and CH3OH extracted from
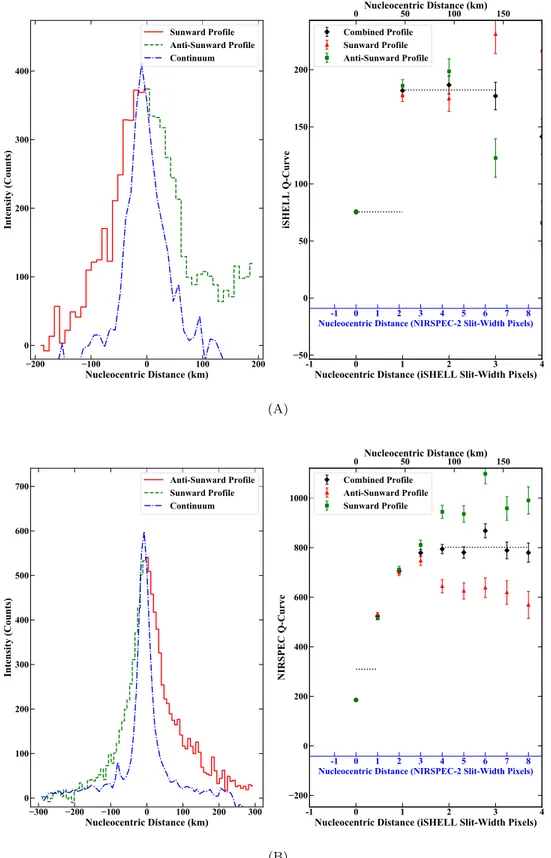
each instrument overlain on one another for comparison, and Figure 7 shows a comparison of spatial profiles for H2O
emission as measured with iSHELL and NIRSPEC-2 along with their corresponding Q-curves. Figure6(A) shows that the
H2O profiles from each instrument are both clearly extended in
the projected anti-sunward direction, indicative of the icy grains in Wirtanen’s coma. Importantly, the iSHELL H2O
spatial profile is at least as extended as (if not moreso than) that from NIRSPEC-2. This is not surprising, as the iSHELL measurements taken along the Sun-comet line would be expected to provide the most direct picture of the projected sunward/anti-sunward hemispheres. Comparing the spatial extent of the iSHELL and NIRSPEC-2 profiles, Figure 6(A)
suggests that iSHELL captured the vast majority of the icy grain contribution to H2O production that was sampled by
NIRSPEC-2, and that the differences in slit lengths between the two instruments did not significantly affect Q(H2O) as
measured by each.
We now detail the Q-curve calculation for each instrument. This Q-curve methodology averages the emission intensity on either side of and equidistant from the nucleus. Averages were stepped in successive intervals along the slit (0 38 for NIRSPEC-2; 0 83 for iSHELL), resulting in a “symmetric” Q-curve. These symmetric Q-values increase with nucleo-centric distance owing primarily to atmospheric seeing, until reaching a terminal value—the global production rate, Q. The GF is calculated as the ratio of the weighted mean of the terminal pixel Q-values (slit-width pixels 4–8 for NIRSPEC; slit-width pixels 1–3 for iSHELL) to the nucleocentric Q-value. Figures 7(A) and (B) demonstrate this Q-curve methodology
graphically for iSHELL and NIRSPEC-2, respectively. Examination of the Q-curves with the spatial scales for both instruments overlain demonstrates that the spatial profiles (and associated Q-curves) are quite consistent, and that the same range of nucleocentric distances can be used to derive the GF’s for both instruments; however, it is important to remember that Figure 3.(A) Spatial profiles of emissions for co-measured C2H6(black, solid), CH3OH(blue, dashed), OH*(pink, dotted), dust continuum (red, dashed–dotted), and the stellar PSF(green, dashed–dotted–dotted) in Wirtanen on UT 2018 December 18 measured with iSHELL. Color-coded 1σ uncertainties are shown for the profile of each species. The slit was oriented along the projected Sun-comet line(position angle 101°), with the Sun-facing direction to the left as indicated. Also shown is the Sun-comet-Earth angle(phase angle, β) of 18°. (B) Spatial profiles of emissions for H2O(black, solid), dust continuum (red, dashed–dotted), and the stellar PSF (green, dashed–dotted-dotted) in Wirtanen on UT 2018 December 18 measured with iSHELL.
each instrument was sampling a different projection of the coma into the sky plane because of the differing slit PA values. It is important to note the higher angular resolution and longer slit (and thus, the larger number of Q-values) afforded by NIRSPEC-2. The NIRSPEC-2 Q-curve shows that a terminal value had been reached(i.e., a nucleocentric distance at which the signal is no longer dominated by atmospheric seeing) by the third successive Q-value (NIRSPEC-2 slit-width pixel #3). The iSHELL Q-curve shows that a terminal value had been reached by the first successive Q-value (iSHELL slit-width pixel#1) because of the lower angular resolution and shorter slit, and that thisfirst pixel would have included the still-rising Q-values indicated at the first and second NIRSPEC-2 slit-width pixels. The inclusion of these coma regions that were still being suppressed by atmospheric seeing into thefirst terminal iSHELL Q-value (and therefore the iSHELL GF) could have lowered its value. Nevertheless, the agreement between the Q(H2O) and spatial profiles as measured by each instrument is
excellent, and differences in field of view between the two instruments did not significantly affect the results.
5. Applications to Future Cometary Observations In total, iSHELL observations of Wirtanen were taken on multiple dates spanning 2018 December–2019 February, including six dates near closest approach to Earth. A
comprehensive analysis of the full suite of iSHELL observa-tions is the subject of a future study. Analysis of iSHELL observations on December 21 are reported in Khan et al. (2021), with observations characterizing the hypervolatiles CO,
CH4, and C2H6 in January reported by McKay et al. (2021).
The coordinated iSHELL and NIRSPEC-2 observations on December 18 and their consistency point toward their application to these broader iSHELL observations of Wirtanen, and in turn to future cometary studies leveraging the capabilities of both instruments, as we now discuss.
5.1. The Unique Strengths of NIRSPEC-2
NIRSPEC-2 occupies a unique niche in cometary composi-tion studies. With its cross-dispersed capability, it can sample nearly the entire parent volatile chemistry in a single setting, enabling simultaneous measures of mixing ratios relative to H2O as well as to C2H6. It offers the longest slit available at
near-infrared wavelengths. This affords the most sensitive test of coma spatial associations possible, and the sensitivity of the Keck II 10 m primary provides time-resolved measures of targeted species with relatively short on-source integration times. With its high sensitivity, it is well-suited for measuring challenging weaker species such as C2H4and HC3N, as well as
deuterated species(e.g., H2O and HDO, CH4and CH3D, C2H6
and C2H5D). It also provides high signal-to-noise, spatially
Figure 4.Top: water production rates in Wirtanen measured with iSHELL on December 14 and 19(Saki et al.2020), December 18 (this work), December 21 (Khan
et al.2021), and January 11–13 (McKay et al.2021), and with NIRSPEC-2 on December 17–18 (Bonev et al.2021). Bottom: relative abundances (% relative to H2O) for C2H6and CH3OH, with references for each date as cited above.
resolved measures of emission intensities along the slit. Therefore, NIRSPEC-2 can provide the most sensitive temporally and spatially resolved measurements of coma volatile composition.
5.2. The Unique Strengths of iSHELL
Since its commissioning in 2016, iSHELL has quickly become an indispensable instrument for studies of parent volatiles in comets. With its daytime observing capability
(unique among ground-based IR facilities) and its high fraction of observing time dedicated to planetary science, the IRTF permits conducting cometary science on timescales ranging from days to months, as demonstrated by serial campaigns on comet Wirtanen(Dello Russo et al.2019), aspects of which are
included in companion papers(Khan et al.2021; McKay et al.
2021). Its capabilities at M-band are unmatched, enabling high
observing efficiency while sampling multiple strong transitions of CO, H2O, and OCS. Recently published iSHELL studies
have significantly increased the number of comets for which Figure 5. Mixing ratios of CH3OH and C2H6relative to H2O in comets characterized to date at near-infrared wavelengths(Dello Russo et al.2016a; DiSanti et al.2017; Faggi et al.2018,2019; Roth et al.2018; Dello Russo et al.2020). Comets are numbered and color coded, with triangles for JFCs and X’s for OCCs.
Table 3
Comparison of iSHELL and NIRSPEC-2 Results
Species Trot
a
(K) Qb(1025s−1) Relative Abundance
iSHELL NIRSPEC iSHELL NIRSPEC iSHELL NIRSPEC
Qx/QH2Oc Qx/QC2H6d Qx/QH2Oc Qx/QC2H6d H2O 94± 5 87± 1 825± 60 903± 30 100 131± 14 100 151± 7 C2H6 90± 3 84-+54 6.3± 0.2 5.98± 0.19 0.75± 0.08 1 0.66± 0.03 1 CH3OH 88-+1518 (87) 22± 2 27.32± 1.91 2.8± 0.3 3.5± 0.2 3.03± 0.23 4.57± 0.35 Notes. a
Rotational temperature. Values in parentheses are assumed. b
Production rate. c
Mixing ratio with respect to H2O(H2O= 100).
d
OCS has been securely measured (Saki et al.2020), a highly
underrepresented species owing to the smaller spectral grasp and/or lower sensitivity of previously available instruments. Its near-infrared guiding capabilities enable active guiding inde-pendent of the wavelength of the spectrograph setting, including for challenging daytime targets (e.g., 2P/Encke; Roth et al.2018).
Furthermore, prior to the commissioning of iSHELL, near-infrared cometary studies at the IRTF were typically limited to a few measurements of a given comet taken over a limited
range of heliocentric distances, and often on a limited number of dates. Such measurements frequently suffered from a “snapshot” bias, and so could not test for many of the variable behaviors reported in comets. However, under-standing these phenomena and their occurrence across the broader comet population is crucial to placing the results of cometary compositional studies in the context of solar system formation. iSHELL has ameliorated such “snapshot” biases. It is routinely used to sample coma composition on multiple dates and at a variety of heliocentric distances Figure 6.(A) Spatial profiles of emissions for H2O in Wirtanen on UT 2018 December 18 as measured by iSHELL(red, dashed), NIRSPEC-2 (black, solid) and continuum(blue, dashed–dotted). Color-coded 1σ uncertainties are shown for the profile of each species. The iSHELL slit was oriented along the projected Sun-comet line(position angle 101°), with the Sun-facing direction to the left. The NIRSPEC-2 observations were conducted in rotator stationary mode, with the slit PA decreasing from 131° to 110° over the course of the night. (B) Spatial profiles of emissions for C2H6in Wirtanen as measured by iSHELL(red, dashed), NIRSPEC-2 (black, solid), and continuum (blue, dashed–dotted). C. Spatial profiles of emissions for CH3OH in Wirtanen as measured by iSHELL(red, dashed), NIRSPEC-2 (black, solid), and continuum (blue, dashed–dotted). NIRSPEC-2 profiles taken from Bonev et al. (2021).
(e.g., DiSanti et al. 2017; Roth et al. 2018), including
pre-and post-perihelion(e.g., Faggi et al.2019; Roth et al.2020).
These iSHELL studies can reveal how coma abundances and spatial associations vary (or remain consistent) “seasonally” across a perihelion passage.
5.3. Synergy between iSHELL and NIRSPEC-2 for Cometary Science
Clearly, iSHELL and NIRSPEC-2 are highly complementary for studies of parent volatiles in comets, with each instrument offering unique strengths and powerful capabilities. When Figure 7.(A) Left: spatial profile of emissions for H2O and dust continuum in Wirtanen as measured by iSHELL, with sunward and anti-sunward hemispheres labeled. Right: Q-curve for H2O with iSHELL, with the NIRSPEC-2 spatial scale overlain for comparison.(B) Left: spatial profile of emissions for H2O and dust continuum in Wirtanen as measured by NIRSPEC-2. Right. Q-curve for H2O with NIRSPEC-2.
conducted simultaneously, observations with iSHELL and NIRSPEC-2 can bridge these realms of specialized measure-ments over various timescales, and Wirtanen provided an excellent opportunity for demonstrating such synergies. With NIRSPEC-2 now fully commissioned, this work demonstrates that even more complex measurements of future comets utilizing the two facilities in a coordinated fashion will be possible. These include programs simultaneously placing the iSHELL and NIRSPEC-2 slits at mutually orthogonal orienta-tions on the sky, thereby enabling comprehensive spatial-spectral studies(e.g., Bonev et al.2013). In a similar fashion,
complementary instrument settings could be chosen so as to sample different (yet partially overlapping) species with each facility/instrument. For example, NIRSPEC-2 may be used to target L-band molecules(H2O, H2CO, C2H6, CH4, HCN, NH3,
C2H2) in a single instrument setting, while iSHELL
simulta-neously samples M-band molecules(H2O, CO, OCS); together,
these observations sample essentially the entire parent volatile inventory at once, which is only possible with these two instruments working in concert. Clearly, the possibilities for paradigm-challenging science from coordinated observations such as those described here abound.
It must be recognized that despite these synergies, each instrument plays a role in comprehensive parent volatile studies that cannot be replicated by the other. Atop the 10 m Keck II primary, NIRSPEC-2 detected H2O, C2H6, and CH3OH with
high signal-to-noise far along the slit in only ten minutes on-source on December 18, and additionally detected HCN, C2H2,
and NH3with only 19 minutes on-source during the previous
night (Bonev et al. 2021). iSHELL cannot perform these
narrow time-domain measurements on any but the brightest comets and the species with the strongest transitions—securely detecting NH3 and C2H2 in Wirtanen with iSHELL required
hours of on-source integration time(Khan et al.2021). In terms
of strong species in a bright comet, for a comet similar to Wirtanen(rH= 1 au, Δ = 0.1 au, Q(H2O)=1028s−1), C2H6and
CH3OH could be detected (5σ in a single line) down to
(depleted) abundances of 0.03% and 0.3%, respectively, in one hour on-source integration with iSHELL. On the other hand, the high fraction of dedicated planetary science time on iSHELL that enables studies of coma volatile composition and spatial distributions on long timescales (days, months, seasonally) is simply not available with NIRSPEC-2.
Furthermore, we emphasize that it is as remarkable that we found the observed consistency between the iSHELL and NIRSPEC-2 production rates as it would have been had we found significant differences. In the context of the variable nature of comets(with an ever increasing number of examples in the literature, well beyond those cited here), the only production rates for which we should truly expect agreement are those taken truly simultaneously—in this case, H2O. In
future comets, coordinated iSHELL and NIRSPEC-2 measure-ments may well reveal short-term variability in production for molecules observed in cadence, as was the case for C2H6and
CH3OH in this study.
6. Conclusion
The 2018 perihelion passage of Wirtanen presented an extraordinary opportunity to characterize the relative abun-dances, spatial associations, and production mechanisms of its volatiles with resolution rarely available to ground-based measurements. Coordinated observations of Wirtanen with
the iSHELL and NIRSPEC-2 spectrographs revealed a coma with asymmetries along the projected Sun-comet vector. These iSHELL measurements detected emission from H2O, C2H6,
and CH3OH in the inner coma of Wirtanen. Spatial profiles
extracted for these molecules revealed that H2O emission was
extended in the projected anti-sunward hemisphere, perhaps due to sublimation from icy grains in the coma, whereas C2H6
emission was narrower. These results were highly consistent with those from coordinated NIRSPEC-2 observations(Bonev et al. 2021), with excellent agreement among measured
rotational temperatures, molecular production rates, and spatial profiles between the two instruments. This campaign empha-sized the highly complementary nature of simultaneous (or contemporaneous) observations of comets with these two facilities, and highlighted the outstanding opportunities that will be afforded by future cometary studies leveraging these instruments.
Data for this study were obtained at the NASA Infrared Telescope Facility (IRTF), operated by the University of Hawaii under contract NNH14CK55B with the National Aeronautics and Space Administration, as well as from the W. M. Keck Observatory, which is operated as a scientific partnership among the California Institute of Technology, the University of California, and the National Aeronautics and Space Administration. We are most fortunate to the have the opportunity to conduct observations from Maunakea, and recognize the very significant cultural role and reverence that the summit of Maunakea has always had within the indigenous community. N.X.R. acknowledges support by the NASA Postdoctoral Program at the NASA Goddard Space Flight Center, administered by Universities Space Research Associa-tion under contract with NASA, and by NASA Headquarters under the NASA Earth and Space Science Fellowship Program (grant NNX16AP49H). A.J.M. acknowledges support from the NASA Solar System Observations and Solar System Workings Programs. BPB acknowledges support from the NSF Astron-omy and Astrophysics grants 1616306 and 200939 and from the NASA Solar System Workings Programs(NNX17AC86G). B.P.B., N.D.R., and R.J.V. acknowledge support from the NASA Solar System Observations program through grant 80NSSC17K0705, and M.A.D. and A.J.M. acknowledge support through grant 18-SSO18_2-0040. E.J. is a F.R.S-FNRS Belgian Senior Research Associate.
ORCID iDs
Nathan X. Roth https://orcid.org/0000-0002-6006-9574
Boncho P. Bonev https://orcid.org/0000-0002-6391-4817
Michael A. DiSanti https://orcid.org/0000-0001-8843-7511
Neil Dello Russo https://orcid.org/0000-0002-8379-7304
Adam J. McKay https://orcid.org/0000-0002-0622-2400
Erika L. Gibb https://orcid.org/0000-0003-0142-5265
Mohammad Saki https://orcid.org/0000-0003-2277-6232
Younas Khan https://orcid.org/0000-0003-4773-2674
Ronald J. Vervack, Jr. https: //orcid.org/0000-0002-8227-9564
Hideyo Kawakita https://orcid.org/0000-0003-2011-9159
Anita L. Cochran https://orcid.org/0000-0003-4828-7787
Nicolas Biver https://orcid.org/0000-0003-2414-5370
Martin A. Cordiner https://orcid.org/0000-0001-8233-2436
Emmanuël Jehin https://orcid.org/0000-0001-8923-488X
References
A’Hearn, M. F., Belton, M. J. S., Delamere, W. A., et al. 2011,Sci,332, 1396
Bockelée-Morvan, D., & Biver, N. 2017,PTRSA,375, 20160252
Bockelée-Morvan, D., Crovisier, J., Mumma, M. J., & Weaver, H. A. 2004, in Comets II, ed. H. U. Keller & H. A. Weaver(Tucson, AZ: Univ. Arizona Press), 391
Bonev, B. P. 2005, PhD thesis, Univ. Toledo
Bonev, B. P., Dello Russo, N., DiSanti, M. A., et al. 2021,PSJ, 2, 45 Bonev, B. P., Mumma, M. J., DiSanti, M. A., et al. 2006,AJ,653, 774
Bonev, B. P., Mumma, M. J., Radeva, Y. L., et al. 2008,ApJL,680, L61
Bonev, B. P., Villanueva, G. L., Paganini, L., et al. 2013,Icar,222, 740
Combi, M. R., Mäkinen, T. T., Bertaux, J. L., et al. 2020,PSJ,1, 72
Dello Russo, N., DiSanti, M. A., Mumma, M. J., Magee-Sauer, K., & Rettig, T. W. 1998,Icar,135, 377
Dello Russo, N., Kawakita, H., Bonev, B. P., et al. 2020,Icar,355, 113411
Dello Russo, N., Kawakita, H., Vervack, R. J., Jr., & Weaver, H. A. 2016a, Icar,278, 301
Dello Russo, N., McKay, A. J., Saki, M., et al. 2019, EPSC-DPS Joint Meeting 2019,13, 742
Dello Russo, N., Vervack, R. J. J., Kawakita, H., et al. 2016b,Icar,266, 152
DiSanti, M. A., Bonev, B. P., Dello Russo, N., et al. 2017,AJ,154, 246
DiSanti, M. A., Bonev, B. P., Gibb, E. L., et al. 2016,ApJ,820, 20
DiSanti, M. A., Bonev, B. P., Magee-Sauer, K., et al. 2006,ApJ,650, 470
DiSanti, M. A., Bonev, B. P., Villanueva, G. L., & Mumma, M. J. 2013,ApJ, 763, 19
DiSanti, M. A., Mumma, M. J., Dello Russo, N., & Magee-Sauer, K. 2001, Icar,153, 361
DiSanti, M. A., Villanueva, G. L., Paganini, L., et al. 2014,Icar,228, 167
Faggi, S., Mumma, M. J., Villanueva, G. L., Paganini, L., & Lippi, M. 2019, AJ,158, 254
Faggi, S., Villanueva, G. L., Mumma, M. J., & Paganini, L. 2018,AJ,156, 68
Farnham, T. L., Knight, M. M., & Schleicher, D. G. 2018, CBET,4571, 1
Gibb, E. L., Bonev, B. P., Villanueva, G., et al. 2012,ApJ,750, 102
Handzlik, B., Drahus, M., & Kurowski, S. 2019, EPSC-DPS Joint Meeting 2019,13, 1775
Jehin, E., Moulane, Y., Manfroid, J., & Pozuelos, F. 2018, CBET, 4585, 1 Kawakita, H., Kobayashi, H., Dello Russo, N., et al. 2013,Icar,222, 723
Khan, Y., Gibb, E. L., Bonev, B. P., et al. 2021,PSJ,2, 20
Knight, M. M., & Schleicher, D. G. 2013,Icar,222, 691
Lis, D. C., Bockelée-Morvan, D., Güsten, R., et al. 2019,A&A,625, L5
Martin, E. C., Fitzgerald, M. P., McLean, I. S., et al. 2018,Proc. SPIE,10702, 107020A
Martin, E. C., Fitzgerald, M. P., McLean, I. S., Kress, E., & Wang, E. 2016, Proc. SPIE,9908, 99082R
McKay, A. J., DiSanti, M. A., Cochran, A. L., et al. 2021,PSJ,2, 21
Mumma, M. J., & Charnley, S. B. 2011,ARA&A,49, 471
Radeva, Y. L., Mumma, M. J., Bonev, B. P., et al. 2010,Icar,206, 764
Rayner, J., Bond, T., Bonnet, M., et al. 2012,Proc. SPIE,8446, 84462C
Rayner, J., Tokunaga, A., Jaffe, D., et al. 2016,Proc. SPIE,9908, 990884
Roth, N. X., Gibb, E. L., Bonev, B. P., et al. 2018,AJ,156, 251
Roth, N. X., Gibb, E. L., Bonev, B. P., et al. 2020,AJ,159, 42
Saki, M., Gibb, E. L., B., P. B., et al. 2020,AJ,160, 184
Villanueva, G. L., DiSanti, M. A., Mumma, M. J., & Xu, L.-H. 2012a,ApJ,
747, 3
Villanueva, G. L., Mumma, M. J., Bonev, B. P., et al. 2009,ApJL,690, L5
Villanueva, G. L., Mumma, M. J., Bonev, B. P., et al. 2012a,JQSRT,113, 202
Villanueva, G. L., Mumma, M. J., DiSanti, M. A., et al. 2011b,Icar,216, 227
Villanueva, G. L., Mumma, M. J., & Magee-Sauer, K. 2011b, JGR, 116, E08012
Villanueva, G. L., Mumma, M. J., Novak, R. E., & Hewagama, T. 2008,Icar,