HAL Id: hal-00328581
https://hal.archives-ouvertes.fr/hal-00328581
Submitted on 10 Oct 2008
HAL is a multi-disciplinary open access
archive for the deposit and dissemination of
sci-entific research documents, whether they are
pub-lished or not. The documents may come from
teaching and research institutions in France or
abroad, or from public or private research centers.
L’archive ouverte pluridisciplinaire HAL, est
destinée au dépôt et à la diffusion de documents
scientifiques de niveau recherche, publiés ou non,
émanant des établissements d’enseignement et de
recherche français ou étrangers, des laboratoires
publics ou privés.
research
H. Fischer, M. Birk, C. Blom, B. Carli, M. Carlotti, T. von Clarmann, L.
Delbouille, A. Dudhia, D. Ehhalt, M. Endemann, et al.
To cite this version:
H. Fischer, M. Birk, C. Blom, B. Carli, M. Carlotti, et al.. MIPAS: an instrument for atmospheric
and climate research. Atmospheric Chemistry and Physics, European Geosciences Union, 2008, 8 (8),
pp.2188. �hal-00328581�
www.atmos-chem-phys.net/8/2151/2008/ © Author(s) 2008. This work is distributed under the Creative Commons Attribution 3.0 License.
Chemistry
and Physics
MIPAS: an instrument for atmospheric and climate research
H. Fischer1, M. Birk2, C. Blom1, B. Carli3, M. Carlotti4, T. von Clarmann1, L. Delbouille5, A. Dudhia6, D. Ehhalt7, M. Endemann8, J. M. Flaud9, R. Gessner10, A. Kleinert1, R. Koopman8, J. Langen8, M. L´opez-Puertas11, P. Mosner10, H. Nett8, H. Oelhaf1, G. Perron12, J. Remedios13, M. Ridolfi4, G. Stiller1, and R. Zander5
1Forschungszentrum Karlsruhe und Univ. Karlsruhe, Institute for Meteorology and Climate Research, Karlsruhe, Germany 2Deutsches Zentrum f¨ur Luft- und Raumfahrt, Germany
3Istituto di Fisica Applicata, N. Carrara (IFAC) del Consiglio Nazionale delle Ricerche (CNR), Firenze, Italy 4Dipartimento di Chimica Fisica e Inorganica – University of Bologna, Bologna, Italy
5Groupe Infra-Rouge de Physique Atmosph´erique et Solaire (GIRPAS), D´epartement AGO, Universit´e de Li`ege, Belgium 6Atmospheric, Oceanic and Planetary Physics, Clarendon Laboratory, Oxford University, UK
7Forschungszentrum J¨ulich, Institut f¨ur Atmosph¨arische Chemie, (ICG3), J¨ulich, Germany 8ESA/ESRIN, Frascati, Italy and ESA/ESTEC, Noordwijk, The Netherlands
9Laboratoire Interuniversitaire des Syst`emes Atmosph´eriques (LISA), CNRS, Universit´e Paris VII et XII, France 10EADS Astrium GmbH, Friedrichshafen und M¨unchen, Germany
11Instituto de Astrof´ısica de Andaluc´ıa (IAA), Granada, Spain 12ABB Bomem Inc., Quebec, Canada
13Earth Observation Science (EOS), Space Research Centre, Department of Physics and Astronomy, Univ. of Leicester, UK
Received: 1 June 2007 – Published in Atmos. Chem. Phys. Discuss.: 25 June 2007 Revised: 23 January 2008 – Accepted: 22 February 2008 – Published: 16 April 2008
Abstract. MIPAS, the Michelson Interferometer for Pas-sive Atmospheric Sounding, is a mid-infrared emission spectrometer which is part of the core payload of ENVISAT. It is a limb sounder, i.e. it scans across the horizon detecting atmospheric spectral radiances which are inverted to verti-cal temperature, trace species and cloud distributions. These data can be used for scientific investigations in various re-search fields including dynamics and chemistry in the alti-tude region between upper troposphere and lower thermo-sphere.
The instrument is a well calibrated and characterized Fourier transform spectrometer which is able to detect many trace constituents simultaneously. The different concepts of retrieval methods are described including multi-target and two-dimensional retrievals. Operationally generated data sets consist of temperature, H2O, O3, CH4, N2O, HNO3,
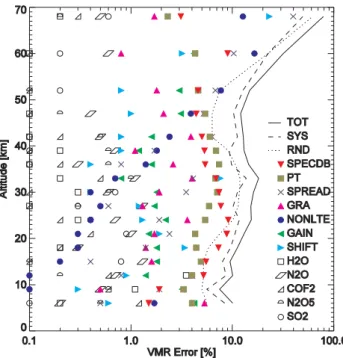
and NO2profiles. Measurement errors are investigated in
de-tail and random and systematic errors are specified. The re-sults are validated by independent instrumentation which has been operated at ground stations or aboard balloon gondolas and aircraft. Intercomparisons of MIPAS measurements with other satellite data have been carried out, too. As a result, it
Correspondence to: H. Fischer ([email protected])
has been proven that the MIPAS data are of good quality. MIPAS can be operated in different measurement modes in order to optimize the scientific output. Due to the wealth of information in the MIPAS spectra, many scientific re-sults have already been published. They include intercom-parisons of temperature distributions with ECMWF data, the derivation of the whole NOyfamily, the study of
atmo-spheric processes during the Antarctic vortex split in Septem-ber 2002, the determination of properties of Polar Strato-spheric Clouds, the downward transport of NOxin the
mid-dle atmosphere, the stratosphere-troposphere exchange, the influence of solar variability on the middle atmosphere, and the observation of Non-LTE effects in the mesosphere.
1 Introduction
MIPAS, the Michelson Interferometer for Passive Atmo-spheric Sounding, is a mid-infrared emission spectrometer selected for the core payload of ENVISAT by ESA due to several favourable properties (Fischer et al., 2000). Within this part of the atmospheric spectrum there is a wide va-riety of important molecules which have vibration-rotation bands with absorption lines well suited for detection. At-mospheric signals are generally higher than in other parts of the spectrum because the Planck function maximizes at about
10 µm for atmospheric temperatures. Generally, instruments working in the mid-infrared can be significantly smaller than those operating at longer wavelengths. This is dictated by diffraction limits and the high spectral resolution needed to observe the trace species of interest. An advantage of the mid-infrared in comparison to spectral regions with shorter wavelengths is that instruments operating in this region al-low measurements during day and night.
MIPAS is a limb sounder, i.e. it scans across the hori-zon detecting spectral radiances emitted by the atmosphere (Fischer and Oelhaf, 1996). Due to the measurement geom-etry, i.e. observing the atmosphere along tangential optical paths, MIPAS can measure also trace gases with very low mixing ratios. The vertical resolution of the measured verti-cal profiles is in the order of some kilometres, much better compared to nadir sounding instruments. On the other hand, the limb geometry restricts the observable altitude range to heights above clouds so that information on tropospheric pa-rameters is limited.
MIPAS can be used for scientific investigations in vari-ous research fields. A main objective is to study dynamics and chemistry of the upper troposphere, stratosphere, meso-sphere, and lower thermosphere. Global measurements of many atmospheric quantities over several years contribute to climatological analyses. Weather forecasting can use the global measurements at upper atmospheric levels for data assimilation. Physical processes in the atmosphere caus-ing e.g. non-local thermodynamic equilibrium can be stud-ied with the highly resolved spectra much better than ever before.
In order to detect many trace gases simultaneously the in-strument has to cover a wide spectral range with high spec-tral resolution. The concept underlying the space version of MIPAS draws on the experience gained from several exper-iments exploiting Fourier transform spectrometers. In par-ticular, the MIPAS-B (balloon) experiment (Friedl-Vallon et al., 2004) can be regarded as a precursor of the MIPAS satel-lite experiment even if the type of interferometer is not ex-actly the same. An instrument similar to MIPAS-B was flown on different aircraft (Keim et al., 2004). Both types of ex-periment have helped to establish the feasibility of the MI-PAS space experiment. Basic knowledge about interferom-eters gained from Fourier spectrominterferom-eters measuring the at-tenuated solar radiation has also been taken into account. In this context the ATMOS (Atmospheric Trace Molecule Spec-troscopy) experiment has to be mentioned which has yielded simultaneous measurements of a large number of trace con-stituents in the Middle Atmosphere (Farmer et al., 1987).
The aim of this publication is to present an overview of the MIPAS space experiment. It considers the scientific ob-jectives and describes the instrument concept, the observ-ing capabilities, and the calibration. A further challenge has been to fix the retrieval methods for the processing of the large amount of data in an efficient and timely fashion. This problem is addressed in Sect. 4 while Sect. 5 describes the
observation strategy and the various measurement modes of MIPAS. This section includes also a short description of the functioning of the MIPAS instrument during the past years. The various measurement modes of MIPAS are to a certain degree related to the scientific objectives. Due to the absolute calibration of the measurements of a mid-infrared instrument the errors of the derived parameters can be estimated with confidence. In Sect. 7, the geophysical validation of the MI-PAS measurements, which is necessary for all space exper-iments, is described. Some examples of MIPAS results are presented in Sect. 8 in order to demonstrate the capability of the experiment. Finally, the conclusions are summarized and an outlook to the coming years is given.
2 Scientific objectives
Within the earth system, the atmosphere has a central role: as an extremely efficient medium of transport it interconnects the other compartments of the earth system by cycling heat, water, and trace substances. At the same time – because of its comparatively low mass – it reacts rapidly to external forcing in particular to anthropogenic emissions.
It is well recognized that man has changed the composi-tion of the atmosphere and the properties at the land surface which has led to changes in temperature and radiative fluxes in the atmosphere. Anthropogenic activities have also influ-enced the processes in the upper atmosphere (e.g. an increase of stratospheric H2O concentrations as a consequence of the
tropospheric increase in CH4).
These global changes require global observation systems, i.e. satellite-based remote sensing experiments to measure spatial and temporal distributions of long and short-lived species, temperature, cloud parameters and radiance spec-tra. As stated before, MIPAS can deliver these quantities on a global scale, during day and night and over a wide altitude region.
2.1 Stratospheric chemistry and dynamics
Considerable progress has been made in understanding the stratospheric ozone depletion. In fact, the stratospheric ozone layer is expected to recover as a consequence of the Montreal Protocol, which demanded a reduction of ozone-depleting substances. However, considerable uncertainty about the rate of ozone recovery and future ozone levels ex-ists, mainly due to the coupling to the growing greenhouse effect (Weatherhead and Andersen, 2006). For instance up-to-date climate models do not take into account the spa-tial and temporal distribution of varying Polar Stratospheric Clouds when forecasting future ozone levels. Their inclu-sion will present a difficult task, since in polar winter the processes of stratospheric chemistry and dynamics are very complex. This was underlined in 2002, when the Antarctic
vortex split into two parts and caused extraordinary condi-tions in the stratosphere.
Changes in the physical structure of the non-polar strato-sphere are also taking place. Modelling studies indicate that this is partly due to the cooling of the stratosphere result-ing from ozone depletion and from increasresult-ing CO2. Such
changes in the basic structure of the stratosphere may well be accompanied by changes in the circulation of air within it. This in turn will change the lifetime of species in the strato-sphere.
2.2 Stratosphere-troposphere exchange
Interactions between troposphere and stratosphere are mani-fold. The chemical composition of the stratosphere is largely determined by input of air from the tropical troposphere. The breakdown of the polar vortex is driven by wave disturbances from tropospheric weather systems. Mid- and high latitude tropospheric ozone depends strongly on ozone transported down from the stratosphere. Upward and downward prop-agating radiation fluxes are modified by the change in at-mospheric composition. There is increasing evidence that stratospheric dynamics can influence tropospheric weather through the downward propagation of wave disturbances; such effects play a role in medium and long range weather forecasting.
Of particular interest are the upward transport in the Tropi-cal Transition Layer (TTL) and the exchange processes along the tropopause breaks. Accurate measurements of long-lived trace species will help to improve our understanding of these processes.
2.3 Chemistry and physics of the upper troposphere The concentration of water vapour in the upper troposphere is of great importance for the greenhouse effect due to its strong emission of radiation in the mid- and far infrared spectral region. Under high humidity conditions the water vapour emitted by aircraft causes cirrus clouds which influence the cloud cover and the radiation balance in regions of heavy air traffic. Also, the emissions of the current commercial fleet of subsonic aircraft make a significant contribution to the NOy
budget in the upper troposphere.
In addition elevated concentrations of various trace gases (e.g. HCHO, acetone, PAN) are often observed in the up-per troposphere indicating rapid upward transport of air from the lower troposphere and impact on ozone levels in the up-per troposphere. As a consequence, characteristic patterns of trace gases in the upper troposphere point to areas of biomass burning in Africa and South America.
2.4 Physics and chemistry of the upper atmosphere MIPAS has the potential to measure also many important at-mospheric parameters in the mesosphere and lower thermo-sphere (MLT), namely temperature, carbon dioxide, carbon
monoxide, ozone, water vapour, methane and nitric oxide. These observations contribute to improve our understanding of major research areas of the middle and upper atmosphere: the temperature structure and energy balance, the chemistry, the dynamics, and the interaction between them. In addi-tion, the quality of MIPAS data allows the study of the non-local thermodynamic equilibrium (Non-LTE) of the middle and upper atmosphere. This knowledge is crucial when the species are retrieved from their Non-LTE IR emission and hence helps in retrieving more accurate concentrations from wideband IR radiometers.
A very comprehensive review of the middle and upper at-mosphere has been compiled by Siskind et al. (2000). This monograph provides an insight into and an update of our cur-rent knowledge of this atmospheric region. The four major areas described there are energetics, chemistry, dynamics, and long term changes. In case of energetics, MIPAS mea-sures the most important emissions contributing to the IR ra-diative cooling of the upper atmosphere (CO2, NO). MIPAS
also measures the most significant chemical compounds of this region, including O3, H2O, CH4, CO, and CO2. O3is
very much affected by tides (Smith and Marsh, 2005) and hence might help in understanding the chemistry/dynamics interactions. Water vapour plays a major role in the up-per atmospheric chemistry. It has been found to increase in the middle atmosphere during 1992–1996 (Nedoluha et al., 2000). Therefore it is important to discern if this change continues or regresses. Water vapour has been scarcely mea-sured in the middle atmosphere, particularly in the cold sum-mer mesopause.
Carbon monoxide and carbon dioxide yield the total car-bon budget in the upper atmosphere. The distribution of these trace gases is significant for understanding the inter-play between molecular diffusion and vertical eddy diffusion in the upper mesosphere and lower thermosphere (L´opez-Puertas et al., 2001). Carbon monoxide will also provide important information on the dynamics of the mesosphere, e.g., the meridional circulation at solstice and the transi-tion from equinox to solstice conditransi-tions and vice versa (see, e.g. L´opez-Valverde et al., 1996). Another essential topic is the dynamics of the upper part of the polar vortex, such as the downward motion of air masses from the mesosphere into the stratosphere during the polar night, for which CO is an excellent tracer.
The middle atmosphere is also influenced by the solar electromagnetic radiation and particle flux. High solar ac-tivity is changing many trace gas concentrations in the atmo-sphere; it even causes a decrease in the ozone amount of the stratosphere.
2.5 Climatology and weather forecasting
Chemistry-climate interaction in the stratosphere is among other things due to the role that ozone has in determining the stratospheric temperature. In this context it is important
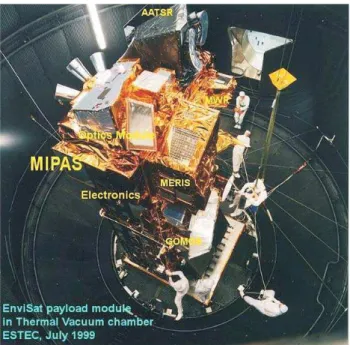
Fig. 1. The MIPAS instrument on top of ENVISAT surrounded by
other instruments (AATSR, MWR, MERIS); at the top the optics module with the two baffles is recognized, below the electronics module is fixed on the satellite structure (provided by ESA).
to study the year to year variation in the abundances of Cly,
HOy, and NOyas they may provide insights into the causes
of variations of ozone levels. MIPAS is able to provide ex-tensive observations of water vapour, both in the stratosphere and upper troposphere, which will be significant in further understanding of the cooling of the atmosphere. Another im-portant contribution that MIPAS could make to climatology is to provide observations of the global distribution of thin cirrus clouds and Polar Stratospheric Clouds (PSCs). The coverage and the optical properties of these clouds are not well known, resulting in an uncertainty in their contribution to the radiation budget.
The trends in the concentrations of trace constituents are small and over a period of five years will probably be too small to be unambiguously detected by a limb sounding ex-periment. For this purpose the same instrument would have to be flown several times sequentially. Another possibility is to combine the MIPAS data with other satellite or with long term ground-based measurements.
Today’s operational meteorological satellites deliver pro-files of temperature and water vapour with limited vertical resolution and accuracy in the tropopause region and above. Information on ozone is restricted to the vertical column amount.
It has already been shown that the higher vertical reso-lution of MIPAS temperature and ozone measurements in the upper troposphere/lower stratosphere has a positive influ-ence on the data assimilation of the weather forecast (Dethof,
2003). This means, ECMWF is interested to obtain near real time MIPAS data on a regular basis for its weather forecast. 2.6 Further scientific areas
In recent years the chemical weather forecast and the forecast of ozone fields have been developed. The operation of the numerical models requires data assimilation as in case of the weather forecast. Consequently, there is a great demand for data from global measurements of trace constituents in order to improve the initial conditions for the model runs.
3 The instrument
3.1 Instrument concept 3.1.1 General remarks
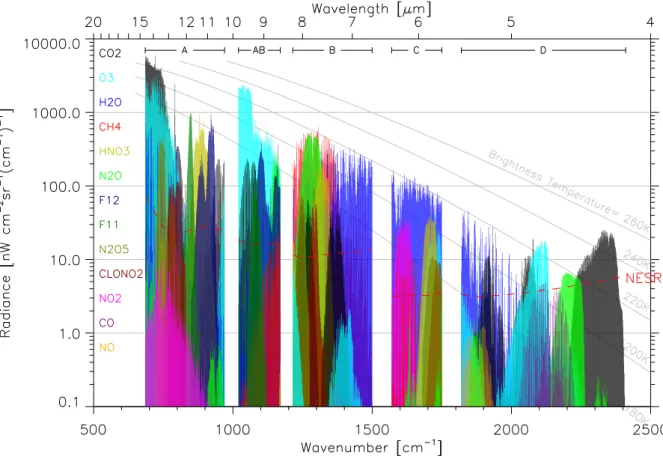
MIPAS is a Fourier transform infrared (FTIR) spectrometer aboard ENVISAT (Fischer et al., 2000, Fig. 1) for the de-tection of limb emission spectra in the middle and upper at-mosphere. It observes a wide spectral interval ranging from 4.15 µm to 14.6 µm with high spectral resolution. The mea-sured data set is very rich in information as each spectrum comprises of the order of 50 000 spectral elements (Fig. 2). The primary geophysical parameters of interest are vertical profiles of atmospheric pressure, temperature, and volume mixing ratios (vmrs) of at least 25 trace constituents.
The advantage of a FTIR instrument over spectrometers with dispersive elements like gratings or prisms lies in the fact that a single detection element can be used to record a broadband spectrum with high spectral resolution while for dispersive spectrometers either a scanning detector must be used, or a large array detector must be employed which sim-ply did not exist in the mid-infrared at the time of construct-ing MIPAS. Thus a FTIR was the only way to obtain com-plete high resolution IR-spectra with good sensitivity.
The drawback of a FTIR is its mechanical complexity, comprising moving optical elements which have to be guided with a very high precision over an extended distance, and very high alignment stability required for all optical compo-nents in the interferometer. In the case of MIPAS, the align-ment constraints become even more challenging as the optics is cooled down to 210 K by a large radiator in order to reduce the thermal radiation background of the instrument.
3.1.2 MIPAS functional design
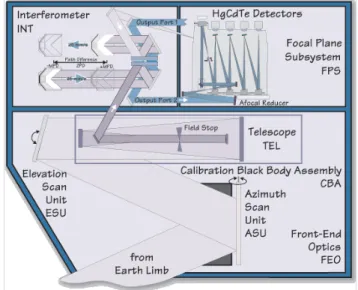
As schematically shown in Figs. 3 and 4, the atmospheric radiance enters the instrument through the Front End Op-tics where it is reflected at an azimuth and an elevation scan mirror. Afterwards the IR beam traverses an off-axis anamorphotic telescope which matches the beam size to the input aperture of the interferometer and enters a dual slide
Fig. 2. The total spectral region (4.15–14.6 µm) of MIPAS as measured at 18.7 km tangent altitude, is divided in 5 spectral intervals (A, AB,
B, C, D); the large number of spectral emission lines demonstrates the enormous amount of information in the measurements; a considerable number of trace constituents can be detected as indicated.
Fig. 3. MIPAS Signal Flow (provided by ESA).
Michelson-type Interferometer with two input and two out-put ports. The second inout-put port receives as little IR radiation as possible from the cold focal plane inner structure. Both in-put signals are divided at the beamsplitter inside the interfer-ometer and directed to two movable corner cubes from where they are reflected to the beam recombiner; the recombined intensity modulated signal constitutes the interferogram and appears at both output ports.
As the interferogram mathematically corresponds to the Fourier transform of the measured spectrum, a highly ac-curate sampling allows to derive on ground the originally measured spectrum of the modulated signal via an inverse Fourier transform. The sampling is provided by a reference laser with a sampling frequency of 7612 cm−1 and is also
used to achieve a constant speed of the cube corners. The output signal at each port enters the Focal Plane Sub-system which is actively cooled by a pair of low vibration Stirling-cycle coolers to 70 K for maximum sensitivity of the detectors. Inside this subsystem each input signal is sep-arated into four spectral channels by optical filtering and analysed by dedicated MCT (Mercury Cadmium Telluride) detectors.
After pre-amplification, the eight signals enter the ana-logue part of the Signal Processing Electronics (SPE) where the DC-signals are suppressed by coupling. The AC-signals are amplified, lowpass filtered to avoid aliasing and
Fig. 4. MIPAS Optical Layout (provided by ESA).
then A/D converted with 16 bit resolution.
The digital part of the SPE separates in each band the spec-tral range of interest by complex filtering. In a further pro-cessing step measurement data are multiplexed and format-ted to source packets which include auxiliary data for ground processing purposes.
A redundant Instrument Control Unit provides the teleme-try/telecommand interface to the platform and monitors au-tonomously the instrument status.
In the ground segment, the down-linked interferograms are converted into calibrated atmospheric spectra which are fur-ther used to retrieve the concentration profiles of the relevant atmospheric species and other higher level products. 3.1.3 Functional description of the optics module
The MIPAS optics module is installed at the anti-sunward side of ENVISAT and has the following major parts: Front End Optics, Interferometer and Focal Plane Subsystem.
Front End Optics
The Front End Optics consists of Azimuth Scan Unit, Ele-vation Scan Unit, telescope, and calibration blackbody. The individual items are briefly described in the following:
The Azimuth Scan Unit (ASU) allows the selection of the line of sight within the two field-of-view regions, and also enables the detectors to view an internal calibration black-body source for gain calibration. A flat steering mirror is ro-tated about an axis parallel to nadir to direct the light into the instrument. This steering mirror has a dimension of about 295 mm in height and 109 mm in width and thus forms the largest optical component of MIPAS.
A second function of the ASU is the protection of the in-terior of the optics module from contamination; a shield is mounted behind the steering mirror and rotates with it. When the mirror is turned to an end stop, the shield closes the input aperture to the ASU and thus the ASU mirror is protected from contamination during ground handling and in the early flight phase.
The Elevation Scan Unit (ESU) determines the actual limb height of a particular measurement, and thus requires a very high pointing accuracy over a limited angular range. It com-prises a flat steering mirror rotating around an axis that is orthogonal to nadir and flight direction. The angle covered by this mirror is less than 3◦which is sufficient to reach tan-gent heights between 5 km and 250 km; the high value is used for measurements of cold space to determine the instrument self-emission for offset calibration.
After being reflected by the Elevation Scan Unit the beam enters the anamorphotic telescope which reduces its dimen-sions to 25 mm by 50 mm. This telescope also houses the field stop that determines the field-of-view of the instrument. The position of the field stop in front of the interferometer ensures that all detectors view the same air volume.
Mounted in the azimuth scan unit is the calibration black-body (CBB), used for the flight calibration of the in-strument responsivity. To fill the IFOV (Instantaneous Field-of-View), it needs a rather large clear aperture (about 165×55 mm2). Its design is derived from the blackbody de-sign for the along-track scanning radiometer (ATSR), fly-ing on the ERS-1 and -2 satellites. Its emissivity is above 99.6%, so that a high accuracy for the gain calibration be-comes achievable. For precision gain calibration measure-ments, it can be heated to about 40 K above the ambient in-strument temperature to increase its radiance emission. Its nominal temperature then reaches up to 250 K.
Interferometer
A symmetrical dual slide interferometer with dual input and dual output ports has been selected in order to meet the radio-metric and spectroradio-metric performance requirements, as well as the lifetime requirement of five years of continuous oper-ation in space. This kind of interferometer provides highest
detectable signal at the outputs, the least uncertainties in de-sign, the highest degree of redundancy, and the most com-pact dimensions. It has a folded path to allow for a more compact arrangement of the interferometer and to allow for a better compensation of the momentum generated by the cor-ner cubes during the reversal of their motion. The incident angle of the radiation onto the beamsplitter is 30◦to reduce polarization effects by the beamsplitter. The MIPAS interfer-ometer is 0.58 m long and about 0.36 m wide, and has a mass of about 30 kg. It has the following major subassemblies: in-terferometer optics, drive units, and optical path difference sensor.
The interferometer optics comprises the beamsplitter as-sembly, flat steering mirrors, and the corner cubes on the slides. The beamsplitter coatings themselves are quite crit-ical, as they have to provide a reflectivity near 50% through-out the broad spectral range. More difficult to manufacture are the broadband antireflection coatings on the other sur-faces that are essential to reduce undesired interferometer ef-fects that would modulate the transmission of the substrate and could result in ghost spectra. The beamsplitter assem-bly also has to compensate for the phase delays caused by the varying refractive index throughout the spectral range. This is done with a second substrate of the same thickness as the beamsplitter itself and mounted with a narrow gap to the beamsplitter coatings. Both substrates are slightly wedged to reduce the residual etalon effects.
The two identical Interferometer Drive Units perform the actual translation of the corner cubes. Linear motors behind the corner cubes generate the drive force. The slides are guided by mechanical bearings. Lifetime tests of the bear-ings have shown that dry-lubricated ballbearbear-ings operating with a light preload can well achieve 20 million motion cy-cles (in the meantime the interferometer has performed con-siderably more motion cycles). The difference velocity be-tween the two slides has to be controlled with less than 1% rms error. A drive control loop processes the inputs from lin-ear optical encoders in each of the drive arms for a coarse control and for centering of the slides, and from a built-in laser interferometer (called the optical-path difference sen-sor ODS) for fine velocity control. The laser interferometer is also required to trigger the sampling of the detector output at very precise intervals of optical path values.
The built-in laser interferometer makes use of a single-mode 1.3 micron diode laser which is located in the optics module near the Stirling coolers. The output of the diode laser is guided by a single mode polarizing optical fibre to the interferometer. Although the individual components had been proven in many communication systems, their use in a spaceborne instrument with operation over a wide tempera-ture range is new and required space qualification.
Focal plane subsystem
The two output beams of the interferometer are reduced in size by two small off-axis Newtonian telescopes, and di-rected into the cold focal plane subsystem, which houses the signal detectors with their interfaces to the active coolers, as well as the associated optics required for spectral sepa-ration and beam shaping. It is smaller than the interferom-eter (0.36 m wide, 0.45 m high) and has a mass of 16 kg. The focal plane subsystem has the following elements: de-tector/preamplifier unit and focal-plane cooler assembly.
To achieve the best radiometric sensitivity, a set of four de-tectors in each output port is used, each optimized for highest sensitivity in a spectral band. A set of dichroic beamsplitters and steering mirrors separates the input from the two inter-ferometer ports to the different spectral bands, and the optics required to illuminate each detector element. All optical ele-ments are mounted and aligned in a very tight package. All optics and the detectors are cooled to about 70 K to reduce their thermal emission and internal noise contribution. Cool-ing is performed by a pair of active StirlCool-ing cycle coolers. Thus, although the focal plane subsystem is conceptually a simple design, the numerous interfaces between the optics, the detectors, and the coolers under the constraints of good thermal insulation and high alignment stability of the optical components result in very demanding requirements.
An analysis for the optimization of the detectors has shown that four spectral bands (A, B, C, D) in each interferome-ter output port are required to achieve the low instrument noise contribution and to provide some redundancy at the long wavelength region for temperature measurements. Thus a total of eight detector elements are needed in MIPAS. In the long wave spectral region (14.6 to about 7 µm), only photoconductive HgCdTe detectors (PC-MCT) were able to meet the specifications on low noise contribution and elec-tronics bandwidth when the instrument was built. At the shorter wavelengths (7 to 4 µm), photovoltaic HgCdTe de-tectors (PV-MCT) are the best choice. The preamplifiers are individually optimized for each detector to fulfill strin-gent requirements on noise, phase distortions and linearity. The cold part of the preamplifiers is mounted in the detec-tor housing, while final amplification is performed in an ex-ternally mounted package at ambient temperature. Stirling cycle coolers with a performance that satisfies the cooling requirements of MIPAS (500 mW heat lift at 70 K tempera-ture) are used in a twin-cooler arrangement, comprising two identical compressor and displacer units that operate syn-chronously to compensate most vibrations from the oscillat-ing parts.
3.1.4 Further Subsystems
Further subsystems are the Signal Processing Electronics and the Instrument Control Unit.
The Signal Processing Electronics (SPE) takes the ana-logue signal inputs from the detector preamplifier unit and generates the associated digital bit streams, which are then transformed into formatted data packets and sent to the plat-form bus for transmission to ground. These data are accom-panied by the requisite auxiliary data from the SPE & ICE (Instrument Control Electronics) needed to interpret and pro-cess the instrument measurements. In order to satisfy the downlink bandwidth allocated to the instrument, the SPE must perform certain digital operations upon the bit streams. The SPE processing can basically be divided into the ana-logue signal processing (ASP), the digital signal processing (DSP), and the output processing (OP). In the analogue sig-nal processing the sigsig-nals are, after input amplification, low pass filtered to eliminate aliasing in the sampling process and then A/D converted. Nominal sampling frequency at the SPE is approximately 77 kHz in each channel, with the spectrum of interest lying in the range 6.85 to 24.1 kHz. For the LOS calibration mode, data are received only on the shorter wave-length (D1 and D2 for the two output ports) channels and are sampled at around 100 Hz using an SPE-generated clock signal.
The digital signal processing of the SPE isolates the five nominal bands (generated by a combination of the 2 times 4 filter ranges, see Kleinert et al., 2007) through a digital filtering operation and performs a channel addition to im-prove SNR. The SPE performs additional digital operations to reduce the output data rate to the required level. Follow-ing digitisation, the SPE records the maximum and minimum digital value recorded on each channel of each interferogram. Each channel is then digitally filtered to isolate the band of interest and the data size is reduced by a sub-sampling op-eration. The final operation in this chain is the truncation of the data words to be sent to the Data Handling Assembly of the ENVISAT satellite. In a typical interferogram, only the very central portion (around 1%) contains significant values and the data outside require considerably less bits for accu-rate representation. The most significant bits which are set to zero can therefore be discarded without loss of information.
The Output Processor generates source packets in each of five bands and then multiplexes the source packets into the output stream to the Data Handling Assembly.
The controlling functions of the MIPAS instrument are performed by the Instrument Control Unit, which runs the MIPAS specific application software. The functions of the Instrument Control Unit comprise among others the control of the MIPAS operation and its operational modes, record-ing of instrument events, commandrecord-ing and monitorrecord-ing of MIPAS equipments, monitoring and processing of MIPAS house keeping data, and initiation of corrective actions in case of instrument failures.
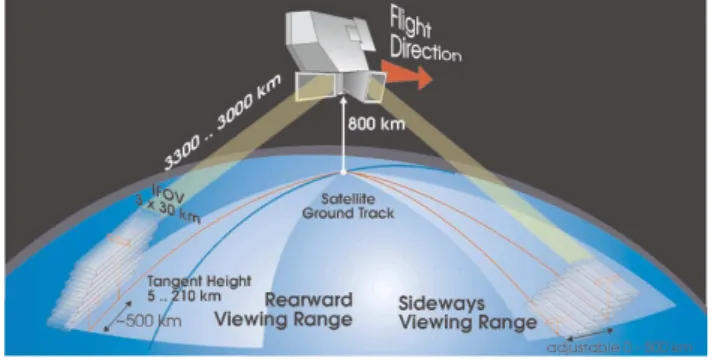
Fig. 5. MIPAS Observation Geometry (provided by ESA).
3.2 Observing capability
MIPAS observes the emitted radiance from the atmosphere at the limb, i.e. the line of sight penetrates the atmosphere down to a minimum altitude, named the tangent altitude, and then, because of the Earth’s curvature emerges again towards space. This type of observation is selective to the atmo-spheric signal emitted from the tangent altitude layer and, when a limb sequence with a discrete set of different tan-gent altitudes is acquired, allows the determination of the vertical profiles of atmospheric parameters. In broad terms MIPAS can observe atmospheric parameters in the altitude range from 5 to 160 km with minimum and maximum steps of 1 and 8 km, respectively.
To provide access to any air volume in the atmosphere the MIPAS pointing system uses two mirrors. The elevation mir-ror selects the limb altitude and corrects for platform attitude, orbital altitude and Earth’s geoid geometry. The azimuth mir-ror determines the location of the observed air volume rela-tive to the platform position. The azimuth mirror provides ac-cess to limb targets rearwards within a 35◦wide range around the anti-flight direction and sideways within a 30◦wide range on the anti-Sun side of the satellite (Fig. 5).
For operational measurements MIPAS performs observa-tions in the rearward viewing direction. In this case the sam-pling strategy is to keep the azimuth mirror fixed during each limb scanning sequence. The limb sequence is performed by changing the orientation of the elevation mirror with discrete steps in tangent altitude. At each nominal position of the elevation mirror an interferometer sweep is acquired while the elevation mirror is actively controlled in order to main-tain a constant tangent altitude. As the tangent altitude is de-creasing its location moves away from the platform. For this reason the limb sequence is performed scanning down from high altitudes to low altitudes, so that the geometrical effect partially compensates for the movement of the platform and an almost vertical sequence of tangent altitude points is ob-tained. By changing the azimuth angle with respect to the rearward direction it is possible to move the tangent alti-tude location away from the satellite ground track. Since the ground track is limited to the latitude region between about
80◦S and 80◦N (due to the inclination of the orbit) the
az-imuth angle is occasionally changed during the orbit in order to perform observations from pole to pole.
For cross track observations, simultaneous changes of az-imuth and elevation angle between subsequent sweeps can be considered in order to compensate for the platform move-ment.
The time required to record one full resolution spectrum is about 4.5 s. A nominal limb scanning sequence consists of 17 spectra, measured at tangent altitudes from 6 to 68 km with a spacing of 3 km at low altitudes and larger spacing above, and is acquired in a total time of about 76 s. During each orbit about 72 limb sequences are acquired as well as calibration measurements. Each day about 14 orbits are obtained for a total of about 1000 limb sequences or profiles per day.
Important features of the MIPAS observation strategy are: – emission measurements with continuous observations independently of the presence of external radiation sources and of the day/night conditions,
– limb sounding technique with good resolution of the vertical distribution of the atmospheric parameters, – polar orbit with azimuth correction for global (pole to
pole) mapping,
– broadband FTS measurements with simultaneous obser-vation of an almost complete survey of the atmospheric constituents.
The combination of these features makes it possible to obtain a comprehensive picture of the atmospheric chemistry with daily three-dimensional (altitude-latitude-longitude) global maps of the concentration of a considerable number of con-stituents for the full duration of the instrument mission. The flexible altitude steps of the elevation mirror allow the ver-tical sampling of the parameter profiles to be increased in atmospheric regions where the gradient in concentration is changing rapidly (e.g. tropopause, denitrificated layers in the stratosphere). No other satellite instrument has ever com-bined all these features for the investigation of middle atmo-sphere phenomena (see Sect. 8).
3.3 Calibration and characterization
A detailed description of the calibration and characterization of the instrument is given by Kleinert et al. (2007). There-fore, only the most important processing steps and results are summarized here.
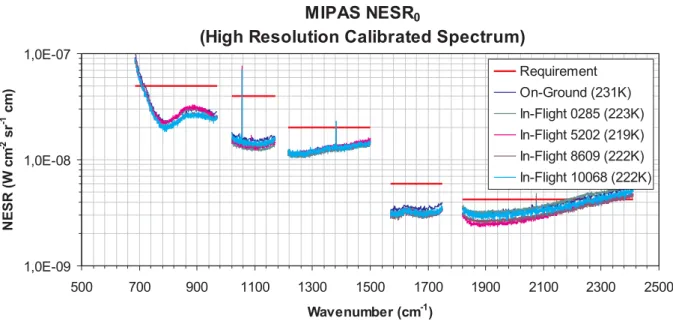
3.3.1 NESR
The NESR (noise equivalent spectral radiance) quantifies the noise level of the data. It ranges from 3 nW/(cm2sr cm−1)to 50 nW/(cm2sr cm−1), depending on the spectral range and channel. The two times four detectors comprise the spectral
MIPAS NESR
0(High Resolution Calibrated Spectrum)
1,0E-09 1,0E-08 1,0E-07 500 700 900 1100 1300 1500 1700 1900 2100 2300 2500 Wavenumber (cm-1) N ESR (W c m -2 sr -1 cm) Requirement On-Ground (231K) In-Flight 0285 (223K) In-Flight 5202 (219K) In-Flight 8609 (222K) In-Flight 10068 (222K)
Fig. 6. NESR0of MIPAS on ground and in flight. The index 0 denotes the absence of radiation from the scene.
range from 685 to 2410 cm−1which is split into five bands A,
AB, B, C, and D, each band being covered by one or two spe-cific detectors (details see Kleinert et al., 2007). The NESR is well within the requirements (Fig. 6), and no systematic evo-lution of the NESR over time could be observed. The most important effect on the NESR is ice accumulation on the de-tector system, which may temporarily degrade the NESR by up to 20% (value depends on the frequency of decontamina-tion) with respect to an ice free detector.
3.3.2 Radiometric calibration
In order to assign absolute radiance units to the measured spectra, gain and offset measurements are performed regu-larly. The instrument offset is determined by looking into deep space, and measurements of a blackbody with known temperature are performed to determine the gain function. In principle, the gain function G is calculated as:
G = LBB
SBB−SDS
(1) where SBB and SDSare the measured blackbody and
deep-space spectra, respectively, and LBB is the spectral radiance
of the blackbody. The atmospheric spectra are then cali-brated using:
Latm=G (Satm−SDS) (2)
with Satmand Latmbeing the measured and calibrated
spec-trum, respectively.
3.3.3 Gain and offset stability
The gain function is much more stable than the instrument offset. Therefore, it is usually sufficient to generate a gain
calibration function once per week while the offset is mea-sured several times per orbit (about every 7 min). The radio-metric gain stability is typically better than 1.5% per week, and the offset change between two consecutive measure-ments is below 10% of the NESR. One reason for gain drift is the formation of ice on the cooled detector optical com-ponents which especially affects regions with strong infrared absorption bands of ice.
3.3.4 Detector non-linearity
The photoconductive detectors from the long wavelength channels A, AB, and B are subject to non-linearity depending on the total incident photon flux. This non-linearity needs to be corrected before the radiometric calibration Formulas (1) and (2) are applied. The non-linearity is corrected by scaling each interferogram with an appropriate factor which is calcu-lated from the non-linearity parameters and the peak-to-peak value of the interferogram, which is a measure for the total photon flux. The non-linear behaviour of the detectors has been characterized and parameterized on-ground and cross-checked in-flight using commissioning phase data. Based on the intercomparison of the on-ground and in-flight data, the accuracy in the calibrated scene spectra with respect to the non-linearity correction is estimated to be within a few per-cent, depending on the line intensities and the total photon flux. The error depends on instrument temperature, ice layer thickness on the detector optics, detector temperature, and detector aging.
3.3.5 Spectral calibration
Spectral calibration is performed using known features of standard limb measurements. Appropriate spectral lines with well known peak positions are used in each spectral band to determine a spectral shift in the measured spectrum. For the shift determination, four spectra of a tangent altitude of 32 km are co-added. The wavenumber dependence of the spectral shift is in first approximation assumed to be linear but a second order effect is also considered in the level 2 analysis (see Raspollini et al., 2006, this special issue). The spectral shift is assumed to be the same for all types of mea-surements and is applied until a new calibration is performed. To ensure a stability and an accuracy better than 0.001 cm−1, the spectral calibration (shift determination) is performed ev-ery four limb sequences, i.e. evev-ery 320 s. The spectral shift has not changed significantly during the mission; its variation from July 2002 to March 2004 is in the order of 6 ppm. 3.3.6 Instrumental Line Shape
The instrumental line shape (ILS) is the area-normalized spectral response function of the spectrometer. When a monochromatic spectral line at position σ0 is irradiated,
the ordinate value of the area-normalized response at σ is ILS(σ −σ0, σ0). Due to the normalization, the specification
of an ILS is not affected by the calibration of the radiance axis. In contrast, there is an intimate connection with spectral shift, however, the spectral shift may be treated separately (see Sect. 3.3.5).
The ILS of MIPAS is specified by means of a set of ILS variables. Because a physical model of the interferometer is available for MIPAS, the subset of model variables which af-fect the ILS can be adjusted to approximate the ILS of the real instrument. The suggested parameterization has been used in various studies. It is found that the loss in peak re-sponse of the unapodized ILS due to misalignment amounts 2% at 800 cm−1, 5% at 1200 cm−1, 8% at 1600 cm−1, and
11% at 2000 cm−1 when the instrument is operated in full
nominal resolution.
3.3.7 Field-Of-View characterization
Analyses of the instrument’s field-of-view (FOV) response and the co-alignment of the various detector channels were performed both prior to launch and post launch. The pre-launch characterization of the FOV width, based on opti-cal measurements, yielded a value of 52 mdeg (FWHM) in the elevation direction. Verification measurements were conducted at IR wavelengths for individual detector chan-nels, with the instrument collimated input beam viewing a hot blackbody source equipped with a small circular aper-ture. Additional verification measurements were conducted in flight. These were based on the active scanning of the in-strument’s line of sight across an infrared bright, “point like”
source while raw mode interferograms were acquired in all eight detector channels.
Results of both types of verification measurements were found to be consistent with the optical characterization data, taking into account inaccuracies inherent to the experimen-tal set-up in each case. From in-flight measurement the co-alignment of the FOV patterns was verified to be better than 1.3 mdeg in elevation for all detector channels.
4 Retrieval methods for MIPAS
4.1 The operational code for MIPAS data processing While the level 1 analysis (see Sect. 3) determines the geolo-cated and calibrated spectra from the raw instrument data, the level 2 analysis performs the retrieval of the geophysical pa-rameters of interest from level 1b spectra. In the operational level 2 analysis the pressure at tangent altitudes (denoted as tangent pressure) and the vertical profiles of temperature and six species selected to have highest priority, namely O3, H2O,
CH4, HNO3, N2O, and NO2, are retrieved. These profiles are
the targets of the operational analysis and are retrieved as a function of tangent pressure. Other minor atmospheric con-stituents are retrieved with non-operational scientific codes (see Sect. 4.2).
All retrievals are based on the non-linear least-squares fit (Menke, 1984; Sivia, 1998; Rodgers, 2000) of a parametrized forward model to the measured spectra. A theoretical forward model calculation F (p, x) is fitted to the observations y. F (p, x) simulates the observations starting from the quantities x to be retrieved and from a set of instru-mental and geophysical parameters p, that are assumed to be known. The solution is found with an iterative procedure that uses the Gauss-Newton method for the minimisation of a cost function. Usually, the cost function is the χ2function, equal to:
χ2=nTiterV−n1niter, (3)
where niter=y−F(p, xiter)is the vector of the residuals at
iteration iter, with xiter equal to either the initial guess or
the result of the current iteration, and Vnis the Covariance
Matrix of the observations.
An important feature of the MIPAS data inversion problem is that the limb sounding technique provides a selective in-formation on the atmospheric composition at the tangent alti-tudes which, combined with the redundant information of the spectrally resolved measurements, leads to an usually well conditioned inversion problem even if made rather elaborate by the large number of available observations. The different retrieval codes differ in the adopted degree of sophistication and optimization of the forward model calculation, for the choice of the cost function and in the selection of the fitted observations.
The operational MIPAS level 2 data processor was con-ceived by an international consortium which developed the scientific prototype, named Optimized Retrieval Model (ORM, Ridolfi et al., 2000), used for the operational imple-mentation. The main challenge of the ORM has been the requirement of performing the complex operation of mathe-matical inversion in near real time (NRT) for a large number of data. The ORM code is also the prototype of the Off-Line (OL) level 2 processor that is used for the re-analysis of the measurements with improved geolocation and set up of the level 1 and level 2 chain. In the off-line analysis the NRT requirement does not apply any longer, but the contin-uous emission measurements of MIPAS still require that the computing time is significantly shorter than the measurement time.
The main features of the level 2 operational code and the possible differences with other scientific codes are briefly re-called. For a more detailed description of the ORM and of its performances we refer to Raspollini et al. (2006).
The ORM performs a non-linear least squares fit with a cost function modified according to the Levenberg-Marquardt (Levenberg, 1944) method.
The choice of the fitted observations is a compro-mise between the maximum information and the minimum complexity of the retrieval from the point of view of number of unknowns and observations. For this purpose, on one hand the global fit approach (Carlotti, 1988) is adopted, with the simultaneous fit of the spectra of the full limb sequence for the retrieval of each vertical profile. The global fit provides a full exploitation of the measurements and a rigorous deter-mination of the correlation between atmospheric parameters at the different altitudes. On the other hand, apart from pres-sure and temperature that are simultaneously determined, the different target species are individually retrieved with a se-quence that follows an order determined by the degree of spectral interference. Furthermore, the retrieval is performed using a set of narrow (less than 3 cm−1width) spectral
vals, called “microwindows” that are selected as those inter-vals that contain the best information on the target parameters and are less affected by systematic errors.
The forward model calculations are also the result of a compromise between accuracy and computing time. The ra-diative transfer model calculates the atmospheric emission spectrum taking properly into account the effect of refrac-tive index in the optical path, the Voigt profile of the atmo-spheric line shape, and using a high resolution wavenum-ber grid for the calculation of the monochromatic spectral radiances. The forward model determines the observed spec-trum by convolving the monochromatic and single-beam at-mospheric spectrum with the line shape and instantaneous field-of-view of the instrument. On the other hand, Non-LTE effects, line mixing, and pressure shifts are not considered in the forward model, but are accounted for in the microwin-dows selection and in the error budget. The atmosphere is
assumed horizontally homogeneous and in hydrostatic equi-librium.
Several mathematical and computing optimizations have been introduced in order to reduce the computing time with either null or negligible effect on the accuracy of the calcula-tions (Raspollini et al., 2006).
The operational processor requires a pre-retrieval cloud detection scheme which filters the level 1b spectral data, as do all current MIPAS retrieval codes for trace gases. This is required because strong cloud effects in the spectra result in anomalous mixing ratios and instabilities of the retrieval solutions even for concentrations derived from lines-of-sight above the cloud-contaminated views. Both clouds in the tro-posphere and polar stratospheric clouds can produce these effects. The operational processor uses a cloud detection scheme based on the ratio of integrated signals in cloud mi-crowindow pairs (Spang et al., 2004) with one pair defined in each of 3 MIPAS bands (A, B, and D). The tests oper-ate hierarchically so that the cloud index in band A (CI-A) is tested first, and then the other bands if required because of an unavailability of band A. Hence CI-A is normally the cloud index used and the threshold for cloud detection is currently set such that CI-A <1.8 between 6 km and 45 km in the oper-ational processor flags a spectrum as cloudy (further details can be found in Spang et al., 2004).
One of the main effects of cloud presence, particularly in the tropical upper troposphere, is to limit the cloud-free line-of-sight frequency. Greenhough et al. (2005) show that this obscuration of the MIPAS views can result in less than 20% cloud-free observations at 12 km in the inter-tropical conver-gence zone (ITCZ) which is observed to drift north and south according to season. However, outside the narrow band of latitudes of the ITCZ, the cloud-free line-of-sight frequencies at 12 km increase towards 40% in the tropics and greater than 60% in mid-latitudes. Retrieval of trace gas concentrations at upper tropospheric altitudes requires careful validation and joint retrieval with aerosol extinction (e.g. Moore, 2006) or continuum parameters (e.g. von Clarmann et al., 2003a). Work on many species is on-going but essentially consid-erable success is being achieved at these low altitudes (see Sect. 8). Aside from the cloud influences, water vapour, the cold temperatures at the tropical tropopause and line-of-sight gradients are most responsible for increased uncertainties. The last of these has led to research into two-dimensional retrieval codes as described below.
4.2 Scientific codes for data processing
Besides the operational MIPAS level-2 data processor oper-ated under ESA responsibility, there exist several further data processors which are used to produce scientific level-2 data beyond the routine near real time data generation. Most of these processors involve modelling of aspects of radiative transfer not included in the ORM or use a retrieval strat-egy of higher sophistication. This usually implies a higher
computational burden and/or expert knowledge of the user, which explains why not all of these codes are suitable for operational level-2 data generation.
Without being exhaustive, we shortly introduce the most widely used MIPAS level-2 data analysis codes. In the pre-launch phase of ENVISAT six codes were developed and cross-validated within the “Advances MIPAS Level-2 Data Analysis” (AMIL2DA) project (von Clarmann et al., 2003c). These are the extended scientific versions of the OFM/ORM by IFAC, the Retrieval Control Program (RCP) by IMK/IAA, two distinct data processors by DLR, the RET2D code by the Rutherford Appleton Laboratory, and the Oxford University Processor to Invert MIPAS Measurements (OPTIMO), which meanwhile has been replaced by the MORSE software (Dudhia et al., 2005). Further MIPAS data processors are the one coded and applied by Forschungszen-trum J¨ulich (Hoffmann et al., 2005), the OPERA code of the University of Leicester (Moore et al., 2006), and the GMTR code by Bologna University (Carlotti et al., 2006).
As for the operational ESA retrieval code, also the sci-entific data processors require the forward modelling of at-mospheric radiative transfer. This can be done either by ex-plicit line-by-line radiative transfer models (KOPRA (Stiller, 2000) in the case of RCP, RFM (Dudhia, 2002b) in the case of OPTIMO, MORSE, and OPERA), by the use of precal-culated absorption cross-sections (ORM-based codes) or by computationally efficient but less accurate parametric radia-tive transfer codes as in the FZJ retrieval algorithm. The more advanced radiative transfer line-by-line models sup-port modelling of radiative transfer physics which is, for rea-sons of computational efficiency, not included in the ORM, e.g. non-local thermodynamic equilibrium or scattering of ra-diation by clouds.
In the infrared region scattering is usually neglected in the radiative transfer, that means an aerosol free atmosphere is assumed and cloud filtering is applied (see above). H¨opfner et al. (2006a, b) have shown that intermediate cases of great scientific interest can also be considered. Since radiation from the lower atmosphere and the surface attenuated by the absorption of the atmosphere below the line of sight, is scat-tered e.g. by thin clouds (e.g. cirrus or PSCc) into the line of sight of MIPAS, the KOPRA radiative transfer algorithm has been complemented by a single scattering module (H¨opfner et al., 2005).
Besides differences in radiative transfer modelling, there are also important differences between the processors with respect to the inversion strategy. While the ORM retrieves atmospheric temperatures and mixing ratios of constituents on an altitude grid defined by the tangent altitudes of the ac-tual limb scan (Ridolfi et al., 2000), other algorithms use a fixed altitude grid, which in case of the RCP is much finer than the MIPAS tangent altitude spacing (1 km vs. 3 km) (von Clarmann, 2003b). Most of the processors either rely on the engineering information on the MIPAS elevation point-ing (e.g. RET2D) or correct pointpoint-ing-related errors by
ad-justing the pressure profile to the actual limb measurement. The RCP supports direct retrieval of the elevation pointing in terms of tangent altitudes while it adjusts pressure assum-ing the hydrostatical equilibrium, and is thus well suited for monitoring of elevation pointing peculiarities (von Clarmann et al., 2003b, Kiefer et al., 2007, this Special Issue).
While the majority of retrieval algorithms use microwin-dows for the retrieval, for species with excessively low sig-nal like HOCl, however, it happens that the use of extended spectral windows is necessary, whose width often is beyond of what is usually called microwindow (von Clarmann et al., 2006a). Other data analysis strategies rely on broadband data rather than microwindows (RET2D, FZJ-code, OPERA).
All retrieval codes except the ORM-derivates and GMTR constrain the retrieval of atmospheric state variables by ap-plication of a dedicated regularization term. This helps to avoid instabilities in the retrieval, but adds a certain content of a priori information to the retrieved profiles. OPTIMO, OPERA, and the FZJ-code use optimal estimation (Rodgers, 1976, 2000), MORSE uses a sequential estimation applica-tion of optimal estimaapplica-tion, the DLR-codes use different vari-ants of a Tikhonov-type (Tikhonov 1963a, b) constraint, and RCP supports any user-defined regularization matrix but is usually operated with a Tikhonov-type first order finite dif-ferences regularization matrix (Steck et al., 2001).
Forward-modelling related issues of Non-LTE seem to be sufficiently well understood not to be the driving error source in calculated spectra, if the vibrational temperatures are accu-rately known. Since, however, the vibrational temperatures of the actual atmosphere are typically unknown, Non-LTE is not only a forward modelling issue but also poses retrieval-related problems (von Clarmann et al., 2003b). At least, the vibrational temperatures should be modelled for the actual atmosphere. In case of CO, whose vibrational temperatures depend on the CO infrared emissions at other altitudes, this requires the inclusion of a Non-LTE model which provides the vibrational temperatures within each step of iteration, as supported by the RCP-processing environment (Funke et al., 2006). This approach, however, relies on a perfect Non-LTE model. Since high-resolution spectra as provided by MIPAS in its original observation mode include a lot of informa-tion on Non-LTE processes themselves, uncertain Non-LTE model parameters like NO2excitation rates, O3nascent
dis-tributions, or CO2collisional constants can also be retrieved
directly from the measurements using the RCP processing, as shown by Funke et al. (2005a), Kaufmann et al. (2006), and L´opez-Puertas et al. (2005c). With no Non-LTE model available, the only possible approach except the use of cli-matological vibrational temperature data (L´opez-Puertas et al., 2006) is the direct retrieval of vibrational temperatures from the spectra. This, however, involves an inversion with many unknowns which tends to be ill-posed and thus needs regularization. Any physically meaningful regularization of vibrational temperatures, however, can be set up best on the basis of a Non-LTE model.
With these scientific retrieval processors available, it is possible (a) to extend the MIPAS data product towards lower altitudes, where clouds affect radiative transfer and where re-duced measurement information in nearly saturated spectra requires regularization of the retrieval; (b) towards higher al-titudes where the correct treatment of Non-LTE is important; (c) to investigate regions of the atmosphere where large hor-izontal gradients make the horhor-izontal homogeneity assump-tion fail, and (d) to derive many more trace species charac-terized by excessively low signal/noise ratio which requires more sophisticated retrieval strategies than used for the oper-ational data products.
4.3 Two-dimensional and multi-target retrievals
In recent years, significant efforts have also been made for the development of two-dimensional (2-D) retrieval codes that avoid the assumption of horizontal homogeneity of the atmosphere. Indeed, conventional retrieval schemes apply a one-dimensional approximation of the atmosphere, i.e., for each limb scan the retrieved physical state variable is a func-tion of altitude only, while horizontal variafunc-tions are neglected (see, e.g. McKee, 1969, Carlotti, 1988). In order to allow the retrieval of two-dimensional fields of atmospheric state variables in the orbit plane, dedicated algorithms have been developed.
MIPAS observations taken along the orbit track can be an-alyzed in two dimensions by exploiting the fact that the limb sequences are continuously repeated along the plane of the orbit. This repetition allows to gather the information about a given location of the atmosphere from all the lines of sight that cross that location whatever sequence they belong to. Since the loop of overlap between nearby sequences closes when the starting sequence is reached again at the end of the orbit, in a retrieval analysis the full gathering of information can be obtained by merging in a simultaneous fit the obser-vations of a complete orbit; this analysis strategy is named Geo-fit (Carlotti, 2001). An important feature of the Geo-fit approach is that the retrieval grid is independent of the mea-surement grid so that atmospheric profiles can be retrieved with horizontal separations different from those of the mea-sured limb scans. This feature often makes it possible to im-prove the usually poor horizontal resolution of limb measure-ments (Ridolfi et al., 2004).
MORSE, RET2D and the 2D-option of the RCP (Steck et al., 2005) use sequential estimation, where the a priori infor-mation on the 2-D field is updated with each limb scan newly included in the analysis. As a computationally more efficient substitute for full 2-D retrievals, the RCP also supports the retrieval of horizontal gradients along with the related atmo-spheric state variables.
In the ESA operational data-analysis process, the prelim-inary retrieval of pressure and temperature is followed by the sequential retrieval of the target vmrs. A drawback of this approach is that the retrieval errors affecting pressure
and temperature profiles do propagate into the retrieved vmr values. Moreover, molecular species with a “rich” spectrum (such as water and ozone) may also propagate their measure-ment error in the other products because their spectral fea-tures often contaminate the wavenumber intervals analyzed for the retrieval of other species. This error propagation pro-cess is minimized with a careful choice of both the analyzed spectral intervals (Dudhia et al., 2002a) and the sequence of the retrievals. Nevertheless, in many cases, the error prop-agation cannot be completely avoided and its assessment is rather difficult. A strategy that eliminates this source of sys-tematic errors is represented by the simultaneous retrieval of all the quantities whose correlation in the observed spectra is the cause of the error propagation. With this strategy (re-ferred to as Multi-Target Retrieval; MTR) the error due to the cross-talk between different target quantities is properly rep-resented in the covariance matrix of the retrieved parameters (Dinelli et al., 2003). Furthermore, the selection of the ob-servations to be analyzed is no longer driven by the necessity to reduce the interferences among the target species. Finally, the information on pressure and temperature can be gathered from the spectral features of all the target species that are simultaneously retrieved and not only from CO2lines.
Both the Geo-fit and MTR functionalities are imple-mented in the GMTR (Geofit Multi Target Retrieval) open-source code available at http://www.science-and-technology. nl/beat/ and http://www.mbf.fci.unibo.it.
4.4 Spectroscopic database for MIPAS retrievals
Although general databases such as HITRAN (Rothman et al., 2005) or GEISA (Jacquinet-Husson et al., 2005) existed it was decided at the beginning of the development of the MI-PAS data processing software to generate a dedicated spec-troscopic database for MIPAS, as was done for the ATMOS experiment (Gunson et al., 1996), in order to be able to im-plement the best spectral parameters in the shortest possible time and also to meet the specific needs of MIPAS. The first version “mipas pf2.0” was based on both the 1996 version of HITRAN and on new laboratory spectroscopic data and new calculations (Flaud et al., 2003a; Flaud et al., 2003b). After launch, version “mipas pf3.1” (Flaud et al., 2003c) of the MIPAS dedicated spectroscopic database was released. With respect to the former one it contained improvements concerning mainly the following molecules: CO2, HNO3,
CH4, NO2, O3, and COF2. In particular, the new
spectro-scopic data for HNO3in the 11.2 µm spectral region are
re-sponsible for a change of about 14% in the retrieved HNO3
volume mixing ratios (Flaud et al., 2003b). This change was assessed and validated by simultaneous retrievals of atmo-spheric HNO3profiles in the 11.2 µm spectral region and in
the pure rotation region (Mencaraglia et al., 2006). More re-cently a new version “mipas pf3.2” including changes con-cerning the NO, OCS, NH3, H2O2, and HNO3molecules has
to validate the HNO3line parameters on the whole MIPAS
spectral domain (Flaud et al., 2006). Finally it proved pos-sible using new spectroscopic data to observe the H15NO3
species in MIPAS spectra (Flaud et al., 2007).
5 Observation strategy and measurement modes
5.1 Rationale
5.1.1 Introductory remarks
The scientific objectives as described in Sect. 2 and the ob-serving capabilities as outlined in Sect. 3 are manifold re-quiring a flexible observation strategy. The observing capa-bilities allow vertical sampling steps of 1 to 8 km, tailored to the scientific objectives. The altitude coverage that can be commanded is 5 to 160 km, thus including the range from the free troposphere up to the thermosphere. Rearward and side-ward views are possible with an azimuth scanning range of 35◦and 30◦, respectively. In the rearward (i.e. along-track) view this allows e.g. (1) a complete pole to pole coverage by compensating for the inclination of the orbit or (2) to mea-sure along tracks parallel to the satellite subtrack. In the sidewards (i.e. cross-track) view the azimuth range permits the observation of special targets, e.g. to view parallel to the terminator or to stare at a special event (e.g. volcanic erup-tion). Consequently, a high degree of freedom concerning possible observation modes is realised. On the other hand operational constraints, the reliability of retrievals, and the standardization of processing routines had to be taken into account. Based on this, a set of different observation modes was specified and a mission plan, which defines the distri-bution of observation modes over the lifetime of ENVISAT, was established.
The following sections describe the observation modes that were effective for the first two years of MIPAS in space. Upon increasing failure rates in the interferometer drive unit in 2004 a major change in the operation of the interferometer was introduced with reduced optical path difference. Con-strained by this the spectral resolution was reduced to about 40% of the prior value and the duty cycle of MIPAS was re-stricted in 2005 to 35%. Recently, the duty cycle has been increased step by step reaching 100% in December 2007. As a consequence, the observation modes and the mission plan had to undergo major revisions which are not subject of this paper since this paper focuses onto the first two years when MIPAS operated with full spectral resolution.
5.1.2 Spatial coverage
The scientific objectives make it clear that polar, as well as mid- and low-latitude coverage is required. Furthermore, given the importance of flexibility, it was requested to en-sure that MIPAS could observe any region of the globe as
otherwise unexpected phenomena could be missed. Conse-quently, it was requested to make both the elevation and az-imuth angles of MIPAS adjustable.
The elevation scan was requested to cover altitudes ex-tending from the middle troposphere to the lower thermo-sphere. Measurements in the upper troposphere are needed e.g. to study troposphere-stratosphere exchange processes and pollution by aircraft emissions. However, the primary scientific objective of MIPAS is the investigation of strato-spheric processes, in particular chemical reactions and trans-port, which necessitates the simultaneous measurement of the distribution of many trace constituents in this part of the atmosphere. Measurements in the meso- and thermosphere are mainly used for studying Non-LTE processes and inter-actions between the thermo-, meso- and stratosphere. 5.1.3 Spatial resolution
More recent field measurements have shown that the vari-ability in the spatial distribution of atmospheric constituents in the upper troposphere and lower stratosphere can be quite large, in particular across the polar vortices and close to the tropopause. However, classical limb viewing remote sensing sensors can provide only limited spatial resolution. MIPAS has an IFOV of about 3 km×30 km which, as a rule of thumb, limits the resolution in the vertical domain to 3 km, and in the horizontal domain to about 300 km along the line of sight and 30 km perpendicular to the line of sight. As a consequence, it is not possible to resolve small scale phenomena in the at-mosphere with such instruments.
On the other hand, space-borne remote sensing can pro-vide good global surveys of stratospheric composition. For studying the chemistry of the stratosphere a horizontal reso-lution of about 500 km is mostly sufficient and equivalent to the resolution of state-of-the-art chemical transport models.
Concerning troposphere-stratosphere exchange processes it is obvious that single medium and small scale processes like the effect of a single convective tower or tropopause folds cannot be resolved with MIPAS. On the other hand, for the main upward transport from the troposphere into the stratosphere the horizontal resolution of MIPAS should suf-fice.
The relatively high signal-to-noise ratios of spectra ob-served in the UTLS (Upper Troposphere Lower Strato-sphere) allows to gain from oversampling, i.e. using sam-pling grids smaller than the width of the IFOV and thus to achieve vertical resolutions of better than 3 km for certain parameters.
5.1.4 Temporal coverage and resolution
Various time scales are of importance, namely those associ-ated with diurnal and with long term variations. The detec-tion of diurnal variadetec-tions can provide a powerful test of pho-tochemical theory but, in principle, a sun-synchronous orbit