Correlated gene expression supports synchronous activity in
brain networks
Jonas Richiardi1,2,*,†, Andre Altmann1,†, Anna-Clare Milazzo3,1, Catie Chang4, M. Mallar Chakravarty5,6, Tobias Banaschewski7, Gareth J. Barker8, Arun L.W. Bokde9, Uli
Bromberg10, Christian Büchel10, Patricia Conrod8,11, Mira Fauth-Bühler12, Herta Flor13, Vincent Frouin14, Jürgen Gallinat15, Hugh Garavan9,16, Penny Gowland17, Andreas Heinz15, Hervé Lemaître18,19, Karl F. Mann12, Jean-Luc Martinot18,19, Frauke Nees13, Tomáš
Paus20,21, Zdenka Pausova22, Marcella Rietschel23, Trevor W. Robbins24, Michael N. Smolka25, Rainer Spanagel26, Andreas Ströhle15, Gunter Schumann8,27, Mike Hawrylycz28,
Jean-Baptiste Poline29, Michael D. Greicius1,*, and IMAGEN consortium‡
1Functional Imaging in Neuropsychiatric Disorders Laboratory, Department of Neurology and
Neurological Sciences, Stanford University, Stanford, CA, USA 2Laboratory of Neurology and
Imaging of Cognition, Department of Neuroscience, University of Geneva, Geneva, Switzerland
3The War Related Illness and Injury Study Center, VA Palo Alto Health Care System, Palo Alto,
CA, USA 4Advanced MRI Section, Laboratory of Functional and Molecular Imaging, National
Institute of Neurological Disorders and Stroke, National Institutes of Health, Bethesda, MD, USA
5Cerebral Imaging Centre, Douglas Mental Health University Institute, Montreal, Canada 6Departments of Psychiatry and Biomedical Engineering, McGill University, Montreal, Canada 7Department of Child and Adolescent Psychiatry, Central Institute of Mental Health, Medical
Faculty Mannheim, Heidelberg University, Mannheim, Germany 8Institute of Psychiatry,
Psychology and Neuroscience, King’s College London, London, UK 9Institute of Neuroscience,
Trinity College Dublin, Dublin, Ireland 10Universitaetsklinikum Hamburg Eppendorf, Hamburg,
Germany 11Department of Psychiatry, Université de Montréal, Centre Hospitalier Universitaire
(CHU) Ste Justine Hospital, Montréal, Canada 12Department of Addictive Behaviour and
Addiction Medicine, Central Institute of Mental Health, Medical Faculty Mannheim, Heidelberg University, Mannheim, Germany 13Department of Cognitive and Clinical Neuroscience, Central
Institute of Mental Health, Medical Faculty Mannheim, Heidelberg University, Mannheim, Germany 14Neurospin, Commissariat à l’Energie Atomique et aux Energies Alternatives, Paris,
France 15Department of Psychiatry and Psychotherapy, Campus Charité Mitte, Charité–
*Corresponding author. [email protected] (J.R.); [email protected] (M.D.G.). †These authors contributed equally to this work.
‡IMAGEN consortium (www.imagen-europe.com) authors and affiliations are listed in the supplementary materials. SUPPLEMENTARY MATERIALS
www.sciencemag.org/content/348/6240/1241/suppl/DC1
Materials and Methods
HHS Public Access
Author manuscript
Science
. Author manuscript; available in PMC 2016 June 12.Published in final edited form as:
Science. 2015 June 12; 348(6240): 1241–1244. doi:10.1126/science.1255905.
A
uthor Man
uscr
ipt
A
uthor Man
uscr
ipt
A
uthor Man
uscr
ipt
A
uthor Man
uscr
ipt
Universitätsmedizin Berlin, Berlin, Germany 16Departments of Psychiatry and Psychology,
University of Vermont, Burlington, VT, USA 17School of Physics and Astronomy, University of
Nottingham, Nottingham, UK 18Institut National de la Santé et de la Recherche Médicale,
INSERM Unit 1000 “Neuroimaging and Psychiatry,” University Paris Sud, Orsay, France
19INSERM Unit 1000 at Maison de Solenn, Assistance Publique Hôpitaux de Paris (APHP),
Cochin Hospital, University Paris Descartes, Sorbonne Paris Cité, Paris, France 20Rotman
Research Institute, University of Toronto, Toronto, Canada 21School of Psychology, University of
Nottingham, Nottingham, UK 22The Hospital for Sick Children, University of Toronto, Toronto,
Canada 23Department of Genetic Epidemiology in Psychiatry, Central Institute of Mental Health,
Medical Faculty Mannheim, Heidelberg University, Mannheim, Germany 24Behavioural and
Clinical Neuroscience Institute and Department of Psychology, University of Cambridge, Cambridge, UK 25Department of Psychiatry and Psychotherapy, and Neuroimaging Center,
Technische Universität Dresden, Dresden, Germany 26Department of Psychopharmacology,
Central Institute of Mental Health, Faculty of Clinical Medicine Mannheim, Mannheim, Germany
27Medical Research Council (MRC) Social, Genetic and Developmental Psychiatry (SGDP)
Centre, London, UK 28Allen Institute for Brain Science, Seattle, WA, USA 29Helen Wills
Neuroscience Institute, University of California Berkeley, Berkeley, CA, USA
Abstract
During rest, brain activity is synchronized between different regions widely distributed throughout the brain, forming functional networks. However, the molecular mechanisms supporting functional connectivity remain undefined. We show that functional brain networks defined with resting-state functional magnetic resonance imaging can be recapitulated by using measures of correlated gene expression in a post mortem brain tissue data set. The set of 136 genes we identify is significantly enriched for ion channels. Polymorphisms in this set of genes significantly affect resting-state functional connectivity in a large sample of healthy adolescents. Expression levels of these genes are also significantly associated with axonal connectivity in the mouse. The results provide convergent, multimodal evidence that resting-state functional networks correlate with the orchestrated activity of dozens of genes linked to ion channel activity and synaptic function.
Brain activity at rest exhibits intrinsic low-frequency synchronization between anatomically distinct brain regions (1). When observed with functional magnetic resonance imaging (fMRI), this coherence between regions (functional connectivity) defines 15 to 20 brain networks associated with such canonical functions as vision, language, episodic memory, and spatial attention (2–4). These functional networks are disrupted in several
neurodegenerative and neuropsychiatric diseases (5) and may constitute the maps followed by neurodegenerative diseases marching, trans-synaptically, across the brain (6). Although it has been shown that connectivity within the default-mode network (DMN) (7) and
topological measures of whole-brain networks (8) are heritable, the set of genes promoting functional connectivity remains unknown. To pursue this question, we applied a network modeling approach to both neuroimaging and gene expression data.
A
uthor Man
uscr
ipt
A
uthor Man
uscr
ipt
A
uthor Man
uscr
ipt
A
uthor Man
uscr
ipt
Using resting-state fMRI data from 15 healthy right-handed subjects (eight females, age range 18 to 29 years), we computed 14 well-known and reproducible functional networks (fig. S1) (9) by using independent component analysis (ICA). We then mapped samples from the Allen Institute for Brain Science (AIBS) human microarray data set (six subjects, two contributed both hemispheres, four contributed one hemisphere, one female, age range 24 to 57 years, totaling 3702 brain samples) (table S1) (10) to these networks by using normalized Montreal Neurological Institute (MNI) coordinates. To avoid biases due to gross
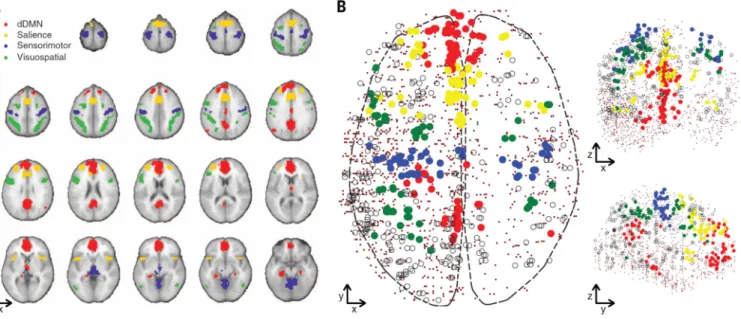
transcriptional dissimilarities in different brain regions, we excluded basal ganglia, cerebellum, and deep gray matter (including hippocampus), leaving only cortex samples (data file S1). This removed the basal ganglia network, leaving 13 networks. Of 1777 cortex samples, 501 were mapped to the 13 functional networks, and 1276 to “non-network” regions of the brain. We focused the analysis on four large nonoverlapping networks: dorsal default-mode (dDMN), salience, sensorimotor, and visuospatial (Fig. 1A), comprising 241 samples total. These four networks were chosen because they are well characterized in the imaging literature (2, 11–14), consist of noncontiguous regions in both hemispheres, and have adequate coverage in the AIBS data (Fig. 1B).
We used the transcriptional similarity of gene expression profiles between brain tissue samples to define correlated gene expression networks. In mouse brains, transcriptional similarity reflects cytoarchitecture (15), but in human brains, the differences are more subtle across the neo-cortex (10). As opposed to gene coexpression networks, which quantify gene-gene relationships across tissue samples (16), a correlated gene-gene expression network
quantifies tissue-tissue relationships across genes. Nodes were defined by brain tissue samples (Fig. 1B); edges were weighted by similarity between vectors of gene expression values at each sample. After preprocessing and assigning one probe for each of the 16,906 genes (data file S2) (17), we measured expression similarity by means of Pearson correlation (17), setting negative correlations to zero. Then we asked whether there are observable genetic correlates for the functional network organization: Are gene expression correlations in functionally grouped regions higher than can be expected by chance?
We defined the strength fraction in functional networks as a measure of the relationship between correlated gene expression within and outside the set of functional networks of interest. Denoting W the sum of all edge weights within all functional networks, Wi the sum of weights within the four functional networks of interest, and T the brain graph’s total strength (sum of all edge weights linking the full 1777-nodes graph), the strength fraction is S = Wi/(T − W). Higher values of S mean that the samples in the set of functional networks are more similar to each other, relative to the remaining brain regions (fig. S2). We assessed significance using permutation testing (18), randomly reshuffling 10,000 times the sample-to-network assignment in the full 1777-nodes graph. In addition to considering only cortex samples, so as to avoid biasing results toward similar tissues (10), before computation we removed edges linking two samples belonging to the same tissue class [defined by means of regional ontology (fig. S3 and table S4)]. Grouping gene expression samples according to functional networks yielded a higher strength fraction than that of other groupings of samples; the spatial organization of functional networks corresponded to regions that have
A
uthor Man
uscr
ipt
A
uthor Man
uscr
ipt
A
uthor Man
uscr
ipt
A
uthor Man
uscr
ipt
functional networks are spatially distributed, this finding cannot emerge from spatial proximity or gross tissue similarity.
We next sought to identify which genes, specifically, drive the relationship between
correlated gene expression and functional networks. We computed the marginal influence of each gene on strength fraction of all four functional networks together (17) and ranked genes across all six different two-way splits of the six subjects (17). Then, we computed list overlap statistics (19) between the two brain subgroups at a false discovery rate (FDR) of 5%. Combining results from six splits, the final list was obtained via stability selection (20), selecting genes that appear in the majority of splits (four or more out of six). This resulted in a consensus list of 136 genes (table S2).
We validated our findings in vivo (supplementary text) using paired genome-wide single-nucleotide polymorphism (SNP) data and resting state fMRI (rs-fMRI) recordings in n = 259 14-year-olds (126 females) from the IMAGEN database (21), which has more subjects, but not all were usable (data file S3) (17). The strength fraction for the combined four networks in the rs-fMRI data was computed for every subject (as in the AIBS gene expression data) and used as a quantitative imaging phenotype in a genome-wide association study (GWAS) (fig. S4), correcting for several covariates, including motion. We computed a z statistic (22) for the enrichment of P values in the consensus list. Genetic variation in the consensus list was significantly associated with in vivo rs-fMRI strength fraction (z = 2.55, P = 0.006). Thus, not only gene expression levels but also common polymorphisms in the consensus genes were related to the strength of functional networks. Subjects at both ends of the spectrum of multilocus genetic scores [representing the multiallelic effect of the genes in the consensus list on the functional connectivity phenotype (17)] showed definite differences in functional connectivity strength mostly within the functional networks themselves, but also between the functional networks (Fig. 2 and fig. S5).
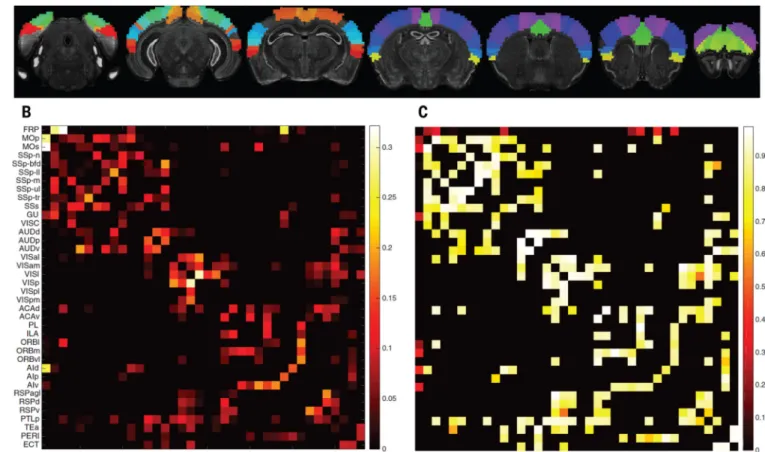
We next investigated the relationship between our gene list and the connectivity of axonal projections underlying functional networks. We used the Allen Institute mouse brain atlas (15), which offers finely sampled whole-genome expression data, together with a recent mesoscale model of mouse connectivity derived from the Allen Mouse Brain Connectivity Atlas (AMBCA) (23). To match human data, we focused on the mouse isocortex and used a 38-region parcellation (Fig. 3A) (23). With 57 mouse orthologs for our consensus gene list, we obtained a correlated gene expression network, representing transcriptional similarity between these 38 regions. We computed a normalized, symmetric connectivity matrix from the significant connections in the ipsilateral connectivity model of the AMBCA (17). We tested the association between the mouse connectivity graph and transcriptional similarity graph (Fig. 3, B and C) using a modified Mantel procedure; we randomly selected gene subsets of the same size as our ortholog consensus list 10,000 times in order to obtain a null distribution. The correlation between transcriptional similarity in these 38mesoscale isocortex regions and their axonal connectivity was significantly higher when using our list than expected by chance (P = 0.011, or P = 0.022 when using the contralateral connectivity model).
A
uthor Man
uscr
ipt
A
uthor Man
uscr
ipt
A
uthor Man
uscr
ipt
A
uthor Man
uscr
ipt
Last, we categorized the consensus gene list using Gene Ontology (GO) by computing statistical overrepresentation for Biological Processes (BP), Cellular Component (CC), and Molecular Function (MF) with the Database for Annotation, Visualization, and Integrated Discovery (DAVID) 6.7 (24). The only significant MF annotation [P < 0.05, Benjamini-Hochberg False Discovery Rate (FDRBH)–corrected] related to ion transport. No BP annotation was significant. Four out of six significant CC annotations (P < 0.03 FDRBH) concerned ion channels, in particular involving sodium channels such as SCN4B or
receptors such as GABRA5 (full annotation list is available in tables S5 and S6). Significant associations with nine diseases, including Alzheimer’s disease and schizophrenia (P < 0.05 FDRBH), which are network disorders, were also found (table S10). We validated
annotations in vivo on IMAGEN data by restricting the analysis to these seven significant GO terms. Genetic variation in all but 1 GO term was significantly associated with in vivo functional connectivity (z > 4.02, P < 2.8 × 10⁻⁵ uncorrected) (table S9). Using a mouse transcriptome database (25), we also found that 39 mouse orthologs from our list were significantly enriched in neurons, 19 in astrocytes, and 14 in oligodendrocytes (76 were not significantly overexpressed in any of these three cell types). This suggests that the
relationship between gene expression and spatial organization into functional networks may be due to neuronal processes more than to support cell or white-matter processes.
Functional networks are fundamental to many brain processes in humans. Here, we show that network strength was correlated with the expression of genes tightly linked to synaptic function. The preservation of the association between functional networks and gene expression across the lifespan (IMAGEN, 14-year-olds; AIBS, 24- to 55-year-olds) is remarkable and could be partly explained by the relative stabilization of interregional transcriptional similarity from adolescence onwards (26). Genes in our list may also play a role in certain diseases; some are implicated in brain disorders such as Alzheimer’s and schizophrenia (27), whose pathogenesis is thought to relate, in part, to aberrant connectivity. Beyond humans, it appears that similar mechanisms extend to lower animals because our list is significantly associated with mouse neural connectivity, and several gene functions from our list were found in a study examining genes supporting neural connectivity in rodents (tables S3, S7, and S8) (28). Thus, our results show that across developmental stages and species, functional connectivity in brain networks is integrally linked to the machinery of synaptic communication.
Supplementary Material
Refer to Web version on PubMed Central for supplementary material.
Acknowledgments
We thank C.-K. Lee for help with AIBS data normalization and C. Quairiaux for help with mouse brain anatomy. Functional networks imaging data are at http://findlab.stanford.edu/functional_ROIs.html. Human microarray data are at http://human.brain-map.org. IMAGEN data are available by application to consortium coordinator G. Schumann (http://imagen-europe.com) after evaluation according to an established procedure. Mouse gene expression data are at http://mouse.brain-map.org. Connectivity model data are from (23). J.R. is supported by a Marie Curie Fellowship from the European Union (299500). M.D.G. is supported by grants from the Feldman Family Foundation and the National Institutes of Health (RO1NS073498). This work received additional support
A
uthor Man
uscr
ipt
A
uthor Man
uscr
ipt
A
uthor Man
uscr
ipt
A
uthor Man
uscr
ipt
IMAGEMEND (602450; IMAging GEnetics for MENtal Disorders) and MATRICS (603016), the Innovative Medicine Initiative Project EU-AIMS (115300-2), a Medical Research Council Programme Grant “Developmental pathways into adolescent substance abuse” (93558), the Swedish funding agency FORMAS, the Medical Research Council and the Wellcome Trust (Behavioral and Clinical Neuroscience Institute, University of Cambridge), the National Institute for Health Research (NIHR) Biomedical Research Centre at South London and Maudsley NHS Foundation Trust and King’s College London, the Bundesministerium für Bildung und Forschung (BMBF; grants 01GS08152, 01EV0711, eMED SysAlc01ZX1311A, and Forschungsnetz AERIAL), the Deutsche
Forschungsgemeinschaft (DFG; grants FOR 1617, EXC 257, SM 80/7-1, SM 80/7-2, and SFB 940/1), the U.S. National Institutes of Health (Axon, Testosterone and Mental Health during Adolescence; RO1 MH085772-01A1), Eranet–Neuron grant (project AF12-NEUR0008-01 - WM2NA), MILDECA, Fondation pour la Recherche Médicale, NIH Consortium grant U54 EB020403, which is supported by a cross-NIH alliance that funds Big Data to Knowledge Centers of Excellence, and the Allen Institute for Brain Science.
REFERENCES AND NOTES
1. Fox MD, Raichle ME. Nat. Rev. Neurosci. 2007; 8:700–711. [PubMed: 17704812]
2. Smith SM, et al. Proc. Natl. Acad. Sci. U.S.A. 2009; 106:13040–13045. [PubMed: 19620724] 3. Birn RM. Neuroimage. 2012; 62:864–870. [PubMed: 22245341]
4. Shehzad Z, et al. Cereb. Cortex. 2009; 19:2209–2229. [PubMed: 19221144] 5. Fox MD, Greicius M. Front. Syst. Neurosci. 2010; 4:19. [PubMed: 20592951]
6. Seeley WW, Crawford RK, Zhou J, Miller BL, Greicius MD. Neuron. 2009; 62:42–52. [PubMed: 19376066]
7. Glahn DC, et al. Proc. Natl. Acad. Sci. U.S.A. 2010; 107:1223–1228. [PubMed: 20133824] 8. Fornito A, et al. J Neurosci. 2011; 31:3261–3270. [PubMed: 21368038]
9. Shirer WR, Ryali S, Rykhlevskaia E, Menon V, Greicius MD. Cereb. Cortex. 2012; 22:158–165. [PubMed: 21616982]
10. Hawrylycz MJ, et al. Nature. 2012; 489:391–399. [PubMed: 22996553]
11. Mantini D, Perrucci MG, Del Gratta C, Romani GL, Corbetta M. Proc. Natl. Acad. Sci. U.S.A. 2007; 104:13170–13175. [PubMed: 17670949]
12. Dosenbach NUF, et al. Proc. Natl. Acad. Sci. U.S.A. 2007; 104:11073–11078. [PubMed: 17576922]
13. Golland Y, Golland P, Bentin S, Malach R. Neuropsychologia. 2008; 46:540–553. [PubMed: 18037453]
14. Roosendaal SD, et al. Brain. 2010; 133:1612–1621. [PubMed: 20356855] 15. Ng L, et al. Nat. Neurosci. 2009; 12:356–362. [PubMed: 19219037] 16. Zhang B, Horvath S. Stat. Appl. Genet. Mol. Biol. 2005; 4:e17. 17.
Materials and methods are available as supplementary materials on Science Online.
18. Richiardi, J.; Altmann, A.; Greicius, M. Proceedings of the 3rd International Workshop on Pattern Recognition in NeuroImaging (PRNI). Philiadelphia: PRNI; 2013. p. 70-73.
19. Natarajan L, Pu M, Messer K. Ann. Appl. Stat. 2012; 6:521–541. [PubMed: 23335952] 20. Meinshausen N, Bühlmann P. J. R. Stat. Soc. Series B Stat. Methodol. 2010; 72:417–473. 21. Schumann G, et al. IMAGEN consortium. Mol. Psychiatry. 2010; 15:1128–1139. [PubMed:
21102431]
22. Nam D, Kim J, Kim S-Y, Kim S. Nucleic Acids Res. 2010; 38:W749–W754. (Web Server). [PubMed: 20501604]
23. Oh SW, et al. Nature. 2014; 508:207–214. [PubMed: 24695228]
24. Huang W, Sherman BT, Lempicki RA. Nat. Protoc. 2009; 4:44–57. [PubMed: 19131956] 25. Cahoy JD, et al. J Neurosci. 2008; 28:264–278. [PubMed: 18171944]
26. Pletikos M, et al. Neuron. 2014; 81:321–332. [PubMed: 24373884] 27. Heck A, et al. Neuron. 2014; 81:1203–1213. [PubMed: 24529980]
28. Wolf L, Goldberg C, Manor N, Sharan R, Ruppin E. PLOS Comput. Biol. 2011; 7:e1002040. [PubMed: 21573208]
A
uthor Man
uscr
ipt
A
uthor Man
uscr
ipt
A
uthor Man
uscr
ipt
A
uthor Man
uscr
ipt
Fig. 1. Functional networks in MRI and gene expression data
(A) The four functional networks of interest. Red, dorsal default mode; yellow, salience; green, visuospatial; blue, sensorimotor. (B) AIBS brain samples assigned to their
corresponding functional network. Solid circles are samples assigned to the four networks of interest, open circles show samples in the nine other networks, and dots show non-network AIBS samples.
A
uthor Man
uscr
ipt
A
uthor Man
uscr
ipt
A
uthor Man
uscr
ipt
A
uthor Man
uscr
ipt
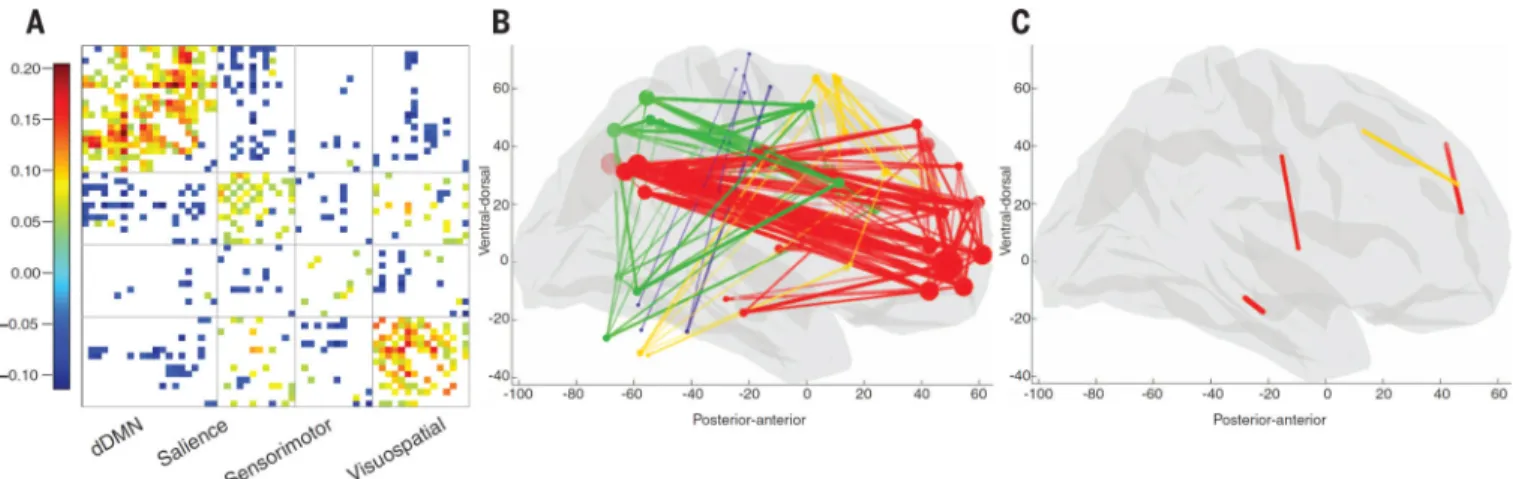
Fig. 2. In vivo functional connectivity differences related to the consensus gene list
Difference in in vivo functional connectivity between the averages of the top 20 and the bottom 20 subjects in IMAGEN, ranked by genotype score with respect to the consensus list of genes. (A) Difference matrix sorted by functional network (correlation differences smaller than |0.05| are not shown). Positive values indicate connections that are stronger in high genotype score subjects, and negative values indicate the opposite. Connections are mostly increased within functional networks, but also between some functional networks. (B) MNI space sagittal view of within-network connections that are stronger in high-genotype-score subjects. Regions (disks) are coded according to the functional network they belong to: red, dorsal default mode; yellow, salience; green, visuospatial; blue, sensorimotor. Connections (lines) are color-coded to their functional networks. (C) Same, for connections that are stronger in low-genotype-score subjects. The majority of connections are strengthened in high-genotype-score subjects.
A
uthor Man
uscr
ipt
A
uthor Man
uscr
ipt
A
uthor Man
uscr
ipt
A
uthor Man
uscr
ipt
Fig. 3. Mouse mesoscale connectivity and transcriptional similarity
(A) Mouse isocortex parcellated into 38 regions (23). (B) Corresponding symmetrized, thresholded, and normalized ipsilateral axonal connectivity weights. (C) Transcriptional similarity (genetic correlation), using our consensus list of genes.