HAL Id: hal-01546514
https://hal.archives-ouvertes.fr/hal-01546514
Submitted on 16 May 2020
HAL is a multi-disciplinary open access archive for the deposit and dissemination of sci-entific research documents, whether they are pub-lished or not. The documents may come from teaching and research institutions in France or abroad, or from public or private research centers.
L’archive ouverte pluridisciplinaire HAL, est destinée au dépôt et à la diffusion de documents scientifiques de niveau recherche, publiés ou non, émanant des établissements d’enseignement et de recherche français ou étrangers, des laboratoires publics ou privés.
To cite this version:
A. Martin, C. Margoum, Jérôme Randon, Marina Coquery. Silicone rubber selection for passive sam-pling of pesticides in water.. Talanta, Elsevier, 2016, 160, pp.306-313. �10.1016/j.talanta.2016.07.019�. �hal-01546514�
Silicone rubber selection for passive sampling of pesticides in water
A. Martin a, C. Margoum*a, J. Randon b, M. Coquery a
a
Irstea, UR MALY, 5 rue de la Doua, BP 32108, F-69616 Villeurbanne Cedex, France b
Univ Lyon, CNRS, Université Claude Bernard Lyon 1, Ens de Lyon, Institut des Sciences Analytiques, UMR 5280, 5 rue de la Doua, F-69100 Villeurbanne, France
*Corresponding author: Tel: + 33 4 72 20 87 11; Fax: + 33 4 78 47 78 75; Email address: [email protected]
Abstract
Silicone rubber can extract organic compounds with a broad range of polarities
(log Kow>2–3) from aqueous samples. Such compounds include substances of major concern
in the protection of aquatic ecosystems and human health, e.g. pesticides. Silicone rubbers (SRs) with various characteristics have been successfully used in sorptive methods for water sample extraction in the laboratory (SPME, SBSE), and for passive sampling in aquatic environments. However, only few studies have evaluated variability in organic compound sorption due to the origin of SRs, particularly for pesticides. The aim of this study was to select an SR for the extraction of pesticides from water samples by passive sampling. To this end we measured the impact of seven SR formulations on sorption capacity, defined by the
partition coefficient (Ksw). Kinetic experiments and sorption isotherms were performed to
determine extraction recovery as a selection criterion for SRs, and pesticide partition coefficients. Very large differences in affinity for pesticides were found between two kinds of SRs: “Polymerized SR kits” and “Manufactured SRs”. One SR was chosen among the
“Manufactured SRs”, and the Ksw values of 21 pesticides were determined, filling a gap in the
literature (1.50<log Kow<5.51). In light of sorption properties, literature data and additional
economic and technical factors, we suggest using SR from Goodfellow in future work to
reduce the variability of Ksw literature values.
Keywords: Pesticide, Silicone rubber, Partition coefficient, Passive sampling, Liquid chromatography
Introduction
Intensive agricultural consumption of pesticides requires the accurate monitoring of these contaminants in the aquatic environment to protect aquatic ecosystems and human health. Pesticides are present in trace amounts, and comprise organic compounds with a wide range of properties, raising a challenge for sampling and analytical methods to evaluate water resource quality. A number of sorptive techniques based on silicone rubber (SR) materials have been developed over the past 30 years to extract organic compounds such as pesticides. Silicone rubbers were developed as sorptive extraction phases in the 1980s, the dominant polymer being polydimethysiloxane (PDMS). The most popular sorptive methods using SR, combining robustness and reproducibility, are solid-phase microextraction (SPME) [1], stir bar sorptive extraction (SBSE) [2] and silicone rods/tubes [3]. SRs are mechanically resistant, insoluble in the common solvents used for analyte back-extraction, and allow thermal desorption at high temperatures (250–300 °C) [3]. Silicone rubbers will extract organic
compounds with a broad range of polarities (PAHs, PCBs, pesticides, etc., with log Kow>2–3)
from aqueous solutions, despite their hydrophobic nature [4]. The characteristics of SRs have also been successfully exploited for in situ passive sampling in surface waters with the membrane-enclosed silicone collector (MESCO) [5], passive SBSE [6] and silicone rods/sheets/tubes [3], [7] and [8].
All extraction methods using SR are based on partitioning the analytes between the
water sample and the silicone phase, which is governed by the partition coefficient (Ksw),
defined as the ratio of the concentration of the analyte in the silicone to its concentration in water in equilibrium conditions. The partition coefficient is one of the key parameters in sorptive methods using SRs, as illustrated by the theoretical calculation of extraction recovery for SBSE in batch experiments (Eq. (1), from [9]) and calculation of in situ water
concentration (Cw(in situ), µg L−1) for passive sampling of hydrophobic contaminants in field
applications over a period of exposure (Eq. (2), from [5]).
sw w sw s Extraction recovery K V K V , (Eq. 1)
s
w( ) sw s sw s C 1 exp( / ) in situ C t K R t K V . (Eq. 2)Other parameters are also required, such as volume of water in batch experiments (Vw,
L), volume of silicone (Vs, L), sampling rate (Rs, L d−1), and exposure time of a passive
sampler (t, d).
The popularity of SRs as sorptive materials has prompted numerous studies using materials of varied origin and from different suppliers, raising concerns about the variability of sorption properties [3], [10] and [11]. Some components are present in SR formulations in varying proportions, resulting in physical-chemical properties specific to each material (e.g., density, hardness, elongation) [12]. Silicone rubber manufacturing requires additional components such as a base and a crosslinking agent (silicone oils) that react by various chemical mechanisms via a catalyst (platinum cure or peroxide activated cure), and often also a filler (amorphous or modified silica, calcium carbonate, metasilicate, etc.) for mechanical strength [12]. The base and the crosslinking polymer can be pure PDMS or modified polysiloxane with some phenyl, vinyl or fluoro groups (MVQ, PMVQ or FMVQ) of various molecular weights and low functional content. The complex manufacturing process, unfortunately not disclosed by silicone suppliers, also generates non-polymerized residuals such as small polymer chains (oligomers) and other impurities [13].
However, only few studies have investigated the impact of this diversity on the sorption of organic compounds [10], [11] and [14]. Rusina et al. [11] showed that differences
in log Ksw values for several SRs reached 0.4 log units for four PAHs (log Kow from 3.37 to
6.86), and noted that the presence of fluorinated groups resulted in slightly lower Ksw values.
Ter Laak et al. [14] studied the uptake of polychlorinated biphenyls (PCBs) and
polybrominated diphenyl ethers (PBDEs) (log Kow 4.70–8.30) in PDMS fiber (SPME) and
PDMS sheets, and found better performance for PDMS sheet, 0.21±0.08 log units higher for the silicone-water partition coefficient. Yates et al. [15] and Smedes et al. [10] used a
co-solvent method with methanol to determine the Ksw of PAHs and PCBs on SRs obtained from
different suppliers, and showed different correlations between log Kow and log Ksw for these
two kinds of compounds. These results suggest that polymer-water partitioning is not driven exclusively by hydrophobic interactions, but also by compound-specific interactions with the polymer phase (electron-acceptor/donor characteristics of both) [10] and the free volume theory describing diffusion in polymers (size of the compound) [16]. Smedes et al. [10] also
found that differences in log Ksw from different suppliers ranged from 0.16 to 0.58 and might
differ by a constant SR-specific factor for PAHs and PCBs. These studies focused on the uptake of several specific classes of hydrophobic compounds with high affinity for SR, but
sorption of less hydrophobic compounds with log Kow<3–4, such as pesticides, have been less
thoroughly investigated, owing to lower affinity for SR material. Heterogeneity in chemical structures and properties of pesticides could also lead to greater differences than in previous studies on hydrophobic compounds in relation with SR material.
In this context, we investigated the sorption of pesticides over a broad polarity range by several SRs to select the best one for passive sampling in aquatic environments. Other economic factors and ease of applicability by laboratories were considered in the selection. The impact of SR formulation was tested using SRs from various suppliers, covering a broad diversity of silicone materials with different curing reactions, formulations and fields of application. We also highlighted the differences in material structure of the selected SRs by analyzing their functional groups, oligomer content and thermal resistivity. We performed batch kinetic experiments to determine experimental extraction recovery as an evaluation
criterion for pesticide uptake capacity. We then measured pesticide partition coefficients Ksw,
poorly documented in the literature, for the selected SR with a sorption isotherm in five
experiments. Finally, these data were related to their log Kow values with relevant literature
studies for various classes of organic compounds to enable a wider use of SR as a sorptive material.
Materials and methods
2.1. Experimental section
2.1.1. ChemicalsThe 23 pesticides selected, including two metabolites, covering a broad polarity range
(−0.06 < log Kow < 5.51), are listed in Table 1. Pesticides and one internal standard
(diuron-d6) were purchased from Dr Ehrenstorfer (Augsburg, Germany) and Sigma Aldrich (Saint-Quentin Fallavier, France). Acetone and dichloromethane for pesticide residue analysis, UHPLC grade acetonitrile and methanol were purchased from Biosolve (Dieuze, France). LC-MS grade formic acid (purity 98%) was supplied by Fischer Scientific (Illkirch, France). Ultrapure water was obtained using a Millipore water purification system equipped with an LC-Pak cartridge to remove remaining organic contaminants present in trace amounts (Billerica, MA, USA). Nitrogen gas (purity 99.995%) used for thermal decontamination was purchased from Air Liquide (Juhem, France).
Table 1. List of selected pesticides and LOQ obtained by UHPLC-MS/MS analysis.
Pesticide Abbreviation Log Kowa LOQ (µg L-1) b
Acetochlor ATC 4.14 0.40 Atrazine ATZ 2.70 0.10 Azoxystrobin AZS 2.50 0.020 Carbendazim CBZ 1.50 0.020 Chlorfenvinphos CFV 3.80 0.16 Chlorpiryphos-ethyl CPE 4.70 0.40 Chlorpiryphos-methyl CPM 4.00 0.40 Chlortoluron CTU 2.50 0.40 3,4-Dichloroaniline DCA 2.69 0.40 3-(3,4-Dichlorophenyl)-1-methylurea DCPMU 2.31* 0.16 Diflufenican DFF 4.2 0.40 Diuron DIU 2.87 0.40 Dimethomorph DMM 2.68 0.16 Flazasulfuron FLZ -0.06 0.20 Fenitrothion FNT 3.32 4.0 Isoproturon IPU 2.50 0.16 Linuron LINU 3.00 0.16 Metolachlor MTC 3.40 0.040 Norflurazon NFZ 2.45 0.40 Procymidon PCM 3.30 1.6 Simazine SMZ 2.30 0.020 Spiroxamine SPX 5.51* 0.16 Tebuconazole TBZ 3.70 0.16 a
University of Hertfordshire, Pesticide Properties DataBase: http://sitem.herts.ac.uk/aeru/ppdb/en/atoz.htm
b
Limit of quantification determined for direct analysis by UHPLC-MS/MS in Evian® water
* Predicted by ChemAxon: http://www.chemicalize.org/structure
2.1.2. Selection of silicone rubber materials and conditioning steps
The most widely used SR, commercialized by Gerstel under the name Twister® (TW) for analytical SBSE and recently used as a passive sampler (MESCO/Passive SBSE), was taken as a reference SR in this study. Six other SRs were selected to cover the diversity of silicone rubber formulations (Table 2). They were purchased from different manufacturers, either as silicone oils (“Polymerized SR kits”: one-component or two-component kits ready for polymerization) or as SR already polymerized by the manufacturer (“Manufactured SRs”). For “Polymerized SR kits”, we followed the suppliers’ instructions to produce polymerized sheets of SR approximately 3 mm thick in plastic Petri dishes, with heat for SY, ultraviolet light for UV and water for SB to initiate cross-linking. Five of the selected SRs had already been studied as extractive materials: TW [9] and SL [3] for water extraction in the laboratory;
AL, ST and SL for passive sampling of hydrophobic compounds (organochlorine pesticides, PAHs, PCBs [2] and [5]), and SY for passive sampling of pesticides [17].
To facilitate the comparison of SRs, raw materials from different suppliers were shaped into closely similar volumes. Silicone sheets were cut with a clean cutter blade into rectangular cuboids measuring approximately 20×3×3 mm, and silicone thread into rods 20×3 mm. Twister® was purchased in 20×1 mm thick PDMS film (V=126 µL), and the magnetic stirring bar was removed before use. Rectangular cuboid SR samples were selected by weight (170 mg±2.5%), and their exact volume was then calculated from their density (Table 2). Before use, SRs were cleaned by chemical and thermal conditioning to eliminate most residues, such as oligomers that can interfere with the instrumental analysis (particularly for thermodesorption (TD)-GC/MS analysis). First, SRs were chemically conditioned in a solvent mixture (dichloromethane: methanol, 50:50, v/v) under sonication for 15 min. Pieces of SRs were then wiped with lint-free tissue and dried at 70 °C for 1 h. Lastly, SRs were thermally treated in a Gerstel tube conditioner TC (Mülheim a/d Ruhr, Germany) under a
Table 2. Main properties of the selected silicone rubbers (SRs)
Material
(other name) Abbreviation
Supplier (Country)
Application field
Supplier formulation Shape
(thickness or size)
Density (rod volume)
Curing reactiona (filler)
Sylgard®184 SY Dow Corning (USA)
Electronics Polymerized SR kits (two components) Sheet (3 mm) 1.03a (165 µL) Hydrosilylation (Vinyl modified silica) X-34-4184 UV Shin Etsu
(Japan)
Industrial Polymerized SR kits (two components) Sheet (3 mm) 1.03a (165 µL) Hydrosilylation (Not specified) SILBIONE®MED ADH 4300 RTV SB Bluestar Silicones (USA)
Medical Polymerized SR kits
(one component) Sheet (3 mm) 1.08a (157 µL) Condensation (Silica amorphous and/or treated) Twister® TW Gerstel (Germany)
Analytical Manufactured SRs Stir bar (20 × 1 mm) 1.37b (126 µL) Not specified (Not specified) Altessil® (Versilic® S60V34B) AL Altec (UK) Laboratory Manufactured SRs Sheet (3 mm) 1.20a (142 µL) Peroxide-cured (Mineral fillers) Silastic/Silopren SL Goodfellow (UK)
Industrial Manufactured SRs Thread/rod (3 mm) 1.20b (133 µL) Not specified (Some chalk) SIL-TEC® (SILASTIC® BioMEdical Grade LSR) ST Technical Products (USA) Medical Manufactured SRs Sheet (3 mm) 1.20a (142 µL) Hydrosilylation (Silica) a
Information was collected from producers and/or internet sources
b
2.1.3. Kinetic study
A kinetic study of the selected SRs was performed to compare extraction recoveries, and determine the equilibrium time of the 23 pesticides. One piece of each SR was inserted into a 60 mL amber glass vial containing 50 mL of Evian® water spiked with the pesticides studied (pH=7.2). Acetone content, for water spiking, was calculated so as not to exceed 0.1 vol% in the aqueous phase. The initial spiked concentration of each pesticide was adjusted
from 0.4 µg L−1 to 15 µg L−1, depending on the analytical limit of quantification (Table 1),
and affinity with SR materials already reported with SBSE in water sample laboratory extraction [18]. Stirring (800 rpm) was done with a glass magnetic stir bar on a Variomag magnetic stirrer purchased from Thermo (Waltham, MA, USA). The experiment ran for 48 h in batches with one piece of SR for each sampling point at 15 min, 1 h, 3 h (triplicate), 8 h, 24 h (triplicate) and 48 h, with seven experimental blanks without pesticides and three control batches without SR.
The extraction recovery is expressed as the ratio of the mass of analyte in the SR phase
(ms) to the initial mass of analyte in the water phase (mw,0) corrected with the control batch.
For hydrophobic pesticides (log Kow≥3), ms was computed by the difference in
concentration of pesticides measured in water (Cw) between the control batch and the final
state of the experiment. For hydrophilic pesticides (log Kow<3), a direct determination by
solvent back-extraction of the SRs (see Section 2.2.2) was preferred. For hydrophilic pesticides, differences in concentrations in water between initial and final states were too low to determine extraction recovery, resulting in high uncertainties in final results.
2.1.4. Partition coefficients
Following on from the kinetic study, we investigated sorption capacity of the preferred
SR, SL, and TW as reference material (Table 2). With this aim, partition coefficients (Ksw)
were calculated in an isothermal experiment with five levels of concentration (C1, C5, C10, C25 and C50) expressed relative to C1. Initial spiked concentrations were adjusted for each pesticide to allow a quantitative analysis of concentration in equilibrium conditions: C1
concentration level corresponded to spiking at 0.5 µg L−1, for pesticides with log Kow<3 and at
10 µg L−1 for those with a higher log Kow. Like in the kinetic study, batch experiments were
performed in triplicate, at an ambient temperature of 20.5 °C with an equilibrium time of 48 h. Partition coefficients were calculated as the slope of the unweighted linear regression of
water in batches (Cw,eq in µg L−1) at equilibrium. Linear regressions were also performed with
errors in x and y axes by the Williamson-York bivariate method (in a Microsoft Excel spreadsheet adapted from Cantrell [19]). Linear regressions were forced through the origin, for non-detection of pesticides in SR blanks. The errors in x and y were specified as a confidence interval (α=0.05, n=3) taking into account uncertainties of SR and water volumes
for each experimental point. Slope uncertainty (u(Ksw)) was also expressed as a confidence
interval.
2.2. Analytical methods
2.2.1. Physical-chemical properties of silicone rubbers
To explain similarity or differences in the pesticide sorption properties of the SRs studied, we investigated the silicone chemical structure of raw SRs by infrared spectroscopy. Attenuated Total Reflectance spectroscopy (ATR-FTIR) is a rapid and easy technique for the identification of organic groups in cured organosilicon materials [13]. A spectrum Two with UATR accessory (Single Reflection Diamond) from Perkin Elmer (Roissy-en-France, France)
was used with a resolution of 4 cm−1 and 16 acquisitions per spectrum in the range 4000–
520 cm−1. Thermal gravimetric analysis (TGA) was carried out to obtain the residual content
of SRs (expressed in %) at high temperature and to determine the SR degradation temperature on raw and conditioned materials. First, TGAs were performed on a TA Instruments Q50
(New Castle, USA) under nitrogen and air stream up to 800 °C (90 mL min−1 and
50 °C min−1), maintaining the target temperature for 30 min. Second, TGAs were performed
under a helium stream of 45 mL min−1 with a temperature ramp of 10 °C min−1 up to 500 °C
(raw and conditioned SRs). The release of residual oligomers by chemical and thermal conditioning steps of SRs was also estimated by measuring weight loss between raw material mass and conditioned SR. Scan chromatograms were also acquired by TD-GC/MS analysis in
full scan mode (TD: 300 °C, 15 min, helium at 75 mL min−1), as detailed in Assoumani et al.
[20], to identify some oligomers and validate the usefulness of the conditioning steps. 2.2.2. Pesticide solvent back-extraction and sample preparation
Pesticides were desorbed from SRs by chemical extraction according to the protocol developed by Margoum et al. [18] for SBSE application. To compare SRs, optimization of the solvent back-extraction step was not required. Briefly, silicone rods were removed with clean tweezers from water, cleaned with ultrapure water and dried with a lint-free tissue. After
storage for at least 24 h at −18 °C, SRs were desorbed with 200 µL of methanol/acetonitrile (50:50, v/v) in a 250 µL flat-bottom glass insert under sonication in an ultrasonic bath (FB11014, Fisher Scientific, UK) for 15 min; 150 µL of ultrapure water and 10 µL of internal
standard solution (diuron-d6 at a concentration of 200 mg L−1) in acetone were then added to
40 µL of the desorbate to make up the extracted sample for analysis. Four steps of solvent back-extraction on the same silicone rod confirmed that the proportion of hydrophilic
pesticides (log Kow<3) extracted with the first step exceeded 80% (SI-1) and was not
statistically different from 100% (Student t-test, n=3, CL=95%). For experiments, analysis of water samples was performed by direct injection. A volume of 10 µL of diuron-d6 at a
concentration of 1000 mg L−1 was added to 990 µL of an aliquot of water to obtain a
concentration of diuron-d6 of 10 µg L−1 as for SR extract analysis.
2.2.3. Analysis by liquid chromatography
Ultra-high-performance liquid chromatography (UHPLC) was performed on a Shimadzu series Nexera X2 UHPLC system (Marne-la-Vallée, France). Analytes were separated on an Acquity UPLC® HSS T3 1.8 µm 2.1×100 mm column. Chromatographic separation of analytes was carried out with acetonitrile and ultrapure water, both with formic acid (0.1%) in an analytical gradient (from 10% to 90% acetonitrile) lasting 15 min at
0.4 mL min−1. The UHPLC system was coupled to a triple-quadrupole mass spectrometer
(MS/MS) API 4000 from AB Sciex (Les Ulis, France). The electrospray ion source (Turbo-Ionspray from AB Sciex) was set to positive mode at 600 °C. Quantification was performed with deuterated diuron-d6, used as injection internal standard. Settings for MS/MS analysis (SI-2) were from Margoum et al. [18] with additional pesticides optimized and validated later.
3. Results and discussion
3.1. Silicone rubber characteristics
The main readily available macroscopic SR parameter is density, which generally ranges from 1.05 to 1.60 [13]. In the data shown in Table 2, the densities of “Polymerized SR kits” sheets (SB, SY and UV) were lower than those of “Manufactured SRs” by 0.2 units. A higher density of SR reflects an increase in cross-link density or silica filler content, or substitution of methyl groups by other functional groups [12]. To our knowledge, few SRs with densities lower than 1.15 have been tested for compound sorption in water [10] and [11], but the density was not always known.
TGA at 800 °C under nitrogen ranked the SRs from lowest to highest content: SB(17.3%)>AL(31.0%)>TW(32.5%)>SL(35.5%)>SY(51.0%)>UV(60.4%)>ST(76.3%). More abundant residues could not be directly linked to higher filler content owing to the complex thermal degradation of crosslinked PDMS [21]. The equivalent final amount of residues and the similar nitrogen/air ratio (SY and UV≈0.90 and TW, AL and SL≈0.75) observed between SRs can be explained by their similar components and formulations.
The amount of oligomers eliminated by the conditioning steps was also studied to highlight differences in SR formulations. The mean weight loss recorded for the SRs studied after chemical and thermal conditioning was 3.2%. The SRs could be ranked from highest to
lowest release of residues:
SY(5.5%)>UV(3.9%)>SB(3.5%)>ST(3.5%)>SL(2.5%)>AL(1.9%)>TW(1.9%). The amounts of residues released by chemical and thermal conditioning were similar to those obtained by Rusina at al. [11], ranging from 2 to 4.2% with ethyl acetate and shaking (3 days) followed by Soxhlet extraction with the same solvent for a further 3 days. This loss could be attributed to the release of small residue molecules (oligomers) from raw polymers or residues from thermal degradation of cross-linked PDMS chains. PDMS undergoes thermal rearrangement at high temperature (250–350 °C) with cleavage of the siloxane chains to form products that are predominantly cyclic siloxanes of low molecular weight [21]. These results were completed by the analysis of chemical organic groups of the SR backbone by ATR-FTIR (SI-3), and TGA analysis of SY and SL after each conditioning step (SI-4). We concluded that “Polymerized SR kits” contained higher amounts of residues than “Manufactured SRs”, owing to a non-stoichiometric ratio in the curing process. These findings also demonstrate the efficiency of our selected conditioning steps for eliminating residuals in SRs. Additional investigation of the nature of residues in SRs by TD-GC/MS analysis is reported in SI-6. Mainly cyclic PDMS chains were found from cycloterasiloxane (octamethyl-), (M=296.6 Da) to cyclodecasiloxane (eicosamethyl-) (M=741.5 Da), and small linear PDMS chains (approximately 500 Da) with seven and eight dimethyl siloxane groups. These results agree with those of Lykissa et al. [22], who identified the main oligomers released in SRs as cyclic PDMS of 200–1500 Da, along with smaller amounts of linear PDMS of 500–1500 Da.
3.2. Kinetic study and determination of extraction recoveries
No pesticide degradation or adsorption was observed for the control batch during the 48 h of experimentation, except for PCM, with a mean decrease in concentration of 50%. The
half-time of hydrolysis in water of PCM is about 25 days (University of Hertfordshire, Pesticide Properties DataBase), so this decrease was probably due to adsorption on glass in
the experimental system. The most hydrophilic pesticide studied, FLZ (log Kow=−0.06), was
not sorbed in any of the SRs studied; no data are therefore presented for this compound. Repeatability of results between batches tested at 3 h and 24 h, expressed as RSD (n=3), was less than 15% for every SR.
For all the compounds, a first-order kinetic model of accumulation [9] was applied according to the SBSE theory, and a satisfactory correlation coefficient was obtained (r>0.87). For hydrophobic pesticides, the mass of pesticides sorbed remained stable after 24 h, as shown for DFF (Fig. 1a). For hydrophilic compounds, such as SMZ (Fig. 1b), equilibrium was reached more slowly (after 24–48 h). Uptake of hydrophilic compounds in SRs was lower in mass, consistent with the lower affinity for the SR phase. Differences between SRs in the uptake kinetics of hydrophilic compounds could be due to variations in the volume or apparent surface area of each silicone rod. The surface area of silicone rods can affect uptake kinetics but not equilibrium state. Different polymer diffusion coefficients can also influence kinetic parameters. Considering SR as an absorbent material [14], a strict comparison and selection of the best SR was required to normalize extraction recoveries to the same volume for all SRs.
Fig. 1. Uptake kinetics of (a) diflufenican (DFF, log Kow=4.2) and (b) simazine (SMZ,
log Kow=2.3) by studied SRs with first-order kinetic model. Triplicate at extraction time
of 3 h and 24 h.
Accordingly, extraction recoveries (R), calculated at 24 h (n=3), were normalized to a
volume of 150 µL (mean volume, VNS) of SR based on Eq. (1), to give a new criterion RNV
(extraction recovery normalized by volume) using Eq. (3).
W S NV W W S NS (1 ) V R V R V V R R V V . (Eq. 3)
The normalized RNV took into account uncertainties in SR volume (2.5% for weight
measurement and 5% for density). Overall, for all the SRs, pesticides with log Kow≥3 had
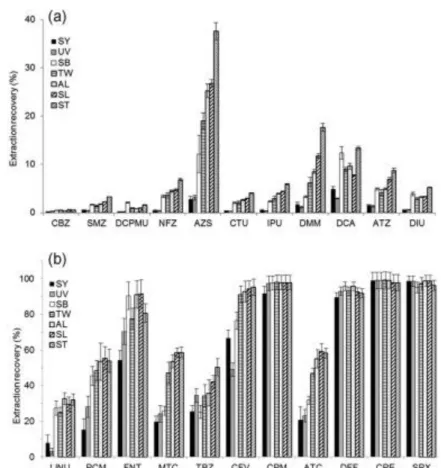
higher affinities, with RNV>20% (Fig. 2), in line with chemical properties of SRs [3] and [9].
However, the high affinity of AZS (log Kow=2.5, RNV=17%) toward SRs could be explained
Fig. 2. Extraction recoveries of studied pesticides on selected SRs normalized to volume of 150 µL (RNV) after 24 h. Pesticides were ranked in ascending order of log Kow with
log Kow<3 (a) and log Kow≥3 (b). Error expressed as standard deviation (n=3).
3.3. Comparison of sorption capacities and selection of the best SR
The extraction recovery normalized by volume, RNV, was used as a discriminating
criterion for comparison of SR sorption capacities for pesticides. One-way ANOVA (ANalysis Of VAriance) with a post hoc Tukey HSD (Honest Significant Differences) (XLStat software, 2015.4.1) was used to find SRs that were significantly different from each other, for each pesticide. Four pesticides (CPE, CPM, DFF and SPX) showed no significantly different extraction recoveries for the SRs studied. During the experiment, pesticide concentrations in water after 24 h lay below the limit of quantification (LOQ) (Table 1) in three cases (CPM, CPE and SPX). Consequently, differences in extraction recoveries, all near 100%, could not be deduced from the experimental data. Significant differences between the
different types of SRs were found for the other 19 pesticides, as illustrated by CFV, with RNV
ranging from 49% to 95% depending on the SR (Fig. 2). To our knowledge, this is the first time that such differences in sorption have been demonstrated between different formulations of SR for a broad range of pesticides. The earlier study of Rusina et al. [11], which compared
(corresponding to an RNV variation of 10% according to Eq. (1) and approximation for CFV of
log Ksw≈ log Kow=3.8).
A principal component analysis (PCA) (α=0.05) was performed to discriminate SRs (n=7) by extraction recoveries of relevant pesticides (n=19) (Fig. 3). The F1 and F2 axes explained respectively 82.9% and 9.2% of the data variability. The 19 variables were mainly positively linked to the F1 axis, which represents the mean value of extraction recoveries for each SR. Some pesticides were correlated positively (DCPMU) or negatively (TBZ) to the F2 axis, reflecting a special affinity of the silicone rubber SB for these compounds. Graphical representation of observations discriminated SRs mainly with regard to the F1 axis. The seven SRs investigated fell into three groups. SY and UV had very similar coordinates on the F1 and F2 axes, and showed the lowest pesticide sorption properties. For SB, we observed a medium affinity for pesticides, with the narrowest range of extraction recoveries. The last group presented the highest sorption properties for pesticides, with increasing effect on F1 axis: ST " SL>AL>TW, and similar F2 coordinates. These groups of SRs were the same as those obtained with the ratio of final residues (TGA under nitrogen and air, see results in SI-5), which identified similar components and formulation of SRs, with the exception of ST, which had a higher sorption capacity for pesticides than SL, AL and TW, and a higher final amount of residues than the other SRs. These results demonstrate that “Polymerized SR kits” (SY, UV and SB) were significantly less efficient for pesticide extraction than “Manufactured SRs” (AL, SL, ST, TW). This difference can be attributed to differences in formulation of the SRs, observed with ATR-FTIR spectroscopy (SI-3), showing a more complex internal network of PDMS chains in “Polymerized SR kits”. Macroscopically, the differences seem to result from lower SR densities (Table 2). Specific behavior of SB, compared with SY and UV, could be attributed to different cross-linking reactions (condensation vs. hydrosilylation). These conclusions are supported by the observations of Ter Laak et al. [14], who suggested that differences in SR formulations, such as cross-linking and polymer length, might modify
the solubility of the chemicals in the SR, and thus modify Ksw. An accurate understanding of
SR sorption differences for pesticides would require further data on the formulation of the different SRs tested, unfortunately not disclosed by manufacturers. This point was not taken further in this study.
Fig. 3. Comparison of SRs sorption properties for pesticides with PCA analysis (variables=19, individuals=7).
Using the results of the comparison of SR sorption capacities for pesticides, we then chose an SR from the group of “Manufactured SRs” with the best sorption properties for pesticides. Additional variables such as cost, commercial availability, available shapes (rods, sheets, etc.) and results of previous studies, were also taken into account. The production of AL was recently discontinued by the manufacturer. We selected the SR called SL (Table 2). This SR was also the one previously chosen to replace commercial Twister® in a MESCO passive sampler [23]. Further investigation is needed for other hydrophobic compounds to replace AL (no longer available) by SL.
3.4. Partition coefficients
To use SL as an extractive material for laboratory applications or as a passive sampler,
the Ksw of pesticides with SL and TW (as reference) were assessed by an isothermal
experiment at five concentration levels. In this experiment, the mass balance of control batches (i.e. without SR) was verified for the five spiked levels with all the pesticides, except for PCM (owing to its adsorption, see 3.2) and for DFF for the two highest spiked levels, because the initial water concentrations (see 2.1.4) exceeded solubility in water for this
compound (50 µg L−1 at 20 °C).
Linear sorption isotherms were obtained for 13 pesticides (ATZ, CBZ, CPE, DCA,
DCPMU, DFF, DIU, IPU, NFZ, SMZ and SPX) with a satisfactory correlation (r2>0.95) (all
sorption isotherms are available in SI-7) as predicted by absorption theory [14]. However, sorption isotherms of 10 other pesticides (ATC, AZS, CFV, CPM, CTU, DMM, FNT, LINU,
MTC, and TBZ) deviated from linear to curvilinear sorption isotherms at high concentration levels (C25 and C50). Equilibrium state at 48 h for C50 level was confirmed by further kinetic experiments over one week. Thus the Freundlich empirical model was applied for
these compounds Cs=KFCw1/n (Eq. (3)), with KF and n dimensionless Freundlich parameters.
These curvilinear sorption isotherms conflict with linear absorption isotherms generally accepted for SR with hydrophobic compounds [3]. This can be explained by double sorption mechanisms: absorption in the PDMS bulk, and adsorption onto other SR constituents such as amorphous or treated silica used as filler. In such adsorbent material, competition for pesticide adsorption can occur, and the material can be saturated, these two processes leading to a curvilinear sorption isotherm [24].
Sorption isotherms at low concentrations tested in our batch experiments, C1, C5 and
C10 (0.5 µg L−1 to 100 µg L−1), are the most relevant part of SR sorption isotherms, as these
concentrations lie in the range of those generally found in environmental waters and assessed
by passive sampling. Partition coefficients (Ksw) with SL silicone rubbers could thus be
deduced satisfactorily for all the pesticides studied by a linear regression over the whole concentration range with the Williamson-York bivariate method, which gives more weight to low concentration levels due to reduced experimental errors (SI-7).
We compared Ksw values determined for SL to those of TW determined in the same
experimental conditions. A linear correlation was found, described by log
Ksw(SL)=0.93og Ksw(TW)+0.44(r2=0.96). Thus, SL showed better extraction properties than
TW, with an increase of 0.44 log Ksw unit for the pesticides. This difference between SRs was
in line with the conclusions of Smedes et al. [10], who suggested a constant difference factor (from 0.16 to 0.58 log unit) for SR from five different suppliers with PAHs and PCB. These results also confirm previous conclusions drawn from sorption capacity comparisons (SL>TW) as demonstrated by PCA analysis (Fig. 3).
3.5. Correlation between log K
swand log K
owAs shown by other authors [25], the estimation of Ksw as a function of the polarity of
organic compounds, expressed as Kow, is expected to follow a linear correlation. We therefore
compiled Ksw and Kow from various compound families and SRs (only “Manufactured SRs”)
obtained by laboratory studies in the literature (anilines: this study (DCA) and [25]; chloro-benzenes: [25]; PAHs: [10], [15], [25] and [26]; PCBs: [10], [14], [15], [25] and [26]; pharmaceuticals: [27] and [28]; phenols: [25]; pesticides: this study and [25], [28] and [29])
(Fig. 4). Data with log Kow>3.5 (chlorobenzenes, PAHs, PCBs and pesticides) are well
represented in numerous studies, whereas data for more hydrophilic compounds (anilines, pesticides, pharmaceuticals and phenols) come from few studies. Previously studied
pesticides were mainly organochlorine pesticides (n=30) with log Kow>3 from Hestley [29]
with “Virgin PDMS” (d≈1, Diversified Silicone Products Inc.); and a few polar pesticides from Kwon et al. [25] (n = 5), with medical grade SR (d=1.17, Specialty Silicone Products), and from Magner et al. [28] (n=5) with SR tubing (unknown density, Noax Lab). Recent work on passive sampling of 124 pesticides using SR in river water [30] was not taken into account in this study because uptake kinetic of pesticides were insufficiently described (four points in an experiment over 25 days) and highly variable over time (no confirmation of the equilibrium state for several compounds). Thus data from our study on pesticides covering a
broad range of log Kow (1.50–5.51), fill an important gap in the literature, enabling wider use
of SR as a sorptive material (Fig. 4).
Fig. 4. Correlation between log Ksw and log Kow from this study and literature data
sorted by class of compounds: anilines (bars), chlorobenzenes (diamonds), PAHs (crosses), PCBs, (triangles), pharmaceuticals (stars), phenols (squares), and pesticides (circles colored by study).
A single linear relationship of data for all compounds (log Ksw=0.94log Kow−0.47;
n=253; r2=0.88; sy/x=0.54) (Fig. 4), resulted in a high standard error of estimate of Ksw(sy/x).
This relationship extends the conclusions of Smedes et al. [10] for differences of sorption between SRs to compounds other than PAHs and PCBs. However, we restrict these conclusions to “Manufactured SRs” (i.e. polymerized by manufacturers), given the very large differences observed with “Polymerized SR kits”. A better standard error of the estimate of
the SRs used, and by plotting data for compounds with closely similar molecular structures.
Other predictive models for Ksw have also been developed on PDMS fiber (SPME) data, such
as multiparameter linear solvation energy relationships (LSER) [31]. However, they have not been validated on SR, and require physiochemical parameters that are not readily available.
4. Conclusion
The selection procedure used in this study discriminated seven SRs from various suppliers for the extraction of pesticides in water. We found very large differences in affinity for pesticides between “Polymerized SR kits” and “Manufactured SRs”, never demonstrated before. These differences were linked to the broad diversity of the SR formulations studied.
Accordingly, partition coefficients (Ksw) of 21 pesticides were determined with SL to fill a
gap in the literature for hydrophilic to moderately hydrophobic compounds
(1.5<log Kow<5.5). Log Ksw from this study and data from the literature plotted against
log Kow, showed satisfactory linear correlation for the prediction of Ksw for non-studied
compounds, with an error in the estimate of 0.54 log units. Finally, given sorption properties, literature data and other economic and technical factors, we suggest using SRs from
Goodfellow (SL) in future work to reduce variability of Ksw values in the literature. We hope
that the use of SR, as an extracting material for a wide range of organic compounds, and especially as a passive sampler, will thereby be simplified.
Acknowledgments
The authors thank G. Raffin and M. Hangouët (ISA, UMR 5280) for TGA analysis and interpretation, and C. Guillemain (Irstea) for analytical support. This work was funded by the French National Agency for Water and Aquatic Environments (ONEMA) and the French National Research Agency (ANR) through the PoToMAC project (ANR 2011 CESA 022 02). We thank ATT for English language editing.
References
[1] J. Pawliszyn, Solid Phase Microextraction, Theory and Practice, 1997.
[2] E. Baltussen, P. Sandra, F. David, C. Cramers, Stir bar sorptive extraction (SBSE), a novel extraction technique for aqueous samples: Theory and principles, Journal of Microcolumn Separations, 11 (1999) 737-747.
[3] M. van Pinxteren, A. Paschke, P. Popp, Silicone rod and silicone tube sorptive extraction, Journal of chromatography. A, 1217 (2010) 2589-2598.
[4] M. Schellin, P. Popp, Application of a polysiloxane-based extraction method combined with large volume injection-gas chromatography-mass spectrometry of organic compounds in water samples, Journal of chromatography. A, 1152 (2007) 175-183.
[5] B. Vrana, P. Popp, A. Paschke, G. Schuurmann, Membrane-enclosed sorptive coating. an integrative passive sampler for monitoring organic contaminants in water, Anal Chem, 73 (2001) 5191-5200.
[6] A. Assoumani, C. Margoum, S. Chataing, C. Guillemain, M. Coquery, Use of passive stir bar sorptive extraction as a simple integrative sampling technique of pesticides in freshwaters: determination of sampling rates and lag-phases, Journal of chromatography. A, 1333 (2014) 1-8.
[7] E.S. Emelogu, P. Pollard, C.D. Robinson, L. Webster, C. McKenzie, F. Napier, L. Steven, C.F. Moffat, Identification of selected organic contaminants in streams associated with agricultural activities and comparison between autosampling and silicone rubber passive sampling, Science of the Total Environment, 445 (2013) 261-272.
[8] F. Smedes, K. Booij, Guidelines for passive sampling of hydrophobic contaminants in water using silicone rubber samplers, ICES Techniques in marine environmental science, 2012, pp. 20. https://www.muni.cz/research/publications/1081835
[9] A. Prieto, O. Basauri, R. Rodil, A. Usobiaga, L.A. Fernandez, N. Etxebarria, O. Zuloaga, Stir-bar sorptive extraction: A view on method optimisation, novel applications, limitations and potential solutions, Journal of chromatography. A, 1217 (2010) 2642-2666.
[10] F. Smedes, R.W. Geertsma, T. van der Zande, K. Booij, Polymer-water partition
coefficients of hydrophobic compounds for passive sampling: application of cosolvent models for validation, Environ Sci Technol, 43 (2009) 7047-7054.
[11] T.P. Rusina, F. Smedes, J. Klanova, K. Booij, I. Holoubek, Polymer selection for passive sampling: a comparison of critical properties, Chemosphere, 68 (2007) 1344-1351.
[12] J.R. White, S.K. De, J.R. White, K. Naskar, Rubber technologist's handbook, Smithers Rapra Technology2009.
[13] E.D. Lipp, A. Lee Smith, The Analytical Chemistry of Silicones, John Wiley & Sons1991.
[14] T.L. ter Laak, F.J. Busser, J.L. Hermens, Poly(dimethylsiloxane) as passive sampler material for hydrophobic chemicals: effect of chemical properties and sampler characteristics on partitioning and equilibration times, Anal Chem, 80 (2008) 3859-3866.
[15] K. Yates, I. Davies, L. Webster, P. Pollard, L. Lawton, C. Moffat, Passive sampling: partition coefficients for a silicone rubber reference phase, Journal of environmental monitoring : JEM, 9 (2007) 1116-1121.
[16] A. Garcia, M. Iriarte, C. Uriarte, A. Etxeberria, Study of the relationship between transport properties and free volume based in polyamide blends, Journal of Membrane Science, 284 (2006) 173-179.
[17] A. Assoumani, C. Margoum, Y. Lassalle, B. Herbreteau, K. Faure, M. Coquery, J. Randon, Polydimethylsiloxane Rods for the Passive Sampling of Pesticides in Surface Waters, Water, 5 (2013) 1366-1379.
[18] C. Margoum, C. Guillemain, X. Yang, M. Coquery, Stir bar sorptive extraction coupled to liquid chromatography-tandem mass spectrometry for the determination of pesticides in water samples: method validation and measurement uncertainty, Talanta, 116 (2013) 1-7. [19] C.A. Cantrell, Technical Note: Review of methods for linear least-squares fitting of data and application to atmospheric chemistry problems, Atmospheric Chemistry and Physics, 8 (2008) 5477-5487.
[20] A. Assoumani, C. Margoum, C. Guillemain, M. Coquery, Use of experimental designs for the optimization of stir bar sorptive extraction coupled to GC-MS/MS and comprehensive validation for the quantification of pesticides in freshwaters, Anal Bioanal Chem, 406 (2014) 2559-2570.
[21] S. Hamdani, C. Longuet, D. Perrin, J.-M. Lopez-cuesta, F. Ganachaud, Flame retardancy of silicone-based materials, Polymer Degradation and Stability, 94 (2009) 465-495.
[22] E.D. Lykissa, S.V. Kala, J.B. Hurley, R.M. Lebovitz, Release of low molecular weight silicones and platinum from silicone breast implants, Analytical Chemistry, 69 (1997) 4912-4916.
[23] A. Paschke, K. Schwab, J. Brummer, G. Schuurmann, H. Paschke, P. Popp, Rapid semi-continuous calibration and field test of membrane-enclosed silicone collector as passive water sampler, Journal of chromatography. A, 1124 (2006) 187-195.
[24] S.K. Parida, S. Dash, S. Patel, B.K. Mishra, Adsorption of organic molecules on silica surface, Advances in Colloid and Interface Science, 121 (2006) 77-110.
[25] J.H. Kwon, T. Wuethrich, P. Mayer, B.I. Escher, Dynamic permeation method to determine partition coefficients of highly hydrophobic chemicals between
poly(dimethylsiloxane) and water, Analytical Chemistry, 79 (2007) 6816-6822.
[26] T.P. Rusina, F. Smedes, M. Koblizkova, J. Klanova, Calibration of silicone rubber passive samplers: experimental and modeled relations between sampling rate and compound properties, Environ Sci Technol, 44 (2010) 362-367.
[27] A. Paschke, J. Brummer, G. Schuurmann, Silicone rod extraction of pharmaceuticals from water, Anal Bioanal Chem, 387 (2007) 1417-1421.
[28] J.A. Magner, T.E. Alsberg, D. Broman, Evaluation of poly(ethylene-co-ninyl acetate-co-carbon monoxide) and polydimethylsiloxane for equilibrium sampling of polar organic contaminants in water, Environmental Toxicology and Chemistry, 28 (2009) 1874-1880. [29] R.M. Heltsley, Novel methods for monitoring chlorinated contaminants in aquatic environments, Department of environmental and molecular toxicology, Graduate Faculty of North Carolina State University, 2004, pp. 153.
http://repository.lib.ncsu.edu/ir/handle/1840.16/4608
[30] L. Ahrens, A. Daneshvar, A.E. Lau, J. Kreuger, Characterization of five passive
sampling devices for monitoring of pesticides in water, Journal of Chromatography A, 1405 (2015) 1-11.
[31] L. Sprunger, A. Proctor, W.E. Acree, Jr., M.H. Abraham, Characterization of the sorption of gaseous and organic solutes onto polydimethyl siloxane solid-phase
microextraction surfaces using the Abraham model, Journal of chromatography. A, 1175 (2007) 162-173.
SI-1. Percentage of pesticide recovered with first solvent back-extraction step over four cumulated steps with SL in kinetic experiment (24 h) with standard deviation (n = 3).
SI-2. Pesticide parameters for UHPLC-MS/MS analysis. Pesticide Abbre- viation Quantification transition (m/z) Declustering potential (V) Collision energy (V) Collision exit potential (V) Acetochlor ATC 269.9>224.2; 269.9>148.1 31 31 15 27 16 14 Atrazine ATZ 215.9>174.1; 215.9>104.1 66 66 25 41 16 8 Azoxystrobin AZS 404>372; 404>344 61 61 33 35 26 28 Carbendazim CBZ 192>160; 192>132 56 56 25 41 16 24 Chlorfenvinphos CFV 359>155; 359>99 76 76 17 43 20 8 Chlorpiryphos-ethyl CPE 352>200; 350>97 45 61 30 55 38 4 Chlorpiryphos-methyl CPM 322>125; 322>290 71 71 29 23 22 54 Chlortoluron CTU 213>72; 213>140 51 51 25 37 12 6 3,4-Dichloroaniline DCA 162>127; 162>74 51 51 31 73 24 14 3-(3,4-Dichlorophenyl)-1-methylurea DCPM U 219>162; 219>127 66 66 21 37 26 22 Diflufenican DFF 395>266; 395>246 86 86 35 47 28 40 Diuron DIU 233>72; 233>46 46 46 51 37 6 8 Diuron-d6 DIU-d6 239>78; 233>52 66 66 43 37 14 10 Dimethomorph DMM 388>301; 388>165 76 76 31 43 36 28 Flazasulfuron FLZ 408>182; 408>227 81 81 59 57 34 14 Fenitrothion FNT 278>125; 278>109 71 71 29 25 22 16 Isoproturon IPU 207>72; 207>165 51 51 37 19 8 28 Linuron LINU 249>160; 249>182 61 61 25 19 32 12 Metolachlor MTC 284.1>252.2; 284.1>176.2 46 46 21 37 20 4 Norflurazon NFZ 304>284; 304>88 101 101 35 61 26 16 Procymidon PCM 284>256 76 25 46 Simazine SMZ 202.1>132.2; 202.1>124.1 56 56 29 27 10 10 Spiroxamine SPX 298>144; 298>100 51 51 31 45 8 18 Tebuconazole TBZ 308>70; 308>125 76 76 51 57 12 12
SI-3. Attenuated Total Reflection Fourier Transform Infrared Spectroscopy
(ATR-FTIR) spectrum of silicone rubbers (SRs) studied and interpretation (color printing).
Chemical organic groups of the SR backbone were studied by interpreting ATR-FTIR
spectra for each SR. The characteristic band for symmetrical CH3 deformation occurs at 1260
cm-1 (with one or more in the range 865–750 cm-1) and with CH stretching absorption around
2910 and 2970 cm-1 for all the SRs, confirming methyl groups are the main components
identified in PDMS chains of SRs (Lipp and Lee Smith, 1991; Launer, 2013). Although infrared spectra are largely similar between SRs, there are some differences. For example,
when the characteristic weak band of dimethyl units shifts from 860 cm-1 to 845 cm-1, as
observed for SY and UV, units on siloxane chains are random or alternating, and not block (Launer, 2013). We also observe a broader and more complex Si-O-Si absorption (1130–1000
cm-1), showing two overlapping bands, especially for SB, SY and UV, which highlights
longer or more branched siloxane chains. Hence SY, SB and UV have more complex internal networks of PDMS chains than other SRs. In addition, for SY and UV SRs, a weak band in
the range 2100−2300 cm-1
and at 910 cm-1 confirm a residual content of reactive Si-H groups
for raw materials, confirming a non-stoichiometric ratio for the curing process by hydrosilylation. No other functional groups such as phenyl or vinyl are clearly identified with this analytical technique.
References
[1] P.J. Launer, Silicon Compounds: Silanes & Silicones, Infrared Analysis of
organosilico compounds: Spectra-structure correlations, Gelest, Inc Morrisville, PA, 2013.
[2] E.D. Lipp, A. Lee Smith, The Analytical Chemistry of Silicones, John Wiley & Sons,
SI-4. Thermal gravimetric analysis (TGA) of silicone rubbers SY and SL for raw and conditioned materials (CC: chemical conditioning and TC: thermal conditioning)
The degradation temperatures of the two raw SRs from “Polymerized kit” and “Manufactured” materials (SY and SL) were determined by TGA analysis. A first weight loss of 0.05% was recorded at 89 °C for SY and 223 °C for SL. The very large difference underlines differences in SR formulation, and suggests a higher content of oligomers in SY than in SL. Complementary TGA analysis on conditioned SL shows that the thermal conditioning step increases the temperature of the first weight loss (0.05%) from 223 °C to 360 °C. This finding suggests that oligomers are released before the thermal degradation of the material. It also highlights the reliability of conditioning steps for the elimination of residual oligomers in raw SR.
SY raw SL raw SL CC SL TC SL CC+TC 88 90 92 94 96 98 100 102 Weight (%) 0 50 100 150 200 250 300 350 400 450 500 550 Temperature (°C) SY raw 99.95% at 89.39°C – – – – SL raw 99.95% at 222.70°C ––– ––– SL CC 99.95% at 269.73°C ––––– – SL TC 99.95% at 361.95°C ––––––– SL CC+TC 99.95% at 360.90°C – – – – Universal V4.7B TA Instruments
SI-5. Final percentage residue by thermal gravimetric analysis (TGA) of silicone rubbers under nitrogen and air at 800 °C (isothermal temperature for 30 min)
SR Residue under nitrogen (%) Residue under air (%) Nitrogen/ air ratio SY 51.0 57.6 0.89 UV 60.4 67.1 0.90 SB 17.3 34.6 0.50 TW 32.5 42.7 0.76 AL 31.0 40.9 0.76 SL 35.5 47.2 0.75 ST 76.3 71.0 1.07
SI-6. Scan chromatograms of two blanks of raw (a) and conditioned (b) silicone rubber (SL) by TD-GC-Fullscan analysis (TD: 300 °C, 15 min,
SI-7. Sorption isotherms of 21 pesticides for SL silicone rubber with linear (WY linear) and Freundlich (WY Freundlich) regression by the Williamson-York bivariate method and least square linear regression (LS linear). Confidence interval (95%, n = 3)