HAL Id: hal-01200730
https://hal.archives-ouvertes.fr/hal-01200730
Submitted on 5 Oct 2015
HAL is a multi-disciplinary open access
archive for the deposit and dissemination of
sci-entific research documents, whether they are
pub-lished or not. The documents may come from
L’archive ouverte pluridisciplinaire HAL, est
destinée au dépôt et à la diffusion de documents
scientifiques de niveau recherche, publiés ou non,
émanant des établissements d’enseignement et de
Continuous Arousal Self-assessments Validation Using
Real-time Physiological Responses
Ting Li, Yoann Baveye, Christel Chamaret, Emmanuel Dellandréa, Liming
Chen
To cite this version:
Ting Li, Yoann Baveye, Christel Chamaret, Emmanuel Dellandréa, Liming Chen. Continuous Arousal
Self-assessments Validation Using Real-time Physiological Responses. International Workshop on
Af-fect and Sentiment in Multimedia (ASM), Oct 2015, Brisbane, Australia. �10.1145/2813524.2813527�.
�hal-01200730�
Continuous Arousal Self-assessments Validation
Using Real-time Physiological Responses
Ting Li
1, Yoann Baveye
12, Christel Chamaret
1,
Emmanuel Dellandr´
ea
2, Liming Chen
2 1Technicolor, 975, avenue des Champs Blancs,
35576 Cesson S´
evign´
e, France
2
Universit´
e de Lyon, CNRS, Ecole Centrale de Lyon,
LIRIS, UMR5205, F-69134, Lyon, France
{ting.li, yoann.baveye, christel.chamaret}@technicolor.com
{emmanuel.dellandrea, liming.chen}@ec-lyon.fr
Abstract
On one hand, the fact that Galvanic Skin Response (GSR) is highly correlated with the user affective arousal provides the possibility to apply GSR in emotion detection. On the other hand, temporal correlation of real-time GSR and self-assessment of arousal has not been well studied. This paper confronts two modalities representing the induced emotion when watching 30 movies extracted from the LIRIS-ACCEDE database. While continuous arousal annotations have been self-assessed by 5 participants using a joystick, real-time GSR signal of 13 other subjects is supposed to catch user emotional response, objectively without user’s interpretation. As a main contribution, this paper introduces a method to make possible the temporal comparison of both signals. Thus, temporal correlation between continuous arousal peaks and GSR were calculated for all 30 movies. A global Pearson’s correlation of 0.264 and a Spearman’s rank correlation coefficient of 0.336 were achieved. This result proves the validity of using both signals to measure arousal and draws a reliable framework for the analysis of such signals.
1
Introduction
Affective computing has drawn much attention from researchers in the past years since the emotional analysis may have many potential applications, e.g., human-computer interaction [2], multimedia tagging, retrieval or recommendation system [9]. The goal of affective computing is to enable the computer to identify human emotional states and make use of these emotional status to make decisions for
both affect detection and emotion prediction [2, 14]. Proposed emotional analysis methods vary from content-based analysis, facial expression and body language analysis to physiological-based systems or multimodal systems [5, 13].
Previous studies have confirmed that physiological signals are competitive to analyze emotion with content-based methods or expression and gestures analysis [18]. Indeed, many physiological signals are known to be correlated with the emotional state, such as the electroencephalogram, the heart rate variability, or the Galvanic Skin Response (GSR) [14, 18]. However, collecting physiological signals is often obtrusive. Some are easier to measure, less obtrusive and thus more appropriate for experiments dealing with a large number of participants. GSR, also known as the electrodermal activity which measures the variations in the electrical characteristics of the skin according to fluctuations of state of the sweat glands. It can be measured in a non-obtrusive way thanks to compact sensors, and is known to be related to the level of arousal [15, 17]. For these reasons, we also measure in this paper the GSR of participants watching a set of 30 movies extracted from the LIRIS-ACCEDE dataset [1]. Released publicly, this new modality will enrich the existing dataset and offer new possibilities to the users.
Correlation between GSR and arousal has been demonstrated in several studies. However, to the best of our knowledge, previous studies mainly focused on the analysis of discrete correlations [3, 17]. In other words, correlation between GSR with induced emotional arousal has not been studied in the temporal aspect, especially for subject-independent video analysis. In this paper, we present two distinct experimental protocols for capturing GSR from 13 participants, and continuous arousal annotations from 5 other subjects, watching 30 chosen movies from LIRIS-ACCEDE. These two modalities are analyzed temporally in order to confirm a relation between the continuous arousal annotations and the user physiological responses for 30 movies.
The paper is organized as follows. A brief overview of related work is given in Section 2. Section 3 provides the whole procedure of experiments from chosen emotion stimuli presentation to GSR collection process. The methodology of analysis including the post-processing algorithm and correlation calculation is described in Section 4. In section 5, the experimental results are presented. Finally, a conclusion and future work end the paper in Section 6.
2
Previous work
Previous work on correlation between emotion and physiological signals mainly deals with emotional categories recognition [16, 17], and the relation of emotional dimensions like arousal, valence and dominance with peripheral signals [12, 15]. When emotions are elicited by both visual and auditory stimuli, fusion of a few kinds of signals and multimodal system have been applied the most in previous research. Among these signals, GSR is always considered as a reliable measure of arousal state.
[15]. They analyzed relations between several physiological signals with arousal and valence self-assessments from users watching pictures. They computed the subject-dependent correlation and came up with a positive correlation between skin conductance magnitude and arousal ratings. More recent works started to conduct this research to videos and studied the possibility to apply subjects’ reactions for video analysis. However, quantitative analysis especially in temporal aspect is still a problem. Fleureau et al. confirmed the application of GSR to affective events detection and affective benchmarking of movies [9, 10]. They qualitatively analyze the efficiency of the GSR to discriminate the affective audience response for specific movie scenes. Soleymani et al. achieved the affective characterization of height scenes from height movies with linear combination of physiological signal features [17]. For one subject, a feature extracted from his GSR signal had the best correlation with discrete arousal annotations (one arousal annotation for one scene). Canini et al investigated the relationship between arousal self-assessments with GSR features for four specific short movie clips [3]. Several participants annotated each movie excerpt of about two minutes with one discrete arousal annotation. For each movie, they showed a strong positive subject-dependent correlation. For music, Coutinho et al have shown that adding continuous skin conductance measurements improves automatic prediction of emotions perceived in music [6, 7].
These previous studies inspiring our approach, we propose a framework for the analysis of temporal correlation.
3
Experiments
Two distinct experiments were conducted to collect signals from participant watching a set of videos. A first experiment is dedicated to the collection of continuous arousal self-assessments from annotators, while the goal of the second experiment is to record physiological signals from audience members. They are named as continuous arousal annotations and physiological or GSR signals, respectively.
3.1
Stimuli Selection
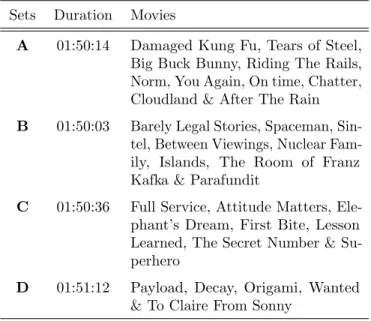
LIRIS-ACCEDE is a video database for affective video analysis composed of 9800 excerpts extracted from 160 movies shared under Creative Commons licenses [1]. The 160 movies are both professionally made or amateur movies that are indexed on video platforms referencing best free-to-share movies. The strength of this dataset is the public availability of its video material, allowing researchers to easily select emotional stimuli. In this work, 30 full-length movies out of the 160 movies composing the LIRIS-ACCEDE dataset have been chosen. To select movies as representative as possible of the original dataset, the 30 movies cover 6 different genres and 5 languages. The total duration of the movies is 7 hours 22 minutes 5 seconds, smaller than eight hours to create an experiment of acceptable duration. More precisely, the duration of the movies varies from
Table 1: List of the 30 movies on which continuous annotations have been collected
Sets Duration Movies
A 01:50:14 Damaged Kung Fu, Tears of Steel, Big Buck Bunny, Riding The Rails, Norm, You Again, On time, Chatter, Cloudland & After The Rain B 01:50:03 Barely Legal Stories, Spaceman,
Sin-tel, Between Viewings, Nuclear Fam-ily, Islands, The Room of Franz Kafka & Parafundit
C 01:50:36 Full Service, Attitude Matters, Ele-phant’s Dream, First Bite, Lesson Learned, The Secret Number & Su-perhero
D 01:51:12 Payload, Decay, Origami, Wanted & To Claire From Sonny
117 to 4566 seconds (mean = 884sec ± 766sec SD). Selected movies are listed in Table 1. Their credits and license information are available at: http://liris-accede.ec-lyon.fr/database.php. The movies are organized into four sets with similar durations used by both experiments described in the following sections.
3.2
Continuous Arousal Annotation
In order to collect continuous arousal annotations, 10 French participants (7 female and 3 male) had to continuously indicate their level of arousal while watching the movies using a modified version of the GTrace annotation tool [8] and a joystick. Each annotator continuously annotated two sets from the four available sets detailed in Table 1 along the induced arousal dimension. Thus, each movie has been continuously annotated by five annotators.
Then, the continuous arousal annotations from the participants have been down-sampled by averaging the annotations over windows of 10 seconds with 1 second overlap (i.e. 1 value per second) in order to remove the noise due to unintended moves of the joystick. Finally, these post-processed continuous arousal annotations have been averaged in order to create a signal, we will refer to as the “continuous mean of the arousal self-assessments” in the following sections.
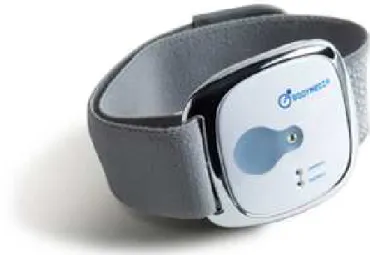
Figure 1: The Bodymedia armband used to record the GSR of participants (illustration from http://www.bodymedia.com/)
3.3
Physiological Signal Collection
The goal of this second experiment is to record physiological signals, in partic-ular the GSR, from audience members who have not participated in the first experiment.
To measure the GSR, we used the Bodymedia armband illustrated in Figure 1. We used this armband because it is user friendly, thus users rapidly understand how to wear the armband by themselves before the experiments. Users only have to place the armband on their fingers. In contact with the palm area, the armband turns on automatically and starts recording the GSR of the participants. This device allowed us to record, in addition to the GSR, the motion of the fingers and skin temperature. However these two supplementary measures are not analyzed in the remaining of this paper.
Physiological signals were collected from 13 French paid participants (11 female and 2 male) ranging in age from 22 to 45 years (mean = 36.1 ± 6.7 SD). The experiment was divided into four sessions using the sets described in Table 1. Each session took place on a different half-day to reduce the cognitive load of the participants, and lasted approximately two hours, including the setup of the armbands. Before the first session, participants had to sign a consent form. They were informed that the device used to record the signals was perfectly safe and that their anonymity would be protected.
The physiological signals were recorded simultaneously from the 13 partici-pants watching the videos in a darkened air-conditioned amphitheater. They were free to select their own position in the room. Before the first session, an armband sensor was placed on the tops of two of their fingers. Instructions were given so that participants could setup the device by themselves at the beginning
of the three last sessions.
4
Correlation Analysis
As pointed out by Fleureau et al. [10], the GSR signal must be processed to remove the misleading information before being compared to the continuous arousal annotations.
4.1
Post-processing of raw GSR Signals
To process the GSR signals from the 13 participants and for the 30 movies, we used the algorithm described in [10] with minor changes:
1. First, for a given participant and a given movie, a low-pass filtering is applied (Finite Impulse Response filter with a 2Hz cutoff frequency) to remove misleading information and the signal is derived.
2. As in [10], a thresholding is computed in order to remove the negative values of the derivative of the signal and to focus only on the positive seg-ments. Indeed, positive values embody the increase of the skin conductance measured due to an increase of sweating, usually related to highly-arousing emotions [4].
3. The signal is temporally filtered and sub-sampled using a 10 seconds time window with 5 seconds overlap to obtain a time resolution of 5 seconds. The time resolution is similar to previous studies [9] and smaller than the one used in [10] to make it compliant with the shorter duration of the movies used in this experiment.
4. Finally, the signal is normalized to remove the user-dependent part related to the amplitude of the derivative of the GSR.
Using the same terminology as Fleureau et al. [10], the resulting signal for each user i, 1 ≤ i ≤ N (with N = 13, the number of participants), is called individual GSR profile and termed pin. As in [10], n in pin stands for
“normalized”.
4.2
Weighted Mean GSR Profile
Once the raw signals are post-processed, outliers can be detected more easily. There are several factors that could have affected the reliability of the signals measured with the armbands. Indeed, an experimenter checked if the armbands were correctly set up on the fingers at the beginning of each session. However, it is possible that during the sessions some participants moved their armband, although participants were instructed not to touch or interact with the device. Some signals may also be too noisy due to repeated moves of the hand on which
the armband was fastened. For example, it is tempting for a participant to check his smartphone and reply to a text message if the movie is boring.
For each movie, the Spearman’s rank correlation coefficient (SRCC) ρij
between the individual GSR profiles pin and pjn of two users are computed. The
agreement αi of an annotator i for a single movie is defined as:
αi= 1 N − 1 N X j=1,j6=i ρij (1)
A participant i is considered as an outlier if its agreement αi is smaller than
µa−12σa, with µa and σa respectively the mean and standard deviation of the
SRCCs between each of the participants and all the other participants, i.e.:
µa= 1 N (N − 1) N X i=1 N X j=1,j6=i ρij (2) σa= v u u u t 1 N (N − 1) N X i=1 N X j=1,j6=i ρ2 ij − µ2a (3)
In average, 4 participants are discarded per movie. As mentioned by Grimm and Kroschel [11], as the remaining noise influences might be different for the different participants, it is reasonable to compute the mean GSR signal using an individual confidence score. Finally, the weighted mean GSR profile ˆpn for a
movie is thus defined as:
ˆ pn= 1 P i∈V ci X i∈V cipin ! (4)
with V the set of the participants that are not considered as outliers, Nv the
number of participants in V , and ci the confidence score generated similarly
to [11] by computing the Pearson’s correlation between the individual affective profile pi
n, and the mean GSR profile ¯pn= N1
v
P
i∈V
pi n.
4.3
Finding Continuous Arousal Peaks
Based on the intuition that the weighted mean GSR profile, generated using the derivative of the GSR measurements, should be temporally correlated with the increase or decrease of arousal, we first computed the temporal correlation between the weighted mean GSR profile and the mean of the continuous arousal annotations described in Section 3. However, results were not as good as expected since the mean between these Pearson’s correlations for the 30 movies is low (r = 0.070). By introducing a threshold to compute these correlations only for the most intense parts of the movies, we show in this section that for most of the
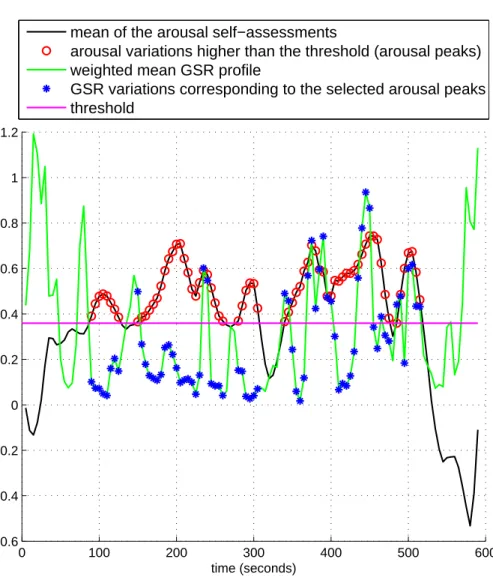
0 100 200 300 400 500 600 −0.6 −0.4 −0.2 0 0.2 0.4 0.6 0.8 1 1.2 time (seconds)
mean of the arousal self−assessments
arousal variations higher than the threshold (arousal peaks) weighted mean GSR profile
GSR variations corresponding to the selected arousal peaks threshold
Figure 2: Example of the computation of arousal peaks from the mean arousal self-assessments for the movie Big Buck Bunny
movies, the weighted mean GSR profile is in fact correlated with the continuous arousal annotations during the most arousing scenes.
The most intense parts of a movie, called “arousal peaks”, are defined as the highest scores of the mean continuous arousal annotations with respect to a threshold T . T is the percentage of the smallest values to be removed from the process.
4.4
Correlation Calculation
The continuous mean of the arousal self-assessments of the 30 movies have been sub-sampled using an overlapping time window to match the time resolution of 5 seconds of the weighted mean GSR profile ˆpn. Figure 2 shows the arousal peaks
(red circles) for the movie Big Buck Bunny for T = 40%, i.e. 60% of the greatest values have been kept. The blue stars indicate the scores of the weighted mean GSR profile corresponding to the arousal peaks for T = 40%.
The Pearson’s correlation between the continuous mean of the arousal self-assessments and the weighted mean GSR profile ˆpnfor a given movie k, 1 ≤ k ≤
30, and for a given threshold T is termed rk T.
5
Validation
5.1
Quantitative and Qualitative Evaluation
Table 2 shows, for each movie, the threshold Tmax (in %) maximizing the
Pearson’s r correlation between the arousal peaks and the corresponding values from the weighted mean GSR profile ˆpn. Table 2 also indicates the significance of
the correlation according to the t-test, with t = rq1−rn−22 where n is the number
of samples used to compute the correlation coefficient r. The SRCC for each selected Tmax is also indicated. 18 movies, i.e., 60% of the movies, share a
Pearson’s r higher than 0.25, but this correlation is significant for 14 of them. In terms of SRCC, the correlation of 18 movies exceeds 0.25 with an associated p-value below 0.05.
More globally, the weighted average ˆrT
max of the Pearson’s correlations is
computed: ˆ rTmax = 1 30 P k=1 lk Tmax 30 X k=1 lkTmaxr k Tmax ! (5)
with rkTmax the Pearson’s correlation between the arousal peaks for T = Tmax
and the corresponding values from the weighted mean GSR profile of the kth
movie, and lk the number of values in the arousal peaks of the kth movie for
T = Tmax.
The average weighted Pearson’s correlation ˆrT
maxequals 0.264 and the average
weighted SRCC, generated in the same way using the SRCC values for each movie, is equal to 0.336. These correlations confirm that arousal and GSR are
Table 2: Pearson’s r and SRCC between the arousal peaks for T = Tmaxand the
corresponding values from weighted mean GSR profile for the 30 movies used in the experiment. Significant correlations (p < 0.05) according to the t-test are indicated by stars.
Movie Tmax r SRCC
Damaged Kung-Fu 88% 0.364∗ 0.435∗ Big Buck Bunny 66% 0.552∗ 0.643∗
Chatter 64% 0.416∗ 0.537∗ Cloudland 36% 0.032 0.081 After The Rain 86% 0.236 0.272
Norm 24% 0.214 0.314∗
On Time 84% 0.626∗ 0.705∗ Islands 50% 0.094 0.323 Tears of Steel 42% 0.389∗ 0.459∗
You Again 10% 0.231∗ 0.188∗ Barely Legal Stories 70% 0.183 0.291∗ Between Viewings 84% 0.516∗ 0.466∗ Riding the Rails 84% 0.542∗ 0.653∗ Nuclear Family 88% 0.513∗ 0.357∗ Parafundit 88% 0.350 0.361
Sintel 88% 0.252∗ 0.284∗ Lesson Learned 90% 0.754∗ 0.461∗ The Room of Franz Kafka 34% 0.149 -0.240 Attitude Matters 76% 0.262 0.490∗ Elephants Dream 18% 0.238∗ 0.141∗ First Bite 84% 0.349 0.333 Full Service 74% 0.293∗ 0.399∗ Spaceman 0% -0.026 0.061 Superhero 38% 0.446∗ 0.472∗ The Secret Number 88% 0.359∗ 0.318
To Claire From Sonny 0% 0.183∗ 0.282∗ Origami 22% 0.143 0.008
Payload 0% 0.002 0.064
Decay 0% 0.341∗ 0.441∗
(a) Cloudland (b) Origami
(c) Payload (d) The Room of Franz Kafka
(e) Spaceman
Figure 3: Representative screenshots for the 5 movies for which the weighted mean GSR profile is not correlated with the arousal peaks.
correlated, but foremost validate the reliability of both the continuous arousal annotations and GSR measurements.
However, 5 movies in particular show low correlation values that are not significant in terms of both Pearson’s r and SRCC. These movies are: Cloudland, Origami, Payload, The Room of Franz Kafka, and Spaceman. Representative screenshots for these movies are shown in Figure 3. This lack of correlation could be in part due either to the quality of the movie (e.g., Cloudland is a concatenation of short scenes without any direct link between each other), or to their movie style (e.g., The Room of Franz Kafka is a short abstract experimental film, Origami is an animation movie with a design inspired by traditional Japanese art, and Payload and Spaceman are science fiction movies). Based on these observations, it seems reasonable to assume that two factors can make uncomfortable the observers: a non-conventional storytelling, such as for Cloudland and a art or abstract style, such as for the other one. Indeed, such media may produce different physiological responses depending on the experimenters’ sensitivity.
Nonetheless, a significant correlation between the continuous arousal anno-tations and GSR measurements has been demonstrated. The strength of this finding lies in the cross-validation of two modalities temporally collected in two distinct experimental protocols. Thus, a temporal correlation is demonstrated between the average of continuous arousal annotations and the average of post-processed GSR measurements from different participants watching videos and collected in two different experiments.
5.2
The Effect of the Threshold
The average weighted Pearson’s correlation ˆrT
max, computed in the previous
section, has been generated using the threshold Tmax which is thus different
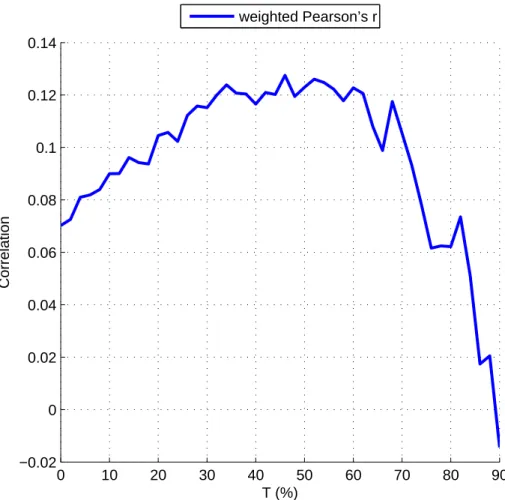
among movies. However, it is possible to analyze the effect of this threshold on the global average weighted correlation by using the same threshold T for all the movies. Figure 4 shows the variation of the weighted Pearson’s r with respect to the threshold T when T is identical for the 30 movies. Surprisingly, the variation is very smooth. We assumed that the correlation would have increased with the threshold T but in fact this statement is true only for T < 46%. Actually, a global maximum (r = 0.128) is achieved for T = 46%, then for T > 60% the global weighted correlation starts decreasing rapidly. It seems to indicate that the values near the most intense arousal peaks are essential to find a correlation between arousal and GSR measurements and that the smallest arousal values may not be correlated with GSR measurements. This sounds reasonable since for movie scenes inducing low arousal, the constant (or lack of) sweat is not a good indicator of the level of arousal experienced by the participant.
6
Conclusions
In this paper, we have presented a framework for the confrontation of continuous arousal annotations based on self-assessments and audience members’ real-time GSR signals. 30 movies from LIRIS-ACCEDE were chosen in the experiments for which GSR signals from 13 participants and continuous arousal annotations noted by different 5 subjects were collected in two distinct experiments. It provides two modalities representing induced arousal when watching movies and ensures the calculation of correlation to be subject-independent. A classical post-processing algorithm was applied to raw GSR signals to obtain the time-variant GSR signals and for each movie, a weighted mean GSR profile that denotes the global audience response was calculated after abandoning detected outliers. Then a correlation calculation method taking into account arousal peaks and relevant user response signals was proposed. Temporal correlations are found between arousal peaks and weighted mean GSR profile for most movies, and a global Pearson correlation of 0.264 and SRCC of 0.336 are also achieved. To the best of our knowledge, in regard to emotional analysis of videos, our research is the first to tackle the temporal dimension.
Temporal correlation between GSR and continuous arousal annotations has been achieved in this paper, but other relevant signals have not been adopted. Since continuous valence annotations for the 30 movies are also provided, their temporal relationship with other related physiological signals could be investigated in future work.
0 10 20 30 40 50 60 70 80 90 −0.02 0 0.02 0.04 0.06 0.08 0.1 0.12 0.14 T (%) Correlation weighted Pearson’s r
Figure 4: Evolution of the average weighted Pearson’s r with respect to the selected threshold T for the 30 movies
7
Acknowledgments
This work was supported in part by the French research agency ANR through the Visen project within the ERA-NET CHIST-ERA framework under the grant ANR-12-CHRI-0002-04.
References
[1] Y. Baveye, E. Dellandrea, C. Chamaret, and L. Chen. Liris-accede: A video database for affective content analysis. IEEE Transactions on Affective Computing, 6(1):43–55, 2015.
[2] R. Calvo, S. D’Mello, et al. Affect detection: An interdisciplinary review of models, methods, and their applications. IEEE Transactions on Affective Computing, 1(1):18–37, 2010.
[3] L. Canini, S. Gilroy, M. Cavazza, R. Leonardi, and S. Benini. Users’ response to affective film content: A narrative perspective. In 2010 International Workshop on Content-Based Multimedia Indexing (CBMI), pages 1–6. IEEE,
2010.
[4] G. Chanel, K. Ansari-Asl, and T. Pun. Valence-arousal evaluation using physiological signals in an emotion recall paradigm. In IEEE International Conference on Systems, Man and Cybernetics, pages 2662–2667, 2007. [5] G. Chanel, J. Kronegg, D. Grandjean, and T. Pun. Emotion assessment:
Arousal evaluation using eeg’s and peripheral physiological signals. Mul-timedia content representation, classification and security, pages 530–537, 2006.
[6] E. Coutinho and A. Cangelosi. Musical emotions: predicting second-by-second subjective feelings of emotion from low-level psychoacoustic features and physiological measurements. Emotion, 11(4):921, 2011.
[7] E. Coutinho and N. Dibben. Emotions perceived in music and speech: relationships between psychoacoustic features, second-by-second subjec-tive feelings of emotion and physiological responses. In 3rd International Conference on Music & Emotion, 2013.
[8] R. Cowie, M. Sawey, C. Doherty, J. Jaimovich, C. Fyans, and P. Staple-ton. Gtrace: General trace program compatible with emotionml. In 2013 Humaine Association Conference on Affective Computing and Intelligent Interaction (ACII), pages 709–710. IEEE, 2013.
[9] J. Fleureau, P. Guillotel, and Q. Huynh-Thu. Physiological-based affect event detector for entertainment video applications. IEEE Transactions on Affective Computing, 3(3):379–385, July 2012.
[10] J. Fleureau, P. Guillotel, and I. Orlac. Affective benchmarking of movies based on the physiological responses of a real audience. In 2013 Humaine Association Conference on Affective Computing and Intelligent Interaction (ACII), pages 73–78, 2013.
[11] M. Grimm and K. Kroschel. Evaluation of natural emotions using self assess-ment manikins. In 2005 IEEE Workshop on Automatic Speech Recognition and Understanding, pages 381–385. IEEE, 2005.
[12] A. Haag, S. Goronzy, P. Schaich, and J. Williams. Emotion recognition using bio-sensors: First steps towards an automatic system. In ADS, pages 36–48. Springer, 2004.
[13] J. Kim and E. Andr´e. Emotion recognition based on physiological changes in music listening. IEEE Transactions on Pattern Analysis and Machine Intelligence, 30(12):2067–2083, 2008.
[14] S. Koelstra, C. Muhl, M. Soleymani, J.-S. Lee, A. Yazdani, T. Ebrahimi, T. Pun, A. Nijholt, and I. Patras. DEAP: a database for emotion analysis using physiological signals. IEEE Transactions on Affective Computing, 3(1):18–31, Jan. 2012.
[15] P. J. Lang, M. K. Greenwald, M. M. Bradley, and A. O. Hamm. Looking at pictures: affective, facial, visceral, and behavioral reactions. Psychophys-iology, 30(3):261–273, May 1993.
[16] R. W. Picard, E. Vyzas, and J. Healey. Toward machine emotional intel-ligence: Analysis of affective physiological state. IEEE Transactions on Pattern Analysis and Machine Intelligence, 23(10):1175–1191, 2001. [17] M. Soleymani, G. Chanel, J. Kierkels, and T. Pun. Affective characterization
of movie scenes based on multimedia content analysis and user’s physiological emotional responses. In IEEE International Symposium on Multimedia, pages 228–235, Dec. 2008.
[18] F. Zhou, X. Qu, J. R. Jiao, and M. G. Helander. Emotion prediction from physiological signals: A comparison study between visual and auditory elicitors. Interacting with computers, 26(3):285–302, 2014.