HAL Id: cea-02267580
https://hal-cea.archives-ouvertes.fr/cea-02267580
Submitted on 19 Aug 2019
HAL is a multi-disciplinary open access
archive for the deposit and dissemination of sci-entific research documents, whether they are pub-lished or not. The documents may come from teaching and research institutions in France or abroad, or from public or private research centers.
L’archive ouverte pluridisciplinaire HAL, est destinée au dépôt et à la diffusion de documents scientifiques de niveau recherche, publiés ou non, émanant des établissements d’enseignement et de recherche français ou étrangers, des laboratoires publics ou privés.
Americium, curium and neodymium analysis in
ECRIX-H irradiated pellet: sample preparation for
TIMS measurements
Eric Esbelin, E. Buravand, S. Bejaoui, J. Lamontagne, J. Bonnerot
To cite this version:
Eric Esbelin, E. Buravand, S. Bejaoui, J. Lamontagne, J. Bonnerot. Americium, curium and neodymium analysis in ECRIX-H irradiated pellet: sample preparation for TIMS measurements. Ra-diochimica Acta, R Oldenbourg Verlag GMBH, 2013, 101 (5), pp.293-300. �10.1524/ract.2013.2038�. �cea-02267580�
This article is pr otect e d by Ger m an copyri gh t l a w. Yo u may c o py a n d distri bu te t h is a rticle for you r perso nal u se o n ly. O th e r u se is only all o
wed with written
permission by t h e copyri ght h o lder .
Radiochim. Acta 101, 293–300 (2013) / DOI 10.1524/ract.2013.2038 © by Oldenbourg Wissenschaftsverlag, München
Americium, curium and neodymium analysis in ECRIX-H
irradiated pellet: sample preparation for TIMS measurements
By E. Esbelin1,∗, E. Buravand1, S. B´ejaoui2, J. Lamontagne2 and J. M. Bonnerot21
Commissariat à l’ ´Energie Atomique, Centre de Marcoule, 30207, Bagnols-sur-Cèze, France
2 Commissariat à l’ ´Energie Atomique, Centre de Cadarache, 13108 St-Paul-Lez-Durance, France
(Received June 29, 2012; accepted in revised form November 21, 2012) (Published online April 22, 2013)
Americium / Curium / Neodymium / HPLC / Chromatography / Isotopic dilution
Summary. This paper concerns quantitative isotopic analy-sis of Am, Cm and Nd contained in an irradiated AmO1.62/MgO
pellet. The complete analysis protocol is described, from disso-lution of the pellets in a shielded line to the laboratory glove sep-aration processes box for TIMS analysis. Emphasis is placed on the separation processes: by ion exchange resin in a hot cell and by HPLC in the laboratory. Intermediate measurements by X-ray fluorescence, alpha spectrometry, and ICP-AES are described.
1. Introduction
The primary objective of the ECRIX-H experiment was to assess the feasibility of transmuting americium microdis-persed in an inert magnesia matrix (AmO1.62/MgO) in
het-erogeneous mode in a partially moderated neutron flux in the Phenix reactor. Numerous characterizations were achieved on irradiated material by nondestructive measurements (vi-sual inspection, metrology, gamma spectrometry, Eddy cur-rent testing [1–3]), and by destructive measurements (gas analyses, hydrostatic density measurements, scanning elec-tron microscopy (SEM) [3], X-ray diffraction (XRD) [3], secondary ion mass spectroscopy (SIMS) [4], electron probe microanalysis (EPMA) [4]).
Among the destructive measurements, elemental and iso-topic characterization of Am, Cm and Nd in an irradiated ECRIX-H pellet were carried out by the Analysis and Ma-terial Metrology Laboratory (LAMM) in the CEA Atalante complex at Marcoule. This work is the subject of this paper. The LAMM laboratory performs analyses for R&D stud-ies in Atalante, which frequently include high-activity ana-lyses of spent fuel dissolution solutions.
Direct high-activity analyses requiring no sample
prepar-ation but which are subject to uncertainty of up to 30% can be distinguished from indirect analyses after sample treat-ment for much more precise analytical techniques that are not available in a high-activity environment.
Laboratory analysis of the intermediate-level solutions derived from high-level operations depends on the dilution
*Author for correspondence (E-mail: eric.esbelin@cea.fr).
and/or decontamination factor to ensure that the sample ac-tivity and dose rate are compatible with safety standards for glove box work. When the analyte is present at low con-centrations in the dissolution solution, the dilution factor is sometimes such that even the techniques with the lowest de-tection limits are ineffective. Separation techniques are then necessary for selective extraction of the analyte.
This article describes the steps required in the inter-mediate-level laboratory to obtain samples meeting the pre-requisites for TIMS analysis. The results obtained are com-pared with the values calculated from neutronic simulation codes.
2. About neutronic simulations
ECRIX-H neutronic simulations were performed by using GEPHIX and CESAR calculation codes [5] devoted to the management of the PHENIX plant. Complementary simu-lations were also performed using the ERANOS and DAR-WIN codes [6] to obtain a more detailed description of fuel evolution during irradiation, including its composition in terms of helium and fission products.
Pellets on which chemical measurements were per-formed received about 95% of the overall fluence at the maximum flux plane. Based on the neutronic simulations, polynomial and linear interpolations of transmutation and fission rates were determined as a function of the reveived fluence. Using these interpolations, transmutation and fis-sion rates can be extrapolated to account for the fluence at the maximum flux plan. Transmutation rate at the maximum flux plane is estimated to 94.3%.
3. Sample preparation for TIMS analysis
3.1 Experimental
The dissolution solutions were filtered by means of a vac-uum filtration system with 0.5 μm PTFE filters.
Two types of resin were tested:
Biorad AG1X8 with a mean particle size of 74–149μm: about 2.5 mL packed in glass columns (4 mm diameter, 8 cm high) and equilibrated in 8 M nitric acid.
This article is pr otect e d by Ger m an copyri gh t l a w. Yo u may c o py a n d distri bu te t h is a rticle for you r perso nal u se o n ly. O th e r u se is only all o
wed with written
permission by t h e copyri ght h o lder . 294 E. Esbelin et al. Fig. 1. Nuclearized HPLC
system in a glove box.
Eichrom Normal DGA used in pre-packed 2 mL columns with a mean particle size of 50–100μm. Each column was preconditioned with 8 N nitric acid.
Gravity elution was performed with AG1X8 resin. An Is-matec peristaltic pump with a tube diameter suitable for controlling the elution of about 1 mL was used in a shielded cell for separation on Eichrom resin.
Measurements in the hot cell were performed by gamma spectrometry (Canberra) and L-line X-ray fluorescence (LXF). The LXF system is an X-ray fluorescence instrument with a graphite monochromator used as a bandpass filter centered on the energy of the 14.3 keV L-line of Pu.
Separations in the laboratory were carried out on a nu-clearized glove-box HPLC system (Fig.1) composed of an Agilent 1200 series quaternary pump, an Agilent 1200 series vacuum degasser, a Perkin-Elmer 610TR flow scintillation analyzer, an Ocean Optics HR4000 spectrophotometer, an Ocean Optics DH2000 light source, SEDI HCG400 optical fibers, and an Ocean optics 10 mm Z-flow cell. A GV Instru-ments VG54 thermal ionization mass spectrometer (TIMS) was used. All reagents were analytical grade.
3.2 Dissolution of irradiated pellets
Two irradiated pellets were dissolved by the Laboratory for Dissolution Studies (LED) in the C11/C12 shielded line of the Atalante complex (CEA Marcoule). The hot cell was cleaned prior to each dissolution by performing the disso-lution protocol without any active material and analyzing the solution to evaluate the residual radioactivity level in the cell. The measured gamma activity was below 10−2% of the gamma activity of the dissolved pellet.
The mass of AmO1.62/MgO pellets for each dissolution
was about 0.5 g. At each step in the dissolution protocol, the
exact masses were recorded (pellet mass, added nitric acid mass, etc.). The final dissolution solution volume was about 70 mL.
3.2.1 First dissolution
The first dissolution was carried out for 4 h in boiling 4 N ni-tric acid. The dissolution solution was filtered; many undis-solved particles visible to the naked eye were recovered on the filter. Dissolution was not complete, and therefore the solution characterization is not representative of the actual Am, Cm and Nd concentrations in the pellet.
3.2.2 Second dissolution
The second dissolution was performed in a mixture of 4 N nitric acid and 0.1 N hydrofluoric acid, a chemically more aggressive solution, to ensure quantitative dissolution of the pellet. The insolubles recovered after filtration were washed with a solution of 11 N HNO3 and 0.1 N HF to eliminate
any silica remaining from chemical etching of the glassware by hydrofluoric acid. The undissolved mass after scrubbing represented about 2.5 wt. % of the irradiated pellet. Analysis of this solution yielded a quantitative assay of 97.5% of the dissolved pellet.
3.3 Initial high-activity analyses
Two filtered solution samples were sent by pneumatic trans-fer to the CBA shielded analysis line. The initial high-activity analyses were carried out without any prior sample treatment (Table1) to obtain the approximate concentrations of the major elements of interest for comparison with the values estimated from neutronic simulation codes. This step was particularly important to finalize the development of the
This article is pr otect e d by Ger m an copyri gh t l a w. Yo u may c o py a n d distri bu te t h is a rticle for you r perso nal u se o n ly. O th e r u se is only all o
wed with written
permission by t h e copyri ght h o lder .
Americium, curium and neodymium analysis in ECRIX-H irradiated pellet: sample preparation for TIMS measurements 295
Table 1. First analyses in shielded line.
Elements analyzed 1stdissolution 2nddissolution Analysis technique
(± measurement uncertainty) U (±30%) 6± 2 mg/L 25± 8 mg/L X-ray fluorescencea Pu (±5%) 138± 7 mg/L 807± 40 mg/L Spectrophotometry Am (±10%) 17± 2 mg/L 97± 10 mg/L ICP-AES Nd (±10%) 32± 3 mg/L 34± 3 mg/L ICP-AES H+(±5%) 3.8 ± 0.2 M 4.3± 0.2 M Potentiometry Density (±5%) 1.144± 0.057 g/mL 1.154± 0.058 g/mL Weighing
a: Because spectral interference, a selelective separation of U in a main Pu flow [7] was need.
Table 2. Comparative orders of magnitude of U, Pu, Am, Cm and Nd concentrations between two dissolu-tion soludissolu-tions: UOX 2 (cooled for 5 years) and ECRIX-H (cooled for 3 years).
Approximate concentration (mg/L) Mass ratio α activity ratio
Solution U Pu Am Cm Nd Mg Am/Cm Cm/Am
UOX 2 235× 103 2800 150 23 1340 ε 6.5 ∼ 4
ECRIX-H 25 800 100 135 35 400 0.7 ∼ 60
analysis protocols and to guarantee that the quantities imple-mented are sufficient for the intended analytical techniques. Moreover, these values were indispensable for defining the protocol for tracing the elements of interest in the dissolu-tion soludissolu-tion.
The volumes of both dissolutions were practically the same, allowing the concentrations of the two columns to be compared. The U, Pu and Am concentrations are visibly much lower in the first dissolution solution than in the sec-ond: there ratio between the concentrations for Pu and Am was about 6: 1 (only about 4 : 1 for U). These initial results suggest that Pu and Am (and U?) could be colocalized in the insolubles. This hypothesis was supported by electron probe microanalysis (EPMA) and X-ray diffraction (XRD) obser-vations [3,4] indicating colocalization of Pu, Am, and Cm in a PuOxphase.
3.3.1 Particularity of the matrix
Based on the initial results in Table1 and the values cal-culated from neutronic simulation codes, it is interesting to compare the concentrations in the dissolution solutions for a spent UOX fuel pellet and for an ECRIX-H pellet (Table2).
Typically for a sample from a spent fuel dissolution so-lution, a 1 mL fraction after dilution by a factor of 1000 is allowable in an intermediate-level laboratory. In the case of the ECRIX-H dissolution solution, such a dilution would re-sult in concentrations of about 35μg/L for some elements such as Nd. This implies that only about 35 ng of matter would be transferred to the laboratory in a 1 mL solution sample. This quantity is too small for satisfactory quantifi-cation and repeatability, as TIMS measurements require at least 300 ng of matter per element for an analysis comprising five 10-cycle blocks. Moreover, the Mg-rich matrix of the ECRIX-H pellets can hinder HPLC column separation by cation exchange, which is performed before TIMS analysis.
The dose rate of the initial ECRIX-H dissolution solu-tion is due to the presence of fission products, but also to
emitters that are generally found at ultralow concentrations in “typical” dissolution solutions:242Am and242Cm.
We therefore sought to identify a protocol capable of ad-dressing these two criteria: diminish the sample dose rate (i.e. decontaminate the solution of the main gamma emit-ters); and eliminate the Mg from the matrix.
3.4 Isotopic analysis
3.4.1 Shielded cell separations Two separation routes were selected:
Separation on Biorad AG1X8 resin to retain U and Pu (the major elements in ECRIX-H); U and Pu were then eluted separately;
Separation on Eichrom DGA resin to retain the triva-lent elements; this resin retains the lanthanides (Ln) and Am/Cm, but not Mg and the main gamma emitters such as Cs.
The optimized protocol shown in Fig.2calls for the follow-ing remarks:
The protocol is applied directly to a sample of the disso-lution sodisso-lution (without prior didisso-lution).
No valence adjustment for U and Pu is implemented. In HNO38 M media, Pu is mainly Pu(IV) and U is mainly
U(VI).
Neutralization of fluoride by a concentrated aluminum nitrate solution (as in dissolution No. 2 in the nitric + hydrofluoric acid medium) is not used. U and Pu are par-tially complexed by fluoride and thus not retained on the AG1X8 column. Given its high concentration, traces of U (and Pu in lesser extent) can be present in the Ln stream. However the valence adjustment by a ferrous sulfate so-lution and the fluoride neutralization by an aluminum ni-trate solution would be possible without disturbing DGA performance. Fe(II)/Fe(III) and Al(III) have a low up-take by DGA [8,9]. We chose to minimize the addition
This article is pr otect e d by Ger m an copyri gh t l a w. Yo u may c o py a n d distri bu te t h is a rticle for you r perso nal u se o n ly. O th e r u se is only all o
wed with written
permission by t h e copyri ght h o lder . 296 E. Esbelin et al.
Fig. 2. Separation protocol implemented in a high-activity cell.
of reagents in hot cell in order to make easier the waste management.
Analysis of the solution obtained by washing the AG1X8 column with 30 mL of 8 M HNO3showed the importance
of this step: the solution contained lanthanides.
Some tests were realized to evaluate distribution coeffi-cient of Mg on DGA resin in our experimental condi-tions. Thus, 0.2 g of DGA resin and 2 mL of 100 mg/L Mg(II) in 8 N HNO3were mixed during 5 min. Mg was
analyzed in the supernatant. These tests confirmed that Mg is not uptaked by DGA [8,10].
For the ECRIX-H dissolution solutions the overall Am and Nd recovery efficiency of the protocol was estimated near 100% for both elements. The residual Mg in the Ln fraction was less than 1 wt. %.
Gamma spectrometry measurements were used to esti-mate a137Cs decontamination factor exceeding 104.
The different fractions obtained by this protocol could be transferred to the laboratory without restriction.
3.4.2 Glove box separations
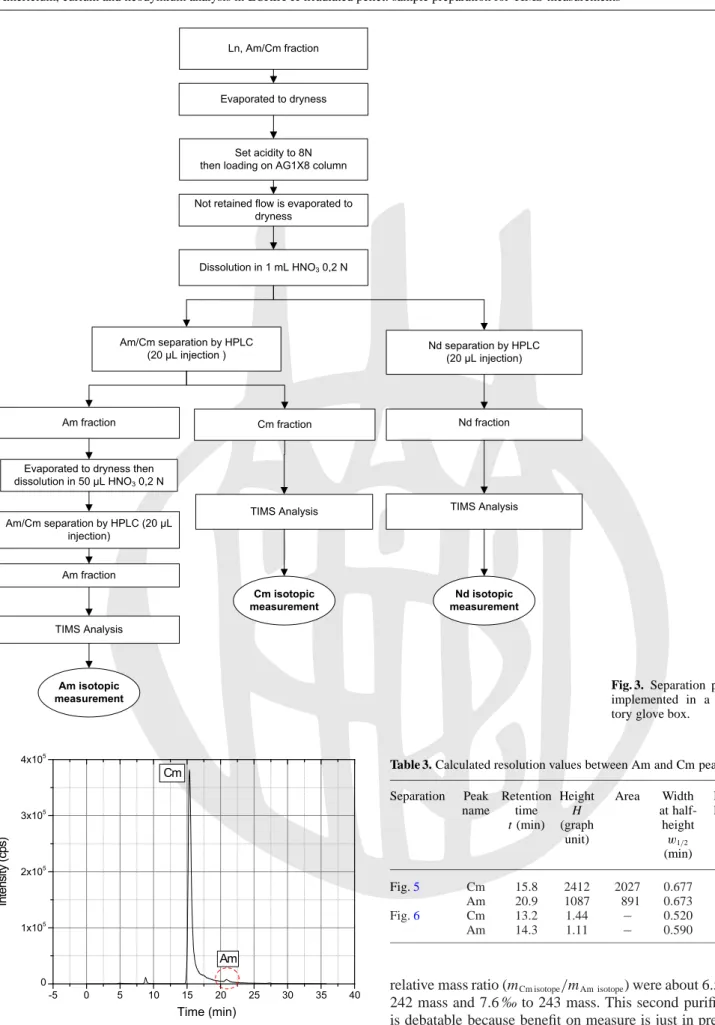
In the laboratory, the sample containing Am, Cm and Nd was again passed through AG1X8 resin to eliminate any re-sidual Pu traces that could interfere with HPLC separation. The protocol is shown in Fig.3.
A typical Am/Cm separation is illustrated in Fig.4. The method used [11] was developed for solutions arising from the dissolution of spent UOX or MOX fuel after 5 to 10 years
of cooling, in which the Cm/Am activity ratios did not ex-ceed 10: 1 and the Am/Cm mass ratios ranged from about
4: 1 to 8 : 1. In the case of the ECRIX-H pellet dissolution
solution, the Cm/Am activity ratio was very high (∼ 60 : 1) whereas the Am/Cm mass ratio was near 0.7 : 1. The dif-ference between the solution compositions explains why the method used was unable to satisfactorily resolve the Am and Cm peaks for the ECRIX-H dissolution solution.
The decontamination of Cs was particularly effective: no radiometric signal was detected except for Am and Cm.
Although Cm fractionation was performed without diffi-culty, the fraction containing Am (and Cm) was reinjected in the HPLC column for a second purification.
The separation obtained is shown in Fig.5. This time the resolution of the Am and Cm peaks was excellent and the fraction containing Am was pure. Resolution was calculated with RS= 1.18 (t2− t1) w1 2,1+ w12,2 (1) where w1/2 was estimated by Peak Analyser module of
Origin® software. The values are reported in Table3. Sup-posing that efficiency of radiometric detector was very close for Am and Cm counting, then their peak areas can be di-rectly compared. Am and Cm specific activities were esti-mated to 2.6 × 10¹²
Bq/g Cm and 4.9 × 10¹⁰
Bq/g Am (iso-topic results were used). From Fig.5, peak areas ratio was about ACm/AAm∼ 2.3. Thus mass ratio in the reinjected
frac-tion was estimated to mCm/mAm∼ 4.3 × 10⁻². Cm mass
This article is pr otect e d by Ger m an copyri gh t l a w. Yo u may c o py a n d distri bu te t h is a rticle for you r perso nal u se o n ly. O th e r u se is only all o
wed with written
permission by t h e copyri ght h o lder .
Americium, curium and neodymium analysis in ECRIX-H irradiated pellet: sample preparation for TIMS measurements 297
Fig. 3. Separation protocol
implemented in a labora-tory glove box.
Fig. 4. HPLC chromatogram of the first injection of the (Am, Cm, Nd)
fraction. Column: Nucl´eosil 100-5SA 250×4; Eluent: 0.1 M HMB
ad-justed to pH 3.6 with NH3; Elution rate: 0.8 mL/min; Injection loop:
20μL; Detector: FloOne 610TR (Perkin-Elmer); Detection cell:
het-erogeneous glass 82.5 μL; Energy range: 0–2048 keV.
Table 3. Calculated resolution values between Am and Cm peaks.
Separation Peak Retention Height Area Width
Reso-name time H at half- lution
t (min) (graph height RS
unit) w1/2 (min) Fig.5 Cm 15.8 2412 2027 0.677 4.46 Am 20.9 1087 891 0.673 Fig.6 Cm 13.2 1.44 − 0.520 1.17 Am 14.3 1.11 − 0.590
relative mass ratio (mCm isotope/mAm isotope) were about 6.5 ‰ to
242 mass and 7.6 ‰ to 243 mass. This second purification is debatable because benefit on measure is just in precision limit of TIMS.
Nd was separated by reversed-phase chromatography (Fig.6) on the basis of the protocols described in [12–14]. The column used C18 as the stationary phase and the eluent
This article is pr otect e d by Ger m an copyri gh t l a w. Yo u may c o py a n d distri bu te t h is a rticle for you r perso nal u se o n ly. O th e r u se is only all o
wed with written
permission by t h e copyri ght h o lder . 298 E. Esbelin et al.
Fig. 5. HPLC chromatogram of the second injection of the (Am/Cm)
fraction. Same operating conditions as in Fig.4.
Fig. 6. Chromatogram of Ln separation from an ECRIX-H pellet disso-lution sodisso-lution after treatment (refer to text). The dotted line represents the injection of a surrogate Ln solution. Elution: 0.09–0.23 M HIBA in 20 min in the presence of 0.01 M octanesulfonic acid adjusted
to pH 3.7 with NH3; Column: Vydac 201TP5415 150× 4.6; Elution
rate: 1 mL/min; Injection loop: 20 μL; Post-column derivation: PAR 0.05 g/L in 1 M acetic acidic + 2 M NH3. PAR flow rate: 0.3 mL/min. Detector: HR4000 (Ocean Optics) at 520 nm; Detection cell: Z-flow with 1 cm optical path.
wasα-hydroxyisobutyric acid (HIBA) with n-octanesulfonic acid as a modifier. Detection was performed by spectropho-tometry after adding a metallochromic complexing agent, PAR (4-(2-pyridylazo)resorcinol). Some parameters (elution rate, pH of eluent, gradient separation) were adjusted to opti-mize the resolution of Nd with Ln adjacent bands (potential isobaric interferences). Indeed Nd injected mass was more important (from 10 to 50 times) than one used in [12–14]. Direct fractionation of the flow detected by spectrophotom-etry would result in the presence of PAR in the sample and hinder the process of deposition on the filaments for TIMS analysis. Fractionation of part of the flow between the col-umn outlet and the point of PAR addition was investigated. Under these conditions it is very difficult to sample ex-actly what is detected by spectrophotometry (different tran-sit times for the two channels, allowance for the residence time and dead volume of the spectrophotometry cell, etc.). Given the difficulties involved in performing simultaneous
fractionation with a detection channel, but considering the good repeatability of the separations, we decided to imple-ment “blind” fractionation. After identifying the retention time of the peaks of interest in the first separation (Fig.6), we conducted a second separation in which PAR was re-placed by 10−3M nitric acid at the same flow rate.
The Nd and Am peaks were poorly resolved, but as Am does not create isobaric interference with Nd, its presence does not hinder the isotopic determination of Nd. Mg was eliminated from solution sufficiently that it did not interfere with the chromatogram and column performance. We can notice that Am and Cm are also separated by this method. Resolution was calculated for Am and Cm adjacent bands (Table3). These results highlight that the quality of the sep-aration between Am and Cm is better with the first method. However, an optimization study should allow to improve the resolution between Am and Cm of the second method. This work is already scheduled in our laboratory.
The preparation of injected sample was imposed by re-quired mass quantity for TIMS measurement. Then, the cal-culus is in function of the least concentrated element to analyze in the original sample. The global irradiation of the injected sample can become important in some case and we have noticed that the used columns performances deteriorate with time. It can be necessary to carry out a little adjustment of some parameters to get a good separation back.
The isotopic compositions were determined for Am, Cm and Nd (Tables4to6). A scan of surrounding mass values confirmed absence of isobaric interference. The results of each dissolution are the average of two independent meas-urements.
The estimated uncertainties on the isotopic results were based on the known performance of the method, and on the experience acquired in the laboratory and on prior validation data. Isotopic reference standards are routinely measured to check the instrument response.
Table 4. Am isotopic assay (at. %).
1stdisso- 2nddisso- Neutronic simulation after
lution lution 3.5 years 4 years
of cooling of cooling
241Am 35.5 ± 0.04 34.17 ± 0.03 39.46 39.72
242Am 1.60 ± 0.02 1.55 ± 0.02 0.97 0.97
243Am 62.90 ± 0.03 64.28 ± 0.06 59.57 59.32
Table 5. Cm isotopic assay (at. %).
1stdisso- 2nddisso- Neutronic simulation after
lution lution 3.5 years 4 years
of cooling of cooling 242 Cm 0.24 ± 0.02 0.25 ± 0.01 0.30 0.14 243Cm 11.45 ± 0.06 11.34 ± 0.06 6.65 6.64 244Cm 69.94 ± 0.07 70.02 ± 0.07 69.17 68.86 245Cm 15.11 ± 0.08 15.06 ± 0.08 18.35 18.70 246Cm 3.13 ± 0.03 3.17 ± 0.02 5.26 5.38 247Cm 0.14 ± 0.01 0.14 ± 0.01 0.22 0.23 248Cm < 0.05 (DL) < 0.05 (DL) 0.04 0.04
This article is pr otect e d by Ger m an copyri gh t l a w. Yo u may c o py a n d distri bu te t h is a rticle for you r perso nal u se o n ly. O th e r u se is only all o
wed with written
permission by t h e copyri ght h o lder .
Americium, curium and neodymium analysis in ECRIX-H irradiated pellet: sample preparation for TIMS measurements 299
Table 6. Nd isotopic assay (at. %).
1stdisso- 2nddisso- Neutronic simulation after
lution lution 3.5 years 4 years
of cooling of cooling 142Nd 0.74 ± 0.04 0.95 ± 0.10 0.85 0.84 143Nd 19.97 ± 0.02 19.69 ± 0.10 18.69 18.65 144Nd 27.53 ± 0.03 27.58 ± 0.14 28.94 29.07 145Nd 15.19 ± 0.02 15.09 ± 0.08 14.89 14.86 146Nd 18.97 ± 0.02 19.08 ± 0.10 19.22 19.19 147Nd < 0.1 (DL) < 0.1 (DL) 0.00 0.00 148Nd 10.81 ± 0.01 10.86 ± 0.05 11.00 10.99 150 Nd 6.78 ± 0.03 6.76 ± 0.07 6.41 6.40 3.5 Quantitative analysis
Analysis by isotopic dilution was chosen for quantitative determination to ensure highest possible accuracy. Isotopic dilutions were carried out on samples of the high-activity dissolution solution. Source tracing takes into account pos-sible variations in the dissolution solution (concentration by evaporation, for example), as well as the efficiency of the different separation steps implemented prior to TIMS analy-sis.
Isotope dilution is subject to certain conditions, how-ever:
Mixing between the tracer and the sample must result in ideal chemical and isotopic homogeneity (same valence state and same physical state).
No chemical treatment of the sample/tracer mixture must affect isotopic fractionation.
The tracers were selected and adjusted so that after addition the major isotope in the tracer was present in the same pro-portion as the major isotope in the sample (Table7). Prior sample dilution by a factor of 250 was necessary to trace Cm because its concentration was too high with respect to the available tracer concentration.
All dilutions were carried out by weighing. Solution trac-ing was performed twice. The separation protocols were identical to those used for isotopic analysis.
The results calculated from the general equation for iso-tope dilution are expressed as a mass concentration of the element in the irradiated pellet dissolution solution before or after dilution. Based on the mass of the final filtered dissolu-tion soludissolu-tion (from which the analysis samples were taken), the dissolved pellet mass, and the dilution factor, the results are expressed in milligrams per gram of initial heavy metal (mg/giHM) in Table8.
The uncertainties were calculated by applying the law of propagation of uncertainty. Only the uncertainty on the
Table 7. Tracers and isotopic ratios obtained in the sample-tracer mix-ture.
Major isotope in tracer Estimated isotopic ratio
in sample+ tracer solution
241Am 241/243 = 0.90
145Nd 145/144 = 1.22
248Cm 248/244 = 1.12
Table 8. Concentration of heavy nuclides in the pellets at the end of irradiation: measured and calculated values.
Element Concentration (mg/giHM)
Measurement Neutronic Neutronic
after 3.5–4 simulation simulation
years of after 3.5 years after 4 years
cooling of cooling of cooling
Am 63.4 ± 0.81 79.1 79.4
Cm 99.2 ± 5.3 96.7 95.2
Nd 29.3 ± 0.29 34.7 34.7
initial Am content of the pellet (16.65 wt. %) was disre-garded.
The Cm content was also determined by alpha spectrom-etry. Based on the measured isotopic composition, the Cm concentration was estimated at 98.7 ± 11.7 mg/giHM. This
result is very good agreement with the value indicated in Table8.
On the basis of the results in Table8, the dissolved pel-let mass, and the initial Am mass ratio of 16.65%, the Am transmutation efficiency is estimated at 93.7%.
4. Conclusion
Two irradiated ECRIX-H pellets were dissolved in view of two distinct objectives.
Concerning the reprocessability of pellets containing americium, a large quantity of insolubles can be observed (about 10 wt. % of the initial fuel).
The second objective was addressed by the dissolution of a pellet in nitric + hydrofluoric acid to characterize some elements of interest (Am, Cm and Nd) in order to con-solidate the evolution codes and determine the fission and transmutation rates.
Separation protocols were implemented in a high-activity cell to diminish the sample dose rate while transferring suf-ficient quantities of the elements to be measured. Additional separations were then performed in the laboratory.
Isotopic and quantitative analyses were carried out for Am, Cm and Nd. The values obtained were in very good agreement with the estimates given by the evolution code.
The Am transmutation rate was estimated experimentally at 93.7 at. %, which is slightly higher than the value obtained by neutronic simulation i.e. 92.6 at. %. The same trend was also observed by means of radial EPMA analysis on pel-lets [3].
Dissolution tests and analysis on two UO2pellets
irradi-ated in the same pin will be performed later to quantify pre-cisely the neutron fluence accumulated by the Am1.62/MgO
pellets and reajust the simulation code calculation.
Acknowledgment. The authors would like to thank Electricit´e de France
(EDF) for its financial support.
References
1. B´ejaoui, S., Lamontagne, J., Bonnerot, J. M., Brunon, E.: In: Pro-ceedings of Global 2009. Paris, France (2009), pp. 2104–2115. 2. B´ejaoui, S., Lamontagne, J., Esbelin, E, Bonnerot, J. M.,
This article is pr otect e d by Ger m an copyri gh t l a w. Yo u may c o py a n d distri bu te t h is a rticle for you r perso nal u se o n ly. O th e r u se is only all o
wed with written
permission by t h e copyri ght h o lder . 300 E. Esbelin et al.
3. Lamontagne, J., B´ejaoui, S., Hanifi, K., Valot, Ch., Loubet, L.: J. Nucl. Mater. 413, 134 (2011).
4. Lamontagne, J., et al.: J. Nucl. Mater., submitted for publication (2013).
5. Vidal, J.-M., Groullier, J.-P., Launay, A., Berthion, Y., Marc, A., Toubon, H.: In: Proceedings of WM’06 Conference, Tucson, USA (2006).
6. Roque, B., Thiollay, N., Marimbeau, P., Barreau, A., Tsilan-zara, A., Garzenne, C., Marcel, F.: In: Proceedings of International Conference on Reactor Physics Safety and High-Performance Computing, PHYSOR 2002, Seoul, Korea, 7–10 October 2002, CD, ISBN: 0894486721.
7. Crozet, M., Guigue, M.: Radiochim. Acta 95, 629–635 (2007).
8. Horwitz, E. P., McAlister, D. R., Bond, A. H., Barrans, R. E.: Solv. Extr. Ion Exch. 23, 319 (2005).
9. Horwitz, E. P., McAlister, D. R., Thakkar, A. H.: Solv. Extr. Ion Exch. 26, 12 (2008).
10. Pourmand, A., Dauphas, N.: Talanta 81, 741 (2010).
11. Chartier, F., Aubert, M., Pilier, M.: Fresenius J. Anal. Chem. 364, 320 (1999).
12. Knight, C. H., Cassidy, R. M., Recoskie, B. M., Green, L. W.: Anal. Chem. 56, 474 (1984).
13. Barkley, D. J., Blanchette, M., Cassidy, R. M., Elchuk, S.: Anal. Chem. 58, 2222 (1986).
14. Tsakanika, L. V., Ochsenkühn-Petropoulou, M. T., Mendrinos,