1
Bio-Economy: Chances, Risks,
and Perspectives for the
System as a Whole
Andreas Pfennig
Products, Environment, and Processes (PEPs)
Department of Chemical Engineering
Université de Liège
www.chemeng.uliege.be/pfennig
[email protected]
presentation given at the department seminar
01.10.2018
THE major driver
world population
7.600.000.000
food
2.8 kg/(cap d)
energy
21.000 kWh/(cap a)
materials
ca. 0.9 kg/(cap d)
fossil resources
5.6 kg/(cap d)
land area
agricultural: 7.000 m
2
/cap
3
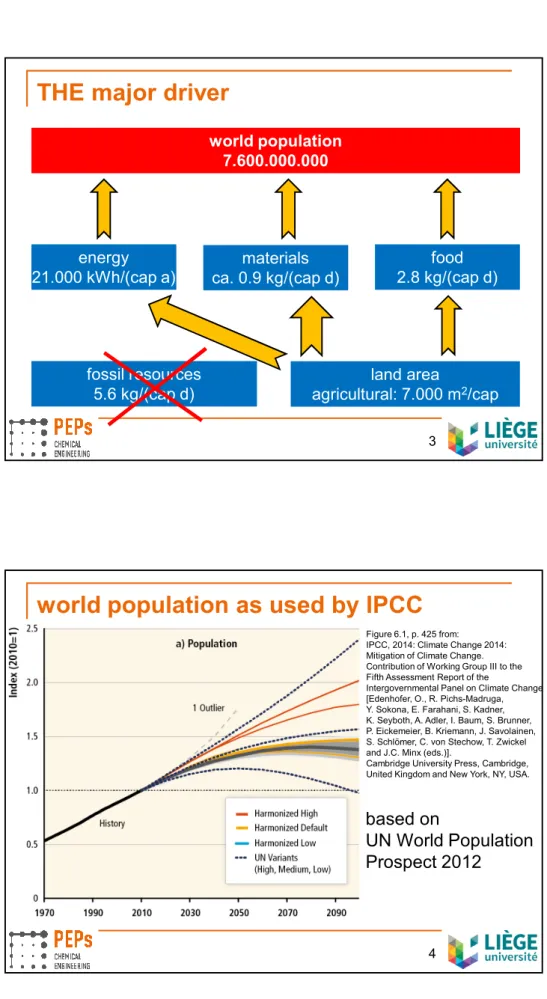
world population as used by IPCC
Figure 6.1, p. 425 from: IPCC, 2014: Climate Change 2014: Mitigation of Climate Change. Contribution of Working Group III to the Fifth Assessment Report of the
Intergovernmental Panel on Climate Change [Edenhofer, O., R. Pichs-Madruga, Y. Sokona, E. Farahani, S. Kadner, K. Seyboth, A. Adler, I. Baum, S. Brunner, P. Eickemeier, B. Kriemann, J. Savolainen, S. Schlömer, C. von Stechow, T. Zwickel and J.C. Minx (eds.)].
Cambridge University Press, Cambridge, United Kingdom and New York, NY, USA.
based on
UN World Population
Prospect 2012
development of UN-WPP predicting for 2050
6
2000
2010
2020
2030
2040
2050
7
8
9
10
11
w
o
rld
p
o
p
u
la
tio
n
2
0
5
0
in
b
ill
io
n
year of publication
high variant
me
dium
var
iant
low
va
ria
nt
11.03 billion in 2050
world population scenarios
1960
1980
2000
2020
2040
2060
2080
2100
0
2
4
6
8
10
12
14
m
y
y
e
a
r
o
f
b
ir
th
w
o
rl
d
p
o
p
u
la
ti
o
n
i
n
b
ill
io
n
year
low variant
medium variant
high
variant
to
d
a
y
11.03 billion in 2050
source:
United Nations
World Population Prospect
2017 Revision
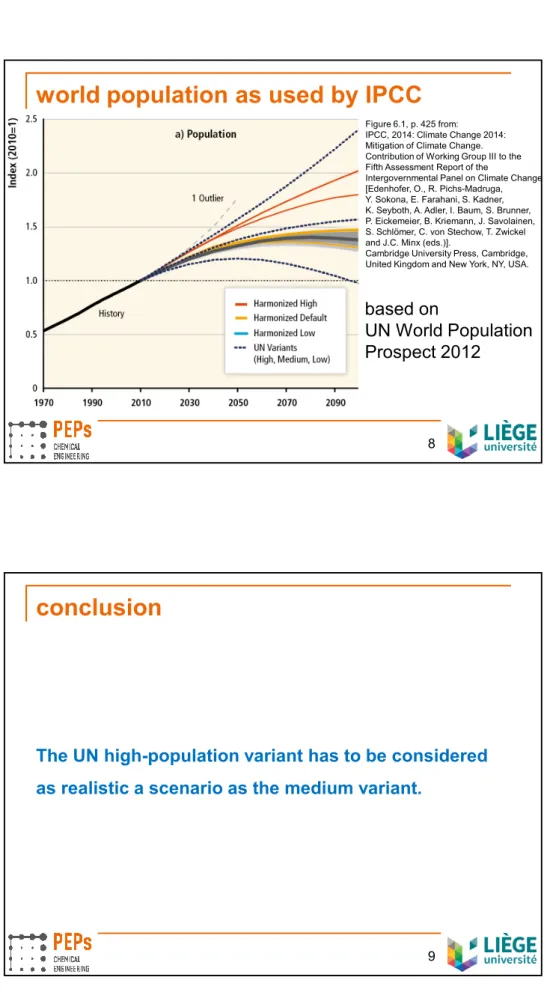
world population as used by IPCC
8
Figure 6.1, p. 425 from: IPCC, 2014: Climate Change 2014: Mitigation of Climate Change. Contribution of Working Group III to the Fifth Assessment Report of the
Intergovernmental Panel on Climate Change [Edenhofer, O., R. Pichs-Madruga, Y. Sokona, E. Farahani, S. Kadner, K. Seyboth, A. Adler, I. Baum, S. Brunner, P. Eickemeier, B. Kriemann, J. Savolainen, S. Schlömer, C. von Stechow, T. Zwickel and J.C. Minx (eds.)].
Cambridge University Press, Cambridge, United Kingdom and New York, NY, USA.
based on
UN World Population
Prospect 2012
conclusion
The UN high-population variant has to be considered
as realistic a scenario as the medium variant.
1990
2000
2010
2020
2030
2040
2050
0.01
0.1
1
10
g
ro
w
th
o
r
s
u
b
s
ti
tu
ti
o
n
r
a
te
i
n
%
/a
year
high population variant
wind + solar
max. substitution rate: 3.0%/a
2.0%/a
growth rate: 30%/a
20%/a
defining three future scenarios
10
on global
average!
CO
2
according to three scenarios
1980
2000
2020
2040
2060
2080
0
10
20
30
40
50
60
high population variant
renewables scenarios:
20% - 2.0%, easiest
25% - 2.5%, medium
30% - 3.0%, challenging
+1.93 °C
+1.66 °C
+1.51 °C
C
O
2p
ro
d
u
c
ti
o
n
i
n
G
t/
a
year
hi
st
or
ic
al
, n
o
su
bs
tit
ut
io
n
conclusion
12
time-scale: turning point in 5 to 10 years
strong effect in 10 to 20 years
volatile prices of fossil feedstock foreseeable
By then, bio-economy should better be well on its way!
Reducing population growth simplifies transition.
world hunger
1990
0
2000
2010
2020
2030
200
400
600
800
1000
u
n
d
e
rn
o
u
ri
s
h
e
d
p
e
o
p
le
i
n
m
ill
io
n
year
historical data
new
goal
UN Millenium
Development Goals
UN Sustainable
Development Goals
2000
2020
2040
2060
2080
2100
0
1000
2000
3000
4000
5000
6000
7000
8000
9000
10000
biomaterials
biofuels
pasture
plant-based food
forests
meadows
and pasture
la
n
d
a
re
a
m
2/c
a
p
year
arable land
feed
remaining forest
land-area: challenging, high pop. variant
14
2000
2020
2040
2060
2080
2100
0
1000
2000
3000
4000
5000
6000
7000
8000
9000
10000
biomaterials
biofuels
pasture
plant-based food
forests
meadows
and pasture
la
n
d
a
re
a
m
2/c
a
p
year
arable land
feed
remaining forest
2000
2020
2040
2060
2080
2100
0
1000
2000
3000
4000
5000
6000
7000
8000
9000
10000
biomaterials
biofuels
pasture
plant-based food
forests
meadows
and pasture
la
n
d
a
re
a
m
2/c
a
p
year
arable land
feed
remaining for forest
land-area: challeng., medium pop., vegetal
16
conclusion
No workarounds!
with behaviour change:
available technology allows sustainable wellbeing
without behaviour change:
technologies continually pushed to limits or
more people undernourished
conclusion
18
To feed the world, change in behavior essential:
maximum 2 children per family
exclusively plant-based food
Nevertheless: competiton for land area between
feedstock for bio-fuels and bio-materials
food production.
land-area demand for feedstock
is essential selection criterion!
calculation of exergy
R
U
R
U
)
(
1
)
(
)
(
iF
R
U
U
phys
T
T
i
T
T
i
i
i,
C
T
dT
V
P
P
T
T
C
T
dT
E
j
i
j
j
i
i
i
G
E
E
1
o
chem
,
,
o
chem
,
exergy of a material stream
chemical exergy of a material stream
physical exergy of a material stream
mix
1
phys
,
chem
,
E
E
E
E
N
i
i
i
i
chemical exergy of various materials
20
0
10
20
30
40
50
60
80
100
120
140
P
A
6
.6
po
ly
st
yr
en
e
P
ET
P
VC
po
ly
pr
op
yl
en
e
po
ly
ca
rb
on
at
e
H
2
O, CO
2
methanol
glucose
amylose
ethanol
glycerol
lactic acid
CO
po
ly
la
ct
ic
a
ci
d
po
ly
et
hy
le
ne
ethene
plant oil
coal
crude oil
methane, natural gas
c
h
e
m
ic
a
l
e
x
e
rg
y
i
n
M
J
/k
g
hydrogen
fossil biomass intermediates products
feedstock
glucose
fermentation
net
reaction
fossil
after: Philipp Frenzel, Rafaela Hillerbrand, Andreas Pfennig:
Increase in energy and land use by a bio-based chemical industry.
Chemical Engineering Research and Design 92 (2014 ) 2006-2015
bio-based?
elements in chemical industry by weight
PE
PLA
H
O
fossil raw materials
bio-based feedstock
conventional polymers
bio-based polymers
lignin
starch, cellulose
hemicellulose
glucose
oleic acid
natural gas
crude oil
coal
C
PET
PHB
water
CO
2+H
2-H
2O
-CO
2-H
2O
feasible reactions
22
0
10
20
30
40
50
60
80
100
120
140
H
2O
CO
2methanol
glucose
ethanol
ethene
c
h
e
m
ic
a
l
e
x
e
rg
y
i
n
M
J
/k
g
hydrogen
net
reaction
options for bio-based chemicals
gen.
feedstock
products
1
sugar cane
sugar or ethanol + CO
2ethanol
ethylene
1
sugar beet
sugar or ethanol + CO
2ethanol
1
oil palm
plant oil
1 + 3
corn + straw
ethanol + CO
2ethanol
1
corn
sugar or etanol + CO
2ethanol
3
corn straw
ethanol + CO
2ethanol
1 + 3
wheat + straw
ethanol + CO
21
rape seed
plant oil
2
miscanthus/reeds
ethanol + CO
2ethanol
ethylene
2
wood
ethanol + CO
2ethanol
ethylene
ranges:
maximum national and
world average productivity
projected for 2050
color:
■
technically realized
■
partly pilot-plant
■
lab-values or complex
in radius 50 km:
200 m
2/cap >600 000 t/a
400 m
2/cap >300 000 t/a
600 m
2/cap >200 000 t/a
0
500
1000 1500
area in m
2/cap
arable land 2050
goal
conclusion
24
• solely third generation bio-processes not feasible
• first and second generation compete for same land area as
food
• various options available as feedstock:
sugar cane, sugar beet, corn, palm oil, miscanthus/reeds
• preferably either sugar chemistry or utilization of CO
2
• cellulose utilization is add-on benefit, but large by-prodcuts
• strong interaction:
agriculture
food chemistry energy
chances, challenges
biobased chemistry: various options
bio-economy
≠
only bio-technology
bio-economy
≠
automatically sustainability
technology
human behavior
economics, ecologics,
ethics
big chance
: real circular economy
26