HAL Id: hal-01007540
https://hal.archives-ouvertes.fr/hal-01007540
Submitted on 16 Jun 2014
HAL is a multi-disciplinary open access archive for the deposit and dissemination of sci-entific research documents, whether they are pub-lished or not. The documents may come from teaching and research institutions in France or abroad, or from public or private research centers.
L’archive ouverte pluridisciplinaire HAL, est destinée au dépôt et à la diffusion de documents scientifiques de niveau recherche, publiés ou non, émanant des établissements d’enseignement et de recherche français ou étrangers, des laboratoires publics ou privés.
Practical Aspects: Industrial Implementation and
Limitations in a Multi-criteria Context
Franck Schoefs, Bruno Capra
To cite this version:
Franck Schoefs, Bruno Capra. Practical Aspects: Industrial Implementation and Limitations in a Multi-criteria Context. Construction Reliability: Safety, Variability and Sustainability, 15, pp.293-309, 2012, 9781848212305. �10.1002/9781118601099.ch15�. �hal-01007540�
Practical Aspects: Industrial Implementation
and Limitations in a Multi-criteria Context
15.1. Introduction
If the consideration of a purely economic criterion can be the optimal solution for a simple and well-known system, in practice, things are rarely as easy as a result of interactions with other systems. This is particularly the case for any complex industrial system.
To illustrate this, we can take the example of optimizing a system of waterworks in a city: this system includes elements (pipes) of different ages and different types depending on the development of the city and neighborhoods, different loads (low or high road traffic), and a different environment (more or less aggressive soil in the case of metallic pipes for example), to illustrate only a few parameters among many others.
The economic optimization of the maintenance of such a system is theoretically possible, provided sufficient information is available. Such information concerns the physical behavior, economic valuation, the failure rate or the kinetics of degradation by the factors mentioned above. However, this system also interacts with other systems in the city – sewage, electricity, and gas systems for example – which theoretically have their own optimal maintenance frequency.
We must therefore consider economic optimization from a global point of view at the city scale or (more practically) the neighbourhood scale to avoid digging
through a road that was renovated a year ago in order to replace some pipes. In addition, other parameters that are not purely technical come into play: noise, traffic problems, serviceability or, more generally, anything that is related to users can also impact the optimization system if social criteria are integrated.
Finally, other even more uncertain aspects are to be considered: investment opportunities (loss of revenue in crisis period), the change of development strategy related to a change of government, etc.
This small example shows that it rapidly becomes very difficult to optimize a complex multi-criteria system. It is even possible for contradictory stakes to appear that must then be studied in different ways: global optimization weighted in accordance with the stakes considered, or separation and optimization of some main stakes. In summary, any optimization process should be understood in the context of a very specific reference framework that takes into account the most important stakes for the operator.
An important aspect in the development of a methodology for industrial optimization of maintenance concerns, as outlined in the previous chapters, is the quantity and quality of data. Frequently, if we consider the case of large industrial assets, management practice is to follow the hierarchy of needs presented in Figure 15.1.
Figure 15.1. Pyramid of needs for the management of industrial assets (from [BOE 09])
Traditionally, the manager of an industrial asset follows the pyramid from the base to the top (arrow 1, Figure 15.1):
– knowledge: what is the asset to be managed? The answer to this question is not always evident for an old structure for which the history could have been lost with time (fire, war, relocation, etc.). It is necessary to clearly define the perimeter of the asset to study before any other action is taken;
– survey: what is the condition of the asset? This question is often perceived as the most important because it is prior to any optimization phase. However, it does not always need to be answered fully (100% of the known assets) as we shall see later. This step allows us to define the state of degradation of the progressively ageing asset or to identify the current service life of elements;
– maintenance/repair: how will we maintain or recover the asset? To optimize the overall cost of maintenance actions, it is necessary to know the different possibilities (options) for maintaining or repairing the system, and the individual costs associated. In the case of infrastructure, for the same failure mode, different levels of maintenance actions may be available. These may have varying costs, but also varying efficiency. In the case of a cost/benefit approach, this element should not be forgotten when deciding on optimal maintenance actions;
– ranking: what actions should be taken first? This phase requires the definition of one or more limit states and corresponding thresholds for optimization. In the context of industrial infrastructure, criteria related to safety, availability and cost are commonly considered;
– decision: the final stage of the process. All previous steps provide key elements for decision support in relation to the various stakes considered.
This classic bottom-up approach is often seen as applicable only if the state of the system is perfectly known, which is not necessarily the case. Therefore, if ageing is controlled, the different steps generally involve the prior knowledge of the whole system before continuing the process (inspection). This is disadvantageous because it requires potentially significant investment and time before the definition of the maintenance master plan.
Approaches for risk-based maintenance, such as Failure Mode, Effects and Criticality Analysis (FMECA, see Part 1) or Reliability Centered Maintenance (RCM, see Chapter 13) for example, can address the problem of optimizing maintenance without first having complete knowledge of the system (arrow 2, Figure 15.1). Given the priorities in terms of maintenance policy, the various stakes considered, and partial knowledge of the asset, it is possible to define an action plan which recommends improving knowledge of the asset or monitoring some targeted elements only, rather than the whole system.
Considering the previous example, if we consider a sewer network, it is not necessary to know the current status of the entire system by inspection, which would be very expensive and time consuming, before taking action. A preliminary risk analysis is used to define the highest risk areas, with some degree of uncertainty given partial existing data, and then enables the definition of the main areas to inspect in order to refine the analysis and optimize the corresponding maintenance actions.
In summary, the industrial application of maintenance optimization methods based on a single economic optimum is difficult to implement from a practical point of view: given the uncertainties and complex phenomena involved, it is often more convenient to reason with respect to different scenarios that can encompass various alternatives. The following paragraph gives some examples of maintenance optimization in different industrial contexts.
15.2. Motorway concession with high performance requirements 15.2.1. Background and stakes
This study concerns the concession of a European motorway section for which the contractor must provide the entire integrated project design, construction, financing, maintenance and operation over the next thirty years. To ensure network availability, security and quality for users, a penalty system was introduced at the initiative of the public authority. Given the significant penalties for non-compliance with the criteria of availability, the contractor faces a high risk potential associated with unplanned outages, despite the precautions taken to ensure reliable operation. Therefore, there is a strong challenge for the contractor, during the call for tender, to fund the cost of risk associated with unavailability of the motorway network.
Unavailability can be of two different types: planned (for maintenance intervention) or unplanned. The challenge is to assess the residual risk associated with these unplanned outages. In particular, the following steps must be undertaken:
– identify and assess the risk:
- frequency of occurrence: identify the ageing mechanisms that might call into question the availability criteria, evaluate their kinetics, and determine the associated probability of failure;
- severity: identify the different scenarios of penalties; – monetize the risk: financially quantify the amount of risk;
– characterize the quantitative risk over 30 years. This enables us to know how and when to plan for risks.
In a second phase, the objective is to optimize the overall forecast operating costs over the operating period. These costs include:
– construction costs, depending on the chosen design; – maintenance costs over the entire concession time; – operating costs over the entire concession time; and – the cost of risk associated with unavailability.
The results of the study lead to a connection between a financially quantified residual risk, relative to unplanned unavailability, and different scenarios related to the quality of design and maintenance levels implemented. The more robust the design choices are, and the greater the level of maintenance, the lower the residual risk, and vice versa. The final design and maintenance choices are taken with a view to achieving the optimum scenario to minimize the total cost of the project.
The asset studied consists of a 40-year old highway network of about 15 km that connects three highways and crosses a canal through an underwater tunnel of about 600 m length. The existing tunnel has two partitions of one-way traffic made of two lanes in each direction. The decision was taken to build a new tunnel with two partitions parallel to the former (see Figure 15.2).
Figure 15.2. Studied system: existing and new tunnel (from [AUG 09])
To minimize the possibility that the tunnel undergoes multiple unplanned maintenance periods, the contract for construction and operation includes a penalty clause related to unavailability but also some quality and comfort criteria. About thirty operational requirements were defined in the technical specifications, from the pavement quality (roughness, drainage, etc.) to the proper operation of safety systems (lighting, ventilation, light signals, etc.). For each of these criteria, beyond a certain level of system failure (such as the number of lights out of service) or degradation of the roadway (such as time of drainage of rain water), maintenance is imposed and the section over which the failure occurs is considered to be unavailable, triggering penalties.
The severity of the penalty applied depends on several factors, including the duration of the unavailability of the section concerned, the number of lanes closed, the time at which the unavailability occurs (peak, off peak, night, etc.). These penalties can quickly reach several million euros.
A possible preventative measure consists of anticipating failures and planning maintenance actions before they are imposed. The system operator is allowed 35 nights per year of downtime for maintenance without penalty. The challenge is to find the optimum maintenance program to balance the anticipation of works, which helps to avoid unplanned outages, and postponement, avoiding the proliferation of maintenance actions.
15.2.2. Methodology
A preliminary analysis showed the requirements of the most critical operation: – pavement roughness;
– accumulation of water on the roadway;
– operation of the ventilation system in tunnels; – operation of traffic detectors;
– operation of the monitoring and management system (control room).
The approach adopted for the study of unavailability related to a problem of pavement roughness and to failure of the ventilation is presented below. In general, the probability of failure over time was calculated initially on the basis of available feedback. The probability of failure was then used to determine the cumulative probability of a failure during the concession period of 30 years.
15.2.2.1. Roughness of the pavement
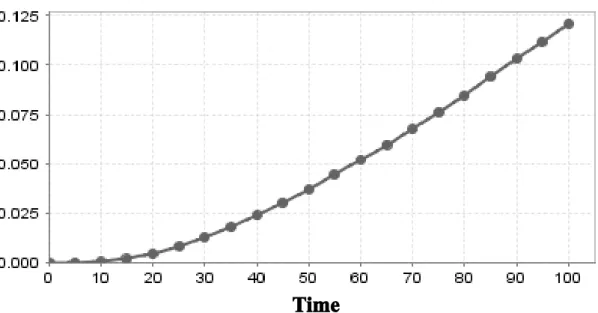
The roughness of a roadway increases during the first year of operation due to the gradual erosion of the binder around the aggregates, which then become sharper. The initial friction coefficient may therefore be relatively low and the probability of non-compliance with the roughness requirement is then non-zero. When the surface binder has disappeared, the coefficient of friction decreases due to aggregate polishing and stabilizes after about 5 years. The probability of failure increases during this period until the road surface is renovated (≈ 10 to 13 years).
Figure 15.3. Cumulative probability of unavailability due to the roughness of the pavement [AUG 09]
The cumulative penalties cost, shown in Figure 15.4, is based on the number of lanes that would be impacted by the unavailability and takes into account the specificities of different sections of the roadway.
Figure 15.4. Cumulative penalty costs for unavailability due to non-compliance with roughness requirements
15.2.2.2. Ventilation system in tunnels
For these kinds of systems, the probability of failure was determined according to the manufacturers’ data using a Weibull type law. The probability distribution for each component was fitted on the basis of expected lifetimes (frequency of planned replacement), the mean time between failures (MTBF) provided by manufacturers, and usual lifetimes during which a failure is very unlikely to occur.
0 0,01 0,02 0,03 0,04 0,05 0,06 0 5 10 15 20 25 30 Time (years)
Early age friction coefficient Aggregate polishing Roughness stabilization
13 years:
Renovation of road surface
Cumulative probability
0 5 10 15 20 25 30
Years Cost
Section closure One lane closure
For ventilators, the combination of the probability of failure of the devices themselves (wear of propellers) and electronic and electrical components is considered.
Figure 15.5. Probability of failure of a ventilator (no electronic or electrical device considered)
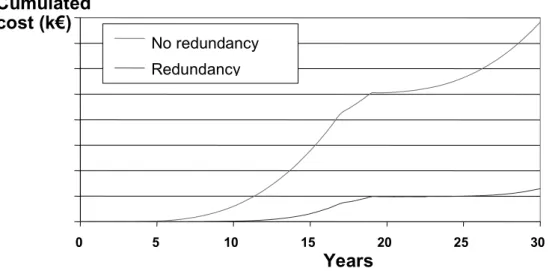
To calculate the probable cost of penalties, several design choices were available including possible redundancy of ventilators (Figure 15.6).
Figure 15.6. Cumulative cost of residual risk of unavailability due to failure of ventilators depending on the design choices
15.2.3. Results
The approach taken has helped to assign a financial cost to the risk of unavailability associated with performance requirements, in terms of quality and
0% 10% 20% 30% 40% 50% 60% 70% 80% 90% 100% 0 10 20 30 40 50 Years 0 0.005 0.01 0.015 0.02 0,025 0.03 0.035 0.04 0.045 0.05 Pdf
Initial cumulative probability of failure Cumulative probability of failure with replacement after 15 years
Probability density function (Pdf)
Replacement Probability of failure 0 200 400 600 800 1000 1200 1400 1600 0 5 10 15 20 25 30 Years no extra ventilator 1 extra ventilator No redundancy Redundancy Cumulated cost (k€)
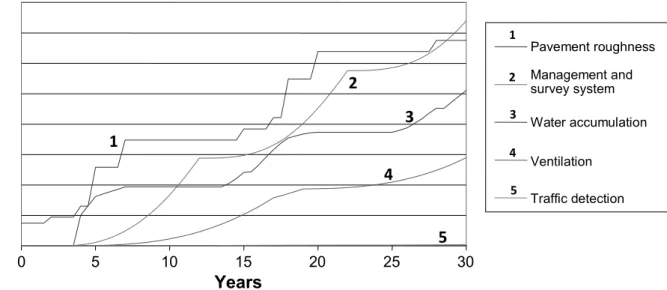
comfort for users, throughout the concession period. For each requirement, the accumulation of penalties has been estimated to determine the full cost penalties associated with the residual risk of unavailability considering the planned maintenance (Figure 15.7).
Figure 15.7. Cost of residual risk of unavailability for different requirements
Figure 15.8. Cost of residual risk associated with unplanned unavailabilities of the road
The calculation of the total cost of penalties for unavailability was used to validate design choices: between an optimum design resulting in less downtime but with higher initial cost (e.g. redundant systems) and the gain provided by this solution in terms of cost of risk associated with these penalties. Similarly, the
0 5 10 15 20 25 30 Years Pavement roughness Management and survey system Water accumulation Ventilation Traffic detection 2 1 3 4 5 5 4 3 2 1 Residual risk cost (k€) 0 5 10 15 20 25 30 35 40 0 2 4 6 8 10 12 14 16 18 20 22 24 26 28 30 Years Risk of unavailability cost (M€)
type 1 type 2 type 3 type 4 type 5 Requirement 5 1 2 3 4
residual cost of risk was also calculated by considering different maintenance intervals.
At the end of the study, the contractor obtained a probabilistic estimate of the penalties they would have to pay with costs distributed over the 30 years of operation. This allows identification of periods where preventive maintenance would have to be done to avoid “peaks” of failure. The results obtained lead to a quantitative view of the residual risk associated with unplanned unavailability of the motorway network. In addition, knowledge of the potential penalty distribution for the next 30 years enables the optimized programming of budgets.
The resulting value of around €35 million over 30 years (averaging close to €1 million per year) is significant compared to the magnitude of the total project cost of approximately €500 million. This result is related to the very high penalties for non-compliance with the availability criteria. The benefit of such a comprehensive approach to infrastructure lifecycle management applies to the building owner, prime contractor, contractor or operator. In all cases, the method has many advantages:
– clear definition of performance objectives, criteria and associated indicators; – clear allocation of responsibilities to each party;
– transparency towards the identified risks and their methods of treatment (who is responsible? What actions should be implemented?)
– argued defense of budgets;
– optimization of the total costs of infrastructure projects in relation to the entire life cycle;
– consideration and preservation of the specific stakes of each party;
– risk-based monitoring and maintenance of infrastructure driven by the dual consideration of ageing mechanisms and impacted stakes, according to the parties and the periods considered.
This example shows the importance of proper consideration of short-term choices (design, construction methods) and short-term stakes (from day-to-day availability), and the long-term implications of these choices (maintenance costs and condition of the structure at the end of the concession contract) as well as long-term challenges (asset condition, sustainable management).
15.3. Ageing of civil engineering structures: using field data to update predictions
15.3.1. Background and stakes
Risk management of ageing assets, particularly civil engineering infrastructure, is an important issue for the future. The technical challenge is not only to build new infrastructure but also to maintain what already exists because the economic stakes are considerable. The prediction of ageing through modeling allows management of the risks associated with the expected service life of infrastructure. The use of updating techniques enables the best use to be made of monitoring instrumentation and inspection data in order to define optimized maintenance strategies. Benefits for the asset owners include better risk management and savings on maintenance budgets. To anticipate and optimize these costs, it is necessary to use ageing models which are as representative as possible of the real physical asset, and input data which is as reliable as possible.
In the field, some characteristic ageing parameters can be measured more or less accurately. Bayesian approaches (Chapter 11, section 11.3) are a technique well adapted to this type of problem to update the ageing prognosis. This kind of prediction is generally based on the use of physical models where various parameters of the models may be uncertain. This uncertainty can be divided into two types:
– the inherent variability of these parameters, such as the compressive strength of concrete which will vary within a single mix because of the heterogeneity of the material;
– uncertainty of measurement linked to the device used to quantify the parameter or a lack of knowledge about these parameters.
In practice, some physical material characteristics can be measured, as well as the consequences of ageing. However, like any measurement, these parameters have some uncertainty. In addition, there are generally relatively few measurements made because the techniques are expensive and of varying accuracy. It is therefore important to use them effectively with proper data processing. Bayesian methods can be used to process data and update the ageing prognosis.
15.3.2. Corrosion risk of a cooling tower
The physical phenomenon considered here is the carbonation of concrete. Carbon dioxide from the atmosphere penetrates concrete due to its porosity and dissolves in the pore solution. The carbonic acid formed then reduces the pH of the
concrete. If the carbonation front reaches the rebars, they are no longer protected by the highly basic pH of sound concrete and will therefore gradually be affected by corrosion. Corrosion is the most common cause of deterioration of reinforced concrete structures and also the most expensive to repair. It is therefore crucial to assess the risk of corrosion to optimize the maintenance of structures that may be susceptible to this pathology [ELL 95].
The example presented here concerns a nuclear plant’s cooling tower [CAP 07]. Considering the dimensions of the structure (height greater than 100 m) and the environment to which it is subject over time (wetting/drying cycles, temperature gradients, moisture, etc.) material properties and solicitations vary in time and space. During an inspection campaign after 25 years of operation, samples of concrete were taken from the structure. The values of compressive strength and carbonation depth were measured and are summarized in Table 15.1.
Mean value Standard deviation Number of measurement
Compressive strength Rc (MPa) 48.8 4.7 15
Carbonatation depth X (mm) 6.3 2.8 9
Table 15.1. Statistics derived from the experimental campaign
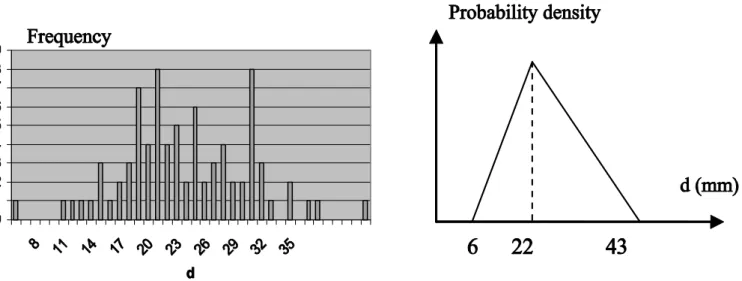
In parallel, measurements of concrete cover (d) were also carried out (see Figure 15.9).
Figure 15.9. Experimental data and modeling of the statistical distribution of concrete cover (d)
An exhaustive visual inspection of the structure was carried out to measure the total length of the unprotected steel reinforcement. Rebar corrosion causes cracking of the concrete cover because the volume occupied by the corroded steel is larger than that occupied by sound steel. The inspection determined that the total length of exposed steel was 115 m out of a total of about 500 km of reinforcing steel in the whole outer wall of the cooling tower. This means the order of magnitude of the proportion of exposed rebars to the cumulated length of steel is 10-4. We can therefore deduce that the real proportion of corroded reinforcement at 25 years is greater than this value of 10-4 because a certain amount of steel is corroded without external signs, i.e. having yet reached the pressure needed to produce cracking or spalling of the concrete cover.
15.3.3. Bayesian updating
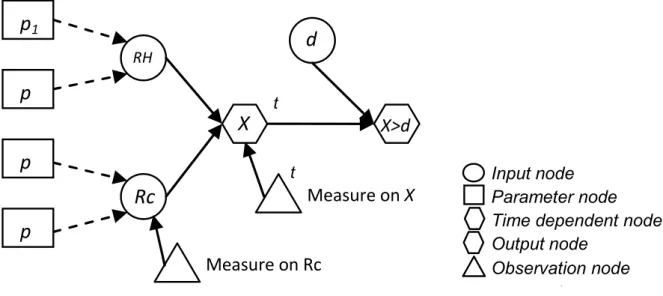
To cope with uncertainty about the parameters of the carbonation model used to describe the evolution of phenomena and reflect data from the experimental field, an updating technique based on a Bayesian network was developed using a Monte Carlo Markov Chain (MCMC) approach, given the available measurements at different nodes of the network (Figure 15.10).
Figure 15.10. Bayesian network used for the carbonation model (RH: relative humidity)
The graph of this Bayesian network represents a carbonation model developed to calculate the probability of corrosion initiation of steel in reinforced concrete considering existing measurements of Rc (concrete compressive strength) and X (depth of carbonation). Nodes linked by solid lines represent physically dependent random or deterministic variables; the dotted lines represent the links between random variables and parameters. The model inputs, i.e. RH (relative humidity) and
Input node Parameter node Time dependent node
t Measure on Rc p1 p p p RH Rc Measure on X X X>d d t t Input node Parameter node Time dependent node Output node
Rc (compressive strength), are modeled by conditional laws depending on a number of parameters p 1, ..., p 4. Each of these parameters is modeled by a random variable.
Each measurement is modeled by a random variable depending on the input it measures. In addition, the output variables X (depth of carbonation) and X> d (limit state function: depth of carbonation X greater than concrete cover d = initiation of corrosion), and measurement variables of X , depend on time t.
To calculate the probability of corrosion initiation over time, a Beta distribution law has been postulated for the variability of the compressive strength according to data from Table 15.1 and the fact that, physically, this parameter is bounded by minimum and maximum values (estimated from Table 15.1).
A deterministic approach is not capable of representing the apparent ratio of corroded steel observed on the structure (approximately 10-4 after 25 years) as it does not take into account the variability that affects the corrosion process. The probability of corrosion initiation obtained by using the carbonation model in the probabilistic approach gives a value of about 10-2 after 25 years. This value is higher than the observed ratio because it does not correspond to the same indicator: the corrosion process has to be sufficiently advanced (a certain amount of corrosion products i.e. of steel loss) before cracks appear at the surface of the structure. The order of magnitude predicted here is a good estimate if we consider that cracks appear for a loss of steel cross-section of about 100 to 200 μm.
Figure 15.11. Probability of corrosion initiation over time, P(X(t) > d)
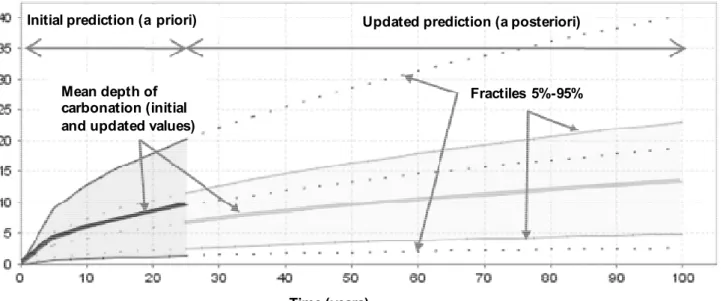
A Bayesian network is a probabilistic graphical model that can acquire and use information to update system knowledge. In this example, forecasting the evolution of carbonation depth based on experimental data collected after 25 years of
operation and estimated initial data has been updated (Figure 15.12). Compared to the initial prediction of carbonation depth, it can be seen that feeding field data into the updating process has led to a decrease of the mean value but also the uncertainty associated to the carbonation front (time fractiles at 5 and 95% are closer to the mean).
Figure 15.12. Initial and updated evolutions of the depth of carbonation (mean value and fractiles at 5% and 95%)
The use of techniques such as Bayesian networks, amongst others, is a useful way to consider real data from the field. These tools help to update the knowledge of the system, and then to predict its future state, which is particularly interesting for the aim of optimizing maintenance actions, for example. These techniques are particularly useful when few data are available (meaning the statistical approach is difficult to implement). Nevertheless, despite the usefulness of this type of approach, it must be noted that the model must be as representative as possible in its description of the phenomena modeled in order to be reliable.
15.4. Conclusion
In the global process of the management of maintenance of civil engineering structures, there are opportunities for optimization from the design stage to the extension of the life span, as illustrated by the two previous examples.
Like any complex system evolving with time, there is some uncertainty about the condition of structures and, generally, few experimental data to characterize them as these are costly to obtain and may require costly unavailability periods.
Carbonation front X (mm)
Initial prediction (a priori) Updated prediction (a posteriori)
Time (years)
Fractiles 5%-95% Mean depth of
carbonation (initial and updated values)
Therefore, numerical modeling of the ageing process is one solution for the structure’s owner to estimate the future evolution of their asset. Many uncertainties exist related to the parameters of these models, and reliability approaches can provide richer results for decision-making than purely deterministic approaches. When field data exist, it is possible to update the initial prediction and therefore adapt the planned maintenance schedule. The combination of these different approaches enables the acquisition of a maximum amount of elements that are helpful for the manager in their decision-making process.
15.5. Bibliography
[AUG 09] AUGE L., CORNISH-BOWDEN I., GERARD B., FRENETTE R., “Exploitation d’une
concession autoroutière à fortes exigences de performances: maîtrise du coût des risques associés”, GC’09 – Cycle de vie des ouvrages: une approche globale. ESTP Cachan, France, 2009.
[BOE 09] BOÉRO J., SCHOEFS F., CAPRA B., ROUXEL N., “Technical management of French
harbor structures – part 2: Current practices, needs, experience feedback of owners”,
Paralia, no. 2, p. 7.1-7.12, 2009.
[CAP 07] CAPRA B.,LE DROGO J.,WOLFF V., “Reinforced concrete corrosion: application of
bayesian networks to the risk management of cooling towers in nuclear plants”,
CONSEC’07, Tours, France, June 4-6 2007.
[ELL 95] ELLINGWOOD B.R.,MORI Y., “Reliability-based service life assessment of concrete
structures in nuclear power plants: optimum inspection and repair”, 13th International
Conference on Structural Mechanics in Reactor Technology (SMiRT 13); Brazil, p.
529-537, August 13-18 1995.
[ENR 98] ENRIGHT M.P.,FRANGOPOL D.M., “Probabilistic analysis of resistance degradation
of reinforced concrete bridge beams under corrosion”, Engineering Structures, 20(11), p. 960-71, 1998.
[GUE 99] GUEDES-SOARES C.,GARBATOV Y., “Reliability of maintained, corrosion protected
plates subjected to non-linear corrosion and compressive loads”, Marine Structures, 12, p. 425-445, 1999.
[HAG 91] HAGEN O., TVEDT L., “Vector process out-crossing as parallel system sensitivity
measure”, Journal of Engineering Mechanics, 117(10), p. 2201-2220, 1991.
[KAL 04] KALLENA M.J., VAN NOORTWIJK J.M., “Optimal maintenance decisions under
imperfect inspection”, Reliability Engineering and System Safety, p. 1-9, 2004.
[LAN 05] LANNOY A., PROCACCIA H., Evaluation et maîtrise du vieillissement industriel,
TEC & DOC, Lavoisier, Paris, France, 2005.
[MOR 01] MORI Y.,NONAKA M., “LRFD for assessment of deteriorating existing structures”, Structural Safety, 23, p. 297-313, 2001.
[NAK 02] NAKANISHI S., NAKAVASU H., “Reliability design of structural system with cost
effectiveness during life cycle”, Comp. and Industrial Engrg, 42, p. 447-456, 2002.
[SCH 91] SCHALL G., FABER M.,RACKWITZ R., “The ergodicity assumption for sea states in
the reliability assessment of offshore structures”, J. Offshore Mechanics and Arctic
![Figure 15.1. Pyramid of needs for the management of industrial assets (from [BOE 09])](https://thumb-eu.123doks.com/thumbv2/123doknet/8039356.269504/3.892.187.714.647.1089/figure-pyramid-needs-management-industrial-assets-boe.webp)
![Figure 15.2. Studied system: existing and new tunnel (from [AUG 09])](https://thumb-eu.123doks.com/thumbv2/123doknet/8039356.269504/6.892.77.818.615.794/figure-studied-system-existing-and-tunnel-from-aug.webp)
![Figure 15.3. Cumulative probability of unavailability due to the roughness of the pavement [AUG 09]](https://thumb-eu.123doks.com/thumbv2/123doknet/8039356.269504/8.892.107.816.45.299/figure-cumulative-probability-unavailability-roughness-pavement-aug.webp)