Methodology
for socioeconomic
impact assessment
of phytosanitary
measures and
application
Guide
Methodology
for socioeconomic
impact assessment
of phytosanitary
measures and
application
Guide
Montevideo, Uruguay - 2019
Editorial coordination: Lourdes Fonalleras and Florencia Sanz Translator: Miguel Barbosa Fontes
Layout: Esteban Grille Cover design: Esteban Grille Digital printing
Methodology for socioeconomic impact assessment of phytosanitary measures and application Guide / Inter-American Institute for Cooperation on Agriculture, Comité Regional de Sanidad Vegetal del Cono Sur, John Snow / Brasil, Consultoría. – Uruguay : IICA, 2019. 42p.; A4 21cm X 29,7cm.
ISBN: 978-92-9248-835-2
Published also in Spanish and Portuguese
1. Phytosanitary measures 2. Impact assessment 3. Socioeconomic environment 4. Risk management 5. Methodology I. IICA II. COSAVE III. JS/Brasil Consultoría IV. Title
AGRIS DEWEY
H10 632.9
Inter-American Institute for Cooperation on Agriculture (IICA), 2019
Methodology for socioeconomic impact assessment of phytosanitary measures and application Guide by IICA is published under license Creative Commons
Attribution-ShareAlike 3.0 IGO (CC-BY-SA 3.0 IGO) (http://creativecommons.org/licenses/by-sa/3.0/igo/) Based on a work at www.iica.int
IICA encourages the fair use of this document. Proper citation is requested.
This publication is available in electronic (PDF) format from the Institute’s Web site: http://www.iica.int
ACKNOWLEDGMENTS
Methodology for Socioeconomic Impact Assessment of phytosanitary measures was developed as a result of the component oriented to generate tools and build capacity to assess the impact of phytosanitary measures implemented by countries, in the framework of STDF / PG / 502 Project “COSAVE: Regional Strengthening of the Implementation of Phytosanitary Measures and Market Access”.
The beneficiaries are the Southern Cone Plant Health Committee (COSAVE) and The National Plant Protection Organizations (NPPOs) of its seven member countries. The Standards and Trade Development Facility (STDF) fund it, the Inter-American Institute for Cooperation on Agriculture (IICA) is the implementing organization and the International Plant Protection Convention (IPPC) Secretariat supports the project. The editorial coordination was in charge of Maria de Lourdes Fonalleras and Florencia Sanz.
Maria de Lourdes Fonalleras, Florencia Sanz and Miguel Fontes as team coordinator consultant JS/Brasil, have defined the original structure of this document.
The content development and the translation of this document into English, corresponds to the team of specialists of JS/Brasil hired specially for the project: Miguel Fontes, Rodrigo Laro, Andrea Stancioli, Gustavo Robaina and Ignacio Simon.
The technical readers that made important contributions to the content are the specialists of the NNPO’s participating in the project:
Diego Quiroga, Francisco Leprón, Héctor Medina, Pablo Frangi, Wilda Ramírez, Yanina Outi from Servicio Nacional de Sanidad y
Calidad Agroalimentaria – SENASA from Argentina;
Luis Sánchez Shimura, Douglas Kohler Cuellar, Freddy Adolfo Ramos Adrián, Immer Adhemar Mayta Llanos, Ramiro Jiménez Duran from Servicio Nacional de Sanidad Agropecuaria e Inocuidad
Alimentaria – SENASAG from Bolivia;
Álvaro Antonio Nunes Viana, Ángela Pimenta Peres, Augusto Carlos dos Santos Pintos, Eriko Tadashi Sedoguchi, Graciane Goncalves Magalhaes de Castro from Secretaria de Defensa Agropecuaria
SDF-MAPA from Brasil;
Rodrigo Astete, Claudia Vergara, Fabiola González, María Daniela Buzunariz Ramos, Ruth Arévalo, Tamara Gálvez Reyes from Servicio
Nelson Fariña, Ana Teresa González, Erika Galeano, Julio Rojas, María Eugenia Villalba Sandoval from Servicio Nacional de Calidad,
Sanidad Vegetal y de Semillas – SENAVE from Paraguay;
Enne María Carrillo Esquerre, Ezequiel Félix Quenta Cherre, Gladys Quiroz, Orlando Antonio Dolores Salas, Waldir Arbildo Ramírez
from Servicio Nacional de Sanidad Agraria – SENASA from Perú;
Mario De Los Santos, María José Montelongo, Leticia Casanova
from Dirección General de Servicios Agrícolas – DGSA - MGAP from Uruguay.
We express special appreciation to all of them.
We also thank the support received from the IPPC Secretariat for the implemen-tation of this component of the project.
INDEX
Acronyms ... 6
I. Introduction ... 7
II. Context and importance of impact assessment for phytosanitary measures ... 9
Evaluation is not audit ... 13
Ethics during the assessment process ... 13
III. Socioeconomic Impact Assessment Methodology ... 14
STAGE 1. Construction of the logical framework ... 16
STAGE 2. Elaboration of assessment research instruments ... 17
STAGE 3. Data collection ... 17
STAGE 4. Impact analysis ... 17
COMPLEMENTARY STAGE. Stakeholder Communication ... 18
IV. MEIS Application Guide ... 19
STAGE 1. Process for the development of the logical assessment framework ... 20
STAGE 2. Step-by-step preparation of collection tools ... 23
STAGE 3. Step by step data collection ... 25
STAGE 4. Financial, economic and social analysis ... 26
COMPLEMENTARY STAGE ... 38
Glossary ... 39
ACRONYMS
COSAVE Southern Cone Plant Protection Committee (COSAVE by its acro-nym in Spanish)
DAC Development Assistance Committee
DGSA Dirección General de Servicios Agrícolas from Uruguay GATT General Agreement on Tariffs and Trade
IBRD International Bank for Reconstruction and Development IICA Inter-American Institute for Cooperation on Agriculture
IMF International Monetary Fund
IPPC International Plant Protection Convention
MAPA Ministério da Agricultura, Pecuária e Abastecimento from Brasil MEIS Socioeconomic Impact Assessment Methodology (MEIS by its
acronym in Spanish)
NPPO National Plant Protection Organization
OECD Organisation for Economic Co-operation and Development PRA Pest Risk Analysis
RPPO Regional Plant Protection Organization SAG Servicio Agrícola y Ganadero from Chile
SDF Secretaria de Defensa Agropecuaria from Brasil
SENASA Servicio Nacional de Sanidad y Calidad Agroalimentaria from
Argentina
SENASA Servicio Nacional de Sanidad Agraria from Perú
SENASAG Servicio Nacional de Sanidad Agropecuaria e Inocuidad Alimentaria
from Bolivia
SENAVE Servicio Nacional de Calidad, Sanidad Vegetal y de Semillas from
Paraguay
SPS Agreement Agreement on the Application of Sanitary and Phytosanitary
Measures
STDF Standards and Trade Development Facility UN United Nations
USAID United States Agency for Cooperation WTO World Trade Organization
I.
INTRODUCTION
Several international studies, as we will present throughout this document, already provide evidence of the economic and social impacts of phytosanitary measures for the control of various pests. Therefore, it is important to emphasize that phytosan-itary measures do not constitute an expense or merely a cost to the public sector. Quite the contrary, they represent an important investment to ensure the sustain-able development of agricultural production, marketing and export of countries. However, it is up to organizations to demonstrate socioeconomic returns to society. Measures that are not monitored and evidence-based in terms of their cost-efficacy and their economic and social returns can be questioned in the medium to long term. In this context, the standardization of practices of assessments of phytosanitary measures contributes to the demonstration of its returns and impacts and must be incorporated in the routines of implementation of these measures.
This is even more significant with the reduction of public budgets in several coun-tries for activities that are even considered priorities, such as health and education. With the scarcity of resources, stakeholders seek evidence, increasingly significant, of the real need for public measures of phytosanitary control.
Impact assessment is a major challenge as it should measure its actual contribution to society. In addition, it is known that the indicators to be used depends on the type of intervention that is being developed to reduce the risks of dissemination of specific pests. However, best practices serve as tools for the construction of impact assessment cycles. That is, there is no way to standardize content, but rather to use the concepts and assessment tools already widely recognized in the international literature.
The Plant Protection Committee of the Southern Cone (COSAVE in spanish) is a Regional Plant Protection Organization (RPPO), which was created by an agreement among the governments of Argentina, Brazil, Chile, Paraguay and Uruguay with the subsequent inclusion of Peru and Bolivia. It operates as an intergovernmen-tal coordination and harmonization of actions that seek to solve phytosanitary problems of common interest for its Member Countries and strengthen regional phytosanitary integration 1.
COSAVE promotes the adoption of impact assessment mechanisms. Therefore, Project STDF / PG / 502 “COSAVE: regional strengthening for the implementation of phytosanitary measures and market access”, has as one of its outputs the generation of tools and strengthening of capacities to evaluate the impact of the phytosani-tary regulation that the countries apply to maintain or improve the phytosaniphytosani-tary condition, consequently improving access to markets and commerce.
This manual proposes the use of the Socioeconomic Impact Assessment Methodology and the Application Guide as a tool by public managers in their countries for the implementation of impact assessment of phytosanitary measures. It is intended 1 Official site Recovered (17.10.2018): http://www.cosave.org/pagina/bienvenidos-al-comi-te-de-sanidad-vegetal-cosave
for all of those who coordinate the monitoring and evaluation procedures of the pest control systems.
This document aims to present the structure and the step-by-step process of im-plementation of socio-economic impact assessment cycles targeting phytosanitary measures.
A logical subdivision was used for this document, starting with a contextualization on impact assessments for phytosanitary measures and the definition of interna-tionally established standards for impact assessments.
The second part presents the structure of the socioeconomic impact assessment methodology for phytosanitary measures, including the process towards the de-velopment of a complete cycle of an impact assessment. It also defines the main evaluation components to be adopted for the standardization of evaluative practices for specific phytosanitary measures.
In the third part, there is an Application Guide with the main steps to carry out the assessment defined in the methodology: construction of a logical framework, preparation of forms for data collection, definition of data collection strategies and formulas for analysis of cost-efficacy (management), cost-benefit (economic) and equity (social).
Throughout this third part, examples identified in the international literature, including some from the health sector, are presented so readers can have exam-ples of the actual application of the impact assessment concepts included in this manual. The bibliography used is also presented at the end of the document for further references.
At the end of the guide, a glossary is presented with the main concepts, terminol-ogies and references and the bibliography.
II.
CONTEXT AND IMPORTANCE
OF IMPACT ASSESSMENT FOR
PHYTOSANITARY MEASURES
The United Nations (UN) was created in 1945 after the end of World War II by countries that volunteered to work for world peace and development. One of the characteristics of the post-World War II period is economic liberalization and with this, it was necessary to create an institution with the objective of regularizing mul-tilateral international trade. Therefore, during the creation of the UN, two other economic institutions were founded: the International Monetary Fund (IMF) and the International Bank for Reconstruction and Development (IBRD). Furthermore, since 1947 and after several rounds of negotiations, the General Agreement on Tariffs and Trade (GATT) was used as the basis for the creation of the World Trade Organization (WTO) in 1995.
During that same year, the Agreement on Agriculture was reached, which sought to guide market policies and reform trade targeting agricultural products. Also, at that same time, the Agreement on the Application of Sanitary and Phytosanitary Measures began to define and established the criteria to guide governments in the adoption of sanitary and phytosanitary standards, to protect human health, animals and plants and reduce barriers to trade.
The mechanism responsible for standardizing plant health is the International Plant Protection Convention (IPPC), which is a multilateral treaty that includes the International Standards for Phytosanitary Measures2 (ISPM). Based on these measures, country
members cooperate to combat and prevent the spread of plant plagues and their products and agree to implement phytosanitary measures that are technically strong and should not be used as technical barriers to international trade.
Phytosanitary measures3, by definition of the IPPC, are any official legislation,
reg-ulation or procedure intended to prevent the introduction and/or dissemination of quarantine pests, or to limit the economic impact of regulated non-quarantine pests. One of the principles of the SPS Agreement is harmonization of norms, in which its members agree to adopt phytosanitary measures that are based on inter-national standards, guides and recommendations. This promotes a single standard, resulting in more transparency and comparability during commercial negotiations. Each SPS member has its National Plant Protection Organization (NPPO) which is responsible for national phytosanitary regulation and enforcement.
NPPOs from geographically neighboring countries can merge and create a Regional Plant Protection Organization (RPPO) with the main objective of harmonizing phy-tosanitary measures and procedures and promoting integrated activities to define and attempt to solve phytosanitary problems of common interest for all Member States. One example is the Plant Protection Committee of the Southern Cone, the Cosave4,
formed by the NPPOs of Argentina, Bolivia, Brazil, Chile, Paraguay, Peru and Uruguay. 2 Available in: https://www.ippc.int/en/core-activities/standards-setting/ispms/
3 IPPC - ISPM nº5: Glossary of phytosanitary terms, Rome, FAO; 2009.
4 Official Site recovered (17.10.2018) COSAVE: http://www.cosave.org/pagina/bienveni-dos-al-comite-de-sanidad-vegetal-cosave
Quarantine pests are classified as absent and present. Absent quarantine pests are those that are not yet present in the country or in a particular risk area, but if they are introduced to that country or area have the potential to cause significant economic damage. The present quarantine pests are those of economic impor-tance that have been already introduced, but are not widely disseminated and can be controlled under official norms and regulations. There are also regulated non-quarantine pests, which result in significant damage to plans with significant economic impact.
For all pests, phytosanitary measures are then established. According to the concept suggested above, they are created for both pests that are present in the country and those that are absent, provided they have been regulated by the NPPO. Moreover, in order to establish these measures and to guarantee an adequate level of protection, it is necessary to take into account the potential damages caused by the presence of the pest. Some of these damages include a decrease of productivity and an increase of the cost of production, increase of the price of the products, closure of production sites, disruption of productive chains, raise of restrictions to international trade, reduction in exports, and market closure for local products.
Generally, for a pest to be regulated, a scientifically based biological and economic assessment study is carried out called Pest Risk Analysis (PRA) in which the poten-tial risk of economic damage and the intensity of the phytosanitary measures are assessed. It is common for this risk assessment to be made qualitatively based on consultations with specialists and bibliographic material that report on findings about pest’s risks. These risks are classified as high, medium or low and rarely have any real and empirical measurement of economic impacts.
In the framework of STDF project are four outputs to strengthen the capacity of phytosanitary measure implementation: 1) Strengthen phytosanitary surveillance (general and specific); 2) Strengthen the capacities of pest risk analysis; 3) Strengthen phytosanitary inspection and certification capabilities; 4) Evaluate the impact of the implementation of phytosanitary measures. These outputs condense the project aim that proposes to generate tools and develop capacities that allow the beneficiary countries to improve the implementation of their phytosanitary measures with a regional and novel approach 5.
Quantitative analyzes of the economic damage potential of pests can yield important information to assist NPPOs. This information may contribute to the decision-mak-ing process for the adoption or not of phytosanitary measures, to determine the intensity of these measures and allow a better strategic definition and budgetary planning. Also, it always relates to the objectives set by the IPPC: to prevent the spread of pests and to ensure that the adoption of measures has the least possible impact on international trade.
Although the advantages that economic and even social impact assessments may have in contributing to the improvement of the plant protection service and to the phytosanitary protection of the countries are widely recognized, it is also clear the difficulty of measuring these impacts broadly and accurately. Therefore, it is necessary the participation and collaboration of experienced professionals in the area of plant health and in the economic and social areas. It is also necessary the development of a database with reliable and constantly updated information to foster decision-making.
According to the OECD Development Assistance Committee (DAC), define evalua-tion as:
[…] a systematic and objective process for assessing a project, pro-gram or policy, its design, its implementation and results. It is aimed at determining the relevance and degree of achievement of objectives as well as its efficiency, efficacy, impact and sustainability. An evalu-ation should provide credible and useful informevalu-ation and enable the lessons learned to be incorporated into the decision-making process of beneficiaries and donors 6.
The definitions on program evaluation are diverse. They may have a more general approach or be depended upon the evaluative purpose. Therefore, the objective of the evaluation must be linked to clear goals and indicators, so that the evaluative modeling can be detailed and performed. Evaluative studies have the potential to generate knowledge for a broad and contextualized understanding of the programs, as well as for the analysis of the decision process, generating conditions for its governance and sustainability (Bodstein et al, 2006).
The actual mechanisms for and evaluative process can include different approach-es, such as:
• Review and re-examine, with critical judgment, the rationale of the programs
for their objectives and strategies, in order to overcome identified limitations;
• Compare the achievement of actual goals with those pre-established,
identi-fying the reasons for success and failure;
• To verify the cost, efficacy and efficiency of the procedures used in the
execu-tion of the program and the quality of the managerial performance;
• Verify the economic efficiency and reduction of social differences provided
by the program;
• Check the impact that the achievement of goals has brought to society.
On the other hand, the objective of the evaluation must be linked to clear goals and indicators, so that the evaluative modeling can be detailed and implemented. Initially, the objectives of the project must be defined, as well as defined stakehold-ers and responsible professionals for each goal, in addition to the time needed to reach them. Next, information and indicators are defined and selected, which should be prioritized in order to meet the evidence demands from the main stakeholders of the initiative. The necessary data collection is then performed to answer the questions related to the indicators to be evaluated and the data are then stored and processed in order to be used for different analyzes. Information is analyzed, clarified and organized in order to assess if the results were achieved, identifying the best practices and pointing out correlations and changes that have occurred over time at the level of individuals, families, communities, groups or institutions. Finally, these results of the analysis are communicated to the stakeholders of the project in the form of written reports, presentations, workshops, etc.
In this sense, the questions that should be verified in this evaluation find support in Owen (2006), when it makes clear that the evaluation of programs does not only 6 Official site OECD recovered (17.10.2018) http://www.oecd.org/dac/evaluation/dcdn-dep/35882773.pdf
cover the offer or coverage of services provided by a program. For the author, the most common issues are:
a_ Has the program been implemented as planned? b_ Were the planned objectives achieved by the program? c_ Are the needs of the public served fulfilled by the program? d_ What were the unintended results?
e_ Which implementation strategies should be accountable for what impacts? f_ How can differences in implementation affect program outcomes?
g_ What are the benefits of the program, given the costs?
In addition, some international standards have already been established with the aim of standardizing the quality of evaluations. The DAC-OECD Evaluation Network in its Quality Standards for Development Evaluation lists some key features of best practices7.
Meeting the expectations of stakeholders
• The assessment meets the requirements of the contract and the expectations
of the work plan;
• The evaluation incorporates a set of standards and indicators that meet
man-agement expectations.
Build value added
• The evaluation contributes with a greater focus to the programming and to
the priority areas of action;
• The evaluation contributes to the development effort, informs the
decision-mak-ing in a timely manner and promotes learndecision-mak-ing;
• The evaluation presents and articulates the results in order to facilitate the
understanding by the partners/stakeholders;
• The evaluation presents useful results, pragmatic recommendations and lessons
learned through a participatory process that actively involves all stakeholders.
Quality of results
• The evaluation produces credible results, using appropriate design and
rig-orous methods;
• The evaluation demonstrates impartiality and objectivity, always maintaining
the principles of independence, neutrality and transparency.
Cost benefit
• The evaluation shows added value for the Organization, for the communities
and target groups;
• The evaluation reflects the fair use of human, financial and physical resources.
EVALUATION IS NOT AUDIT
Prior to the presentation of the impact assessment methodology, an important caveat should be made about the existing confusion between evaluation and audit. It is always good to remember that evaluation is not audit. While the audit is established by verification procedures if an organization has implemented a project or action within the established norms, rules and regulations (often in the form of a law), for example, for the use of resources, evaluation is an instrument which provides key inputs for improving the implementation of public policies and demonstrating their results and impacts.
ETHICS DURING THE ASSESSMENT
PROCESS
Even taking into consideration that the evaluation is not based on pre-established organizational norms (as in the case of the audit), it is worth remembering that there are international norms and conventions of ethics in evaluative research. These standards and conventions are fundamentally based on procedures that reduce the potential for bias during the evaluative cycle. The evaluation bias can occur at any time, from the definition of objectives and indicators, during the data collection and finally in the final assessment of the impacts. The evaluation cycle should focus on improving management procedures to ensure greater cost-efficacy of standards and contribute to decision-making.
Therefore, any manipulation or misrepresentation of the evaluation procedures can directly affect the results of the evaluation and bring conclusions that do not reflect reality. The consequences can be devastating, such as imbalance in the use of resources to unnecessary areas, taking resources from other areas considered fundamental, overweighting the impacts, excessive mobilization of phytosanitary agents, unnecessary expenses, among others.
III.
SOCIOECONOMIC
IMPACT ASSESSMENT METHODOLOGY
(MEIS BY ITS ACRONYM IN SPANISH)
Based on scientific principles, MEIS is an impact assessment methodology, created by JS/Brasil and adapted to the needs of the COSAVE project, which makes a wide and innovative assessment of social programs and policies, analyzing three spheres of performance: financial, economic and social. The methodology incorporates different internationally recognized assessment techniques, such as the logical framework theory of the US Agency for Cooperation (USAID)8 and the economic
pro-jection models of J. Price Gittinger9 for projects in the agricultural area. In addition, it
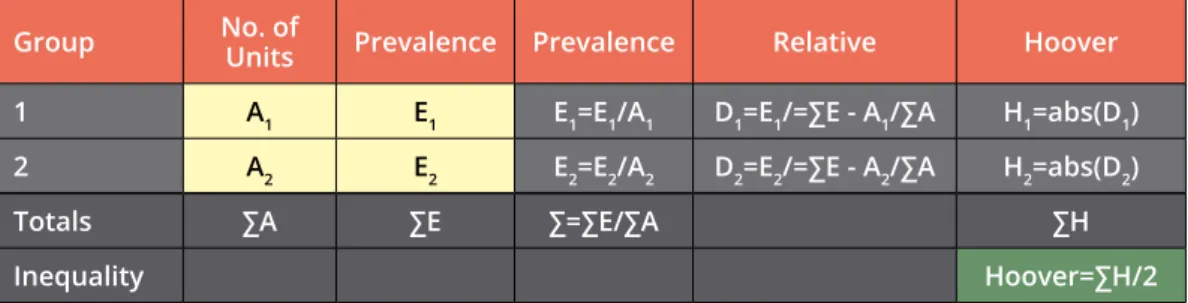
incorporates different elements of methods of economic valuation of development banks such as the World Bank. Measurement of impacts based on social indexes is also incorporated and uses equity analysis metrics (eg. Hoover index)10.
Target Audience: any initiative that has public policy strengthening objectives and
that meets at least one of the following prerequisites can be assessed by MEIS:
a_ to foster knowledge, attitudes and practices
b_ to increase the standardization and standards for the implementation of
public policies
c_ strengthen cognitive domains of target audience.
Necessary investment: 10% to 15% of the total implementation value of a new
policy.
8 Pereira, M. S. A. (2015). A utilização da matriz lógica em projetos sociais Pesquisas e Práticas Psicossociais, 10(2), São João del-Rei, julho/dezembro 2015.
9 Gittinger, J. P. (1992) Economic analysis of agricultural projects. The Johns Hopkins University Press. Maryland, USA.
10 United Nations. Development Strategy and Policy Analysis Unit. Development Policy and Analysis Division Department of Economic and Social Affairs Inequality Measurement Development Issues No. 2. October, 2015.
4.1 Financial analysis (Cost-Efficacy) 4.2 Economic analysis (Cost benefit) 4.3 Social Analysis (Reduction of inequalities)
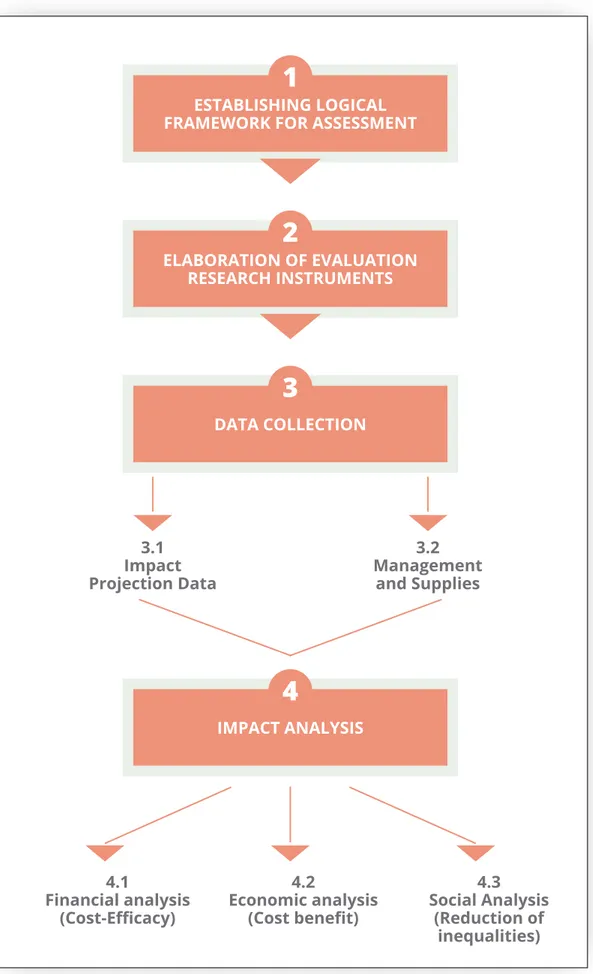
MEIS measures and identifies the transformations promoted by a new policy into four macro-steps represented in the flowchart and described below:
Figure 1: Diagram Socioeconomic Impact Assessment Methodology
1
2
4
3
3.1 Impact Projection Data 3.2 Management and Supplies ESTABLISHING LOGICAL FRAMEWORK FOR ASSESSMENTELABORATION OF EVALUATION RESEARCH INSTRUMENTS
IMPACT ANALYSIS DATA COLLECTION
STAGE 1.
CONSTRUCTION OF THE
LOGICAL FRAMEWORK
The first step in the elaboration of an assessment process based on the MEIS is the definition of the logical framework, a tool that helps to follow the steps of the implementation of a public policy. In the logical framework, all the objectives, goals, indicators, means of verification and risks of implementing the policy, as well as its inputs, activities and products must be defined.
At this stage, a workshop is held to elaborate the logical evaluative framework of the phytosanitary norm to be evaluated. Collaboration with the team of a specific phytosanitary measure managers and other important partners should be carried out to elaborate the logical framework. In this logical framework, objectives, targets, indicators and means of verification will be defined that will foster the elaboration of the research/collection instruments that will be used in the assessment.
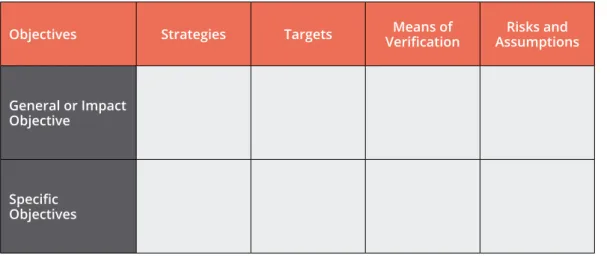
The logical framework is a management tool used to evaluate projects, programs and policies. It is a matrix in which objectives, goals, indicators, sources of verifica-tion, risks, inputs, products and activities are interrelated. It was developed in the 1970s by the USAID to respond to three common problems in public/social projects and policies (Adulis, 2002):
• Project plans were inaccurate and contained multiple objectives that were not
related to project activities;
• Difficulty in determining the extent of managers’ responsibility in the event
of project failure; and
• Lack of clarity about the expected results of the project, making it difficult to
compare and evaluate.
Currently, a number of international cooperation agencies use the logical framework, especially with the aim at having greater control over the efficacy of the programs they support, that is to make sure that the variations in financial, human and in-frastructure costs planned and used are not significant.
Table 1: Matrix with the main elements of the logical framework
Objectives Strategies Targets VerificationMeans of AssumptionsRisks and
General or Impact Objective
Specific Objectives
STAGE 2.
ELABORATION OF ASSESSMENT
RESEARCH INSTRUMENTS
This stage consists of the elaboration of questionnaires, spreadsheets and instru-ments for the search of scientific evidence that will be answered by users, (policy managers, traders, exporters, transporters, warehouses) and literature reviews (eg. impact potential of pests).
The questions for users are based on the retrospective/prospective projection of pest impacts (with and without a given policy), which in turn are based on the goals and general objective outlined in the logical framework. The questions can assess the situation found in two moments: before the implementation of the new policy (ex-ante analysis) and after its implementation. The two surveys include the exact same questions. Thus, it is possible to measure the impacts projected by the new policy, that is, what changes were observed
The questionnaire for this analysis includes two parts: the first, of a socioeconom-ic nature, contains data such as production, productivity, areas worked, etc. The second one asks questions about the potential impacts of the problems that the new policy intends to remedy or avoid. The answers provided will help to set up the phytosanitary projection model of policy impact, that is, the changes promoted or situation preserved by that initiative in the life of the target populations and the production capacity of a given geographic area. It will clearly point out and measure the efficacy and efficiency of various activities.
In addition to the impact data collection, it is also necessary to collect data with policy managers. These data are important for management reviews and the assessment of economic impact. The questionnaires must be answered by all organizations involved in the implementation of phytosanitary measures. In different tables, managers need to indicate in detail all expenditures made with inputs, the scope of the measures they are responsible for, among others. Some input data will also be surveyed in the marketplace so that it is possible to make a comparison to check for price market distortions.
STAGE 3.
DATA COLLECTION
The collection of data on phytosanitary epidemiology is carried-out with information generated by the scientific literature and on the basis of the existing data systems of the countries. In many cases, this survey is performed by agents who collect field data in their daily routines. However, this information may come from the private sector and civil society. In addition, scientific data based on international literature reviews are essential to obtain projections on pest impact.
The data of the assessment instruments of management and inputs are collected in two distinct moments (planning and post-implementation of measures) at the cost centers responsible for carrying out the interventions. It is worth mentioning that it may be necessary to incorporate other instruments and data collection pro-cedures, such as for measuring satisfaction of stakeholders. This will all depend on the elements defined in the logical framework.
STAGE 4.
IMPACT ANALYSIS
In line with the most modern international assessment best practices, MEIS iden-tifies the impact of public policies in three different levels: financial, economic and social. A quick description of each level follows:
• Financial Analysis (cost-efficacy): identifies performance and possible
bot-tlenecks in policy planning and management, taking into account the specific objectives, inputs, and goals set out in the Logical Framework.
• Economic Analysis (cost-benefit): seeks to measure how much policies are
generating economic gains to society and government and how users from the productive sector will recognize the importance of the norms established by a new policy. The guiding question is: how much each monetary unit invested generates in economic returns to the society, government and the produc-tive system? Ultimately, the goal is to uncover the wealth generated by the program. The analysis is based on a first step that adjusts the financial costs to incorporate opportunity costs and adjusts financial costs to market price distortions vs. those practiced by the measure and applies different discounting factors. This should be carried-out for each of the cases studied individually. In the second step, projections of possible losses of productivity are made according to the level of risk of propagation of the pest and the calculation of the economic benefits of the measures. Finally, the assessment will define a benefit-cost ratio of the measure, including its internal rate of return and the net present economic value for society.
• Social Analysis (equity): the third and final analysis of the methodology aims
to demonstrate the impact of the policy on the social structure and quality of life of the most vulnerable groups. The study measures the situation of the beneficiary population before and after the new policy and compares the re-sults obtained with indicators of social inequality. An equity index is created to see how the implementation of a new policy impacts the most vulnerable populations or regions, reducing socio-economic inequalities. These vulner-abilities have to do with the economic (eg., labor and unemployment) and social (eg., type of families that live in agricultural units most affected in the region) profiles.
COMPLEMENTARY STAGE.
STAKEHOLDER COMMUNICATIONS
With the information and data obtained in the assessment process, a communication strategy of the assessment to various stakeholders should be established. The impacts coming from the financial, economic and social analysis will allow coordinators of the assessment process to define the main priority communication hooks for each stakeholder audience. For example, for entrepreneurs and government, the data that are frequently the most interesting relate to economic returns; for managers and agricultural agents, it is important to focus on the efficacy gaps, and so on. At this stage, the quality standards undertaken during the assessment process is translated for each stakeholder with information about the impacts of the mea-sures and the performance of the institutions responsible for their implementa-tion. Communication strategies will facilitate an integration between the scientific knowledge acquired during the assessment process and its effective use for the improvement of the program or policy.
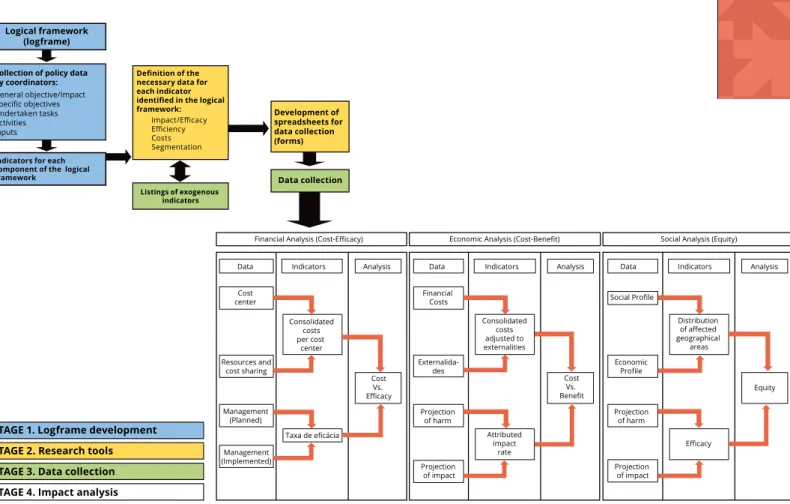
Data Indicators Analysis Cost center Resources and cost sharing Management (Planned) Management (Implemented) Consolidated costs per cost center Taxa de eficácia Cost Vs. Efficacy
Data Indicators Analysis
Financial Costs Externalida-des Consolidated costs adjusted to externalities Attributed impact rate Cost Vs. Benefit
Data Indicators Analysis
Social Profile Economic Profile Projection of harm Projection of impact Projection of harm Projection of impact Distribution of affected geographical areas Efficacy Equity Financial Analysis (Cost-Efficacy) Economic Analysis (Cost-Benefit) Social Analysis (Equity)
STAGE 1. Logframe development STAGE 2. Research tools STAGE 3. Data collection STAGE 4. Impact analysis
Logical framework (logframe) Listings of exogenous indicators Data collection Development of spreadsheets for data collection (forms) Definition of the
necessary data for each indicator identified in the logical framework:
Impact/Efficacy Efficiency Costs Segmentation
Indicators for each component of the logical framework
Collection of policy data by coordinators: General objective/Impact Specific objectives Undertaken tasks Activities Inputs
IV.
MEIS APPLICATION GUIDE
Based on the concepts and steps described for the implementation of the MEIS of phytosanitary measures, the following diagram was developed:
Figura 2. Diagram of implementation of the Socioeconomic Impact Assessment
Methodology
In this diagram, the four fundamental stages of MEIS are disaggregated to indicate the most important steps of your application. For stage 1, defining the Logical Framework of the measure, an indication of the most important steps is in blue. For stage 2, creating the data collection forms, the steps are set are in yellow. For stage 3, collection of endogenous and exogenous data, the steps are in green. And finally, for stage 4, the financial, economic, and social analyzes, a specific box was created for the descriptions of three fundamental sub-steps: 1) the definition of the data needed for the analyzes; 2) the composition of the indicators needed for the analyzes; and 3) the calculation of financial, economic and social analysis.
STAGE 1.
PROCESS FOR THE
DEVELOPMENT OF THE LOGICAL
ASSESSMENT FRAMEWORK
The process for the development of the logical framework begins with the organi-zation of a working group to discuss the main general and specific objectives of the measure to be evaluated. It is then recommended to hold a two-day workshop, with representatives of all stakeholders to define goals and indicators that should be correlated to those goals. The final output is a report including all contributions to the definition of objectives, targets and indicators and the final correlation matrix of the logical framework.
1) ORGANIZATION OF A WORKING GROUP
The coordinators of a new phytosanitary measure should organize a working group to define the general and specific objectives of a phytosanitary measure. This group can communicate by virtual means of communication (example: Trello11). However,
the active participation of all members of the group is essential. In the virtual channel of communication, it should include reference documents on the measure, forums for discussion on guiding questions to define the objectives, and the definition of responsibilities for coordination and a schedule of activities.
2) ORGANIZATION OF A LOGICAL FRAMEWORK WORKSHOP
After the organization of the working group and preliminary definition of the general objective of the measure (impact) and its specific objectives (results), a workshop of 16 hours, with representatives of the main stakeholders (Secretariats of govern-ment, international body, private sector, civil society, etc.) should be organized. It should be clear that this workshop is not for specific discussions of the measures. 11 Trello is a web tool for project management. Recovered from https://trello.com/home
Logical framework (logframe)
Indicators for each component of the logical framework
The focus should be given on the final overall definition of the impact objective and specific outcome objectives and, respectively, their goals, indicators and means of verification.
3) AGENDA AND DYNAMICS OF THE LOGICAL FRAMEWORK WORKSHOP
The workshop should take place in a space that enables accommodating a max-imum of 20 representatives, two moderators and should include the following agenda items:
FIRST DAY
1_ Introduction about the objectives and purposes of the workshop. 2_ Presentation of all participants.
3_ Rationale on the matrix of the logical framework and indicators.
4_ Discussion about the difference between impact objectives and outcomes. 5_ Definition of the general impact objective. In this item, the moderators should
request that each participant individually write their understanding of the impact objective of the phytosanitary measure on a sheet of paper.
6_ Include all contributions to a computer and project them to participants.
Moderators should read all contributions.
7_ Group consensus discussions regarding the definition of a general impact
objective.
8_ Following the definition and consensus on a single overall objective, the
tar-gets, indicators and means of verification should also be discussed for the overall objective.
SECOND DAY:
1_ Listing and projecting specific suggested outcome goals. 2_ Definition of the main specific objectives.
3_ Following the definition and consensus on the list of specific objectives, their
respective targets, indicators and means of verification should also be defined.
4) ELABORATION OF THE LOGICAL FRAMEWORK REPORT
With the completion of the logical framework matrix by the group, the facilitators should prepare a final report and pass it on to the participants for future comments, adjustments and suggestions. The final report is the first product of the evaluative cycle, but will also be used as a reference of the phytosanitary measure for future consultations.
WHAT IS A LOGICAL FRAMEWORK?
The Logical Framework can be compared to a guide that indicates the best approach and inputs needed to arrive safely at a successful imple-mentation of a policy. In reality, it interrelates several key components of an assessment cycle, such as:
• General objective: indicates the desired impact, ie the long-term situation to be achieved
• Specific objectives: are linked to the responsibilities of the managers involved in the process and can be structured according to the com-ponents of the program
• Goals: they give the quantitative reach of each managerial aspect of the program. Goals are fully linked to the general and specific objectives
• Indicators: work as a quantitative indication of a clear metric that allows managers to follow best practices and approaches. Based on these indicators, managers will know if they are moving in the right direction and how efficiently they are. However, it should not be mixed with data or information (eg number of beneficiaries). An indicator is composed of three fundamental elements: numerator, denominator and time specification.
• Means of verification: are tools that let managers know if the policy is being efficient along the way
• Risks: indicate the obstacles for implementing the assessment cycle
What’s its role at this stage?
Creating the logical framework is one of the most important milestones in MEIS. Therefore, the participation of all managers and coordinators of the policy is essen-tial. Considering only the experience of a director or coordinator can restrict and mislead indicators. This may create a significant bias in the subsequent stages of MEIS. Public managers are responsible for defining all the components of the logical framework. The evaluators facilitate the work of elaborating the logical framework and develop the final report with all the definitions.
Duration: On average, it takes one month to complete a logical framework. However,
the greater the participation and interaction of the management team and other stakeholders, the faster the preparation of the final document.
Team: At least two facilitators should work in the workshop to assist and conduct
STAGE 2.
STEP-BY-STEP PREPARATION OF
COLLECTION TOOLS (PHYTOSANITARY
AND MANAGEMENT)
For the second step, based on the indicators established in the logical framework matrix, it is necessary to define the data that will be necessary for the composition of set indicators. That is, a breakdown of these indicators is necessary to define what data will be needed during the collection process. By defining all the necessary data, a form is generated for its effective collections according to the step-by-step procedures described below.
1) DEVELOPMENT OF
PHYTOSANITARY DATA TOOLS
The instrument for the collection of phytosanitary measures must be subdivided into two parts:
1_ Phytosanitary impact profile of the measure (control variables): It is necessary
to define which crops and regions are being affected or will potentially be affected by the spread of a particular pest. The instrument should also include the search for socioeconomic information about the region and the affected agricultural culture and region. They should include questions about levels of production, marketing and export of potentially affected crops.
2_ Diagnosis and phytosanitary epidemiology: Questions about the potential
for pest spread and the current phytosanitary epidemiological conditions should also be included in the final instrument. Other questions related to the management indicators and targets established in the logical framework should also be included in the final instrument.
2) ELABORATION OF A MANAGEMENT TOOL
The management tool should include all indicators linked to the specific objectives of the logical framework. For example, if one of the indicators is rate of agents qualified for implementation of phytosanitary measures, specific cells should be included on the number of agents to be trained (denominator) and the number actually trained (numerator).
Development of spreadsheets for data collection (forms)
3) INSTRUMENT TESTING
Phytosanitary and management data instruments should be tested prior to data collection. The instruments should be socialized with the professionals involved in the implementation of the measure to check if questions are clear, simple and direct, avoiding a bias in the response. In addition, they should be shared with plant health managers and field workers to verify the validity and consistency of a baseline survey or a list of questions. With regard to validity, it must be verified whether the questions reflect the goals and indicators established in the Logical Framework. For consistency, it must be checked whether the information requested actually exists in the data systems of phytosanitary measures. If it does not exist, depending on the implementation of a new measure, the systems must be updated to include the new data fields necessary for the assessment.
SCIENTIFIC RIGOR
The phytosanitary data collection instruments are always pre-tested to verify the validity and consistency of the data. It is recommended that the pre-test be performed in at least one cost center. In addition to researching existing data systems, it is also necessary to collect data and inputs with policy managers. This information will be important for cost-efficacy analysis (management efficacy).
What’s its role at this stage?
At least two coordination managers should attend face-to-face meetings with the evaluators to define these instruments. There is also a need for managers of all cost centers to review the instrument – those who will assist during data collection and can contribute to reviewing data collection tools.
Duration: On average, a month is required for this step. Participation of program
managers is essential if deadlines are to be met.
Team: Two evaluators and two coordination managers should be mobilized for
face-to-face work, during the data collection instruments elaboration state. Also, managers of the participating cost centers willing to contribute to the review of the instruments should also be mobilized.
STAGE 3.
STEP BY STEP
DATA COLLECTION
As the indicators will always be related to impact and results, it is important to note that many exogenous data will also be needed. That is, data that are not in the con-trol of the organizational body responsible for the implementation of phytosanitary measures. In many cases, exogenous data will be available in agricultural censuses,
sociodemographic studies of research institutes and other sources.
1) IDENTIFICATION OF EXOGENOUS DATA
These data are fundamental for economic and social analysis. Therefore, some of the data may be in epidemiological studies of a pest or in market price studies. Generally, exogenous data are multidisciplinary. The clear identification and sep-aration of the data required in endogenous (controlled by implementing agency) and exogenous (controlled by other sources of information) is a fundamental step for data collection.
2) DATA COLLECTION
The process of data collection is based on the internal and external search of data that will lead to indicators being established in the logical framework based on the main sources of information. For endogenous data, financial and pest control departments should be contacted for information gathering. For exogenous data, research institutes and search engines for scientific studies should be the main sources of information.
3) DEVELOPMENT OF A DATABASE
At the end of the data search, a database with all the data collected must be gen-erated. The database should include a clear classification of data that will be used for financial, economic and social analysis. They should also be correlated with the specific indicators set out in the logical framework.
What’s its role at this stage?
Again, manager involvement is key. First, this is important to ensure that two types of instruments are being filled out correctly: management and inputs data. Managers need to complete in detail all management items included in the instrument, based on the logical framework, and their actual expenditures during the implementation of the measure. Some data will be collected in the marketplace. This will help for comparisons in relation to the amounts paid by the management organization at
Listings of exogenous indicato rs
each cost center of the program. Another important activity is the training of man-agers, who must be able to provide the information of the potential phytosanitary risk research data. Managers are also responsible for assisting in the analysis of the consistency of the database of the three surveys (impact, management and input data).
Duration: This is the most time consuming step of MEIS. The policy implementation
period defines the interval between ex-ante and ex-post data collection. This period can vary from two months to one year on average. Of course, if the policy is already in action and the data is already available, its collection is immediate. In this same time interval, the data of the management research and inputs are collected. For this stage, as well as for all others, you can also work with time control tools and activities monitoring (eg GANTT diagram).
Team: The entire team of evaluators should be mobilized at this stage. Coordination/
director also plays a relevant role. It is also necessary to have at least one respon-sible manager in each of the cost centers participating in the assessment.
STAGE 4.
FINANCIAL, ECONOMIC
AND SOCIAL ANALYSIS
This stage is subdivided into two parts: one considering the type of analysis (finan-cial, economic, and social) and another the level of analysis (data, indicator, and analysis). As shown in the diagram below, the analysis process should begin by defining the cost-efficacy of the measures, followed by the economic and social analysis. For each type of analysis, the flow should be based on the identification of the necessary data, the composition of the indicators and their correlations for a final analysis of the assessment results.
Data Indicators Analysis Cost center Resources and cost sharing Management (Planned) Management (Implemented) Consolidated costs per cost center
Data Indicators Analysis Financial Costs Externalida-des Consolidated costs adjusted to externalities Attributed impact rate
Data Indicators Analysis
Projection of harm Projection of impact Projection of harm Projection of impact Equity Social Analysis (Equity)
Step-by-step for the elaboration of the cost-efficacy analysis
(management linked to the specific objectives of the logical
framework):
1. CALCULATION OF FINANCIAL COST 1.a. Definition of cost centers:
The cost center must be clearly defined. In some countries, these cost centers are made up by representations of federal agencies that operate in specific provinces, municipalities or states; in other countries, by units of teams that are constituted for the implementation of a policy. For example, a school may constitute a cost center for an Education Department in a municipality. In another intervention, a community health team with a doctor, a social worker and a nurse can be a cost center for the implementation of a community health policy. In cases of phytosanitary measures for export and import, a cost center for cost-efficacy analysis may constitute phy-tosanitary units in ports and airports that will implement the measures.
1.b. Verification of the financial values applied in the Cost Centers:
All values transferred to and used by these decentralized phytosanitary surveillance units should be identified If this is not the organizational structure of phytosanitary surveillance, other types of cost centers can be established, such as costs by teams of phytosanitary agents. It is very important to establish cost centers for a better comparison of the social and economic returns of the phytosanitary measure. The direct costs transferred to these cost centers must be identified.
1.c. Allocation of headquarters costs
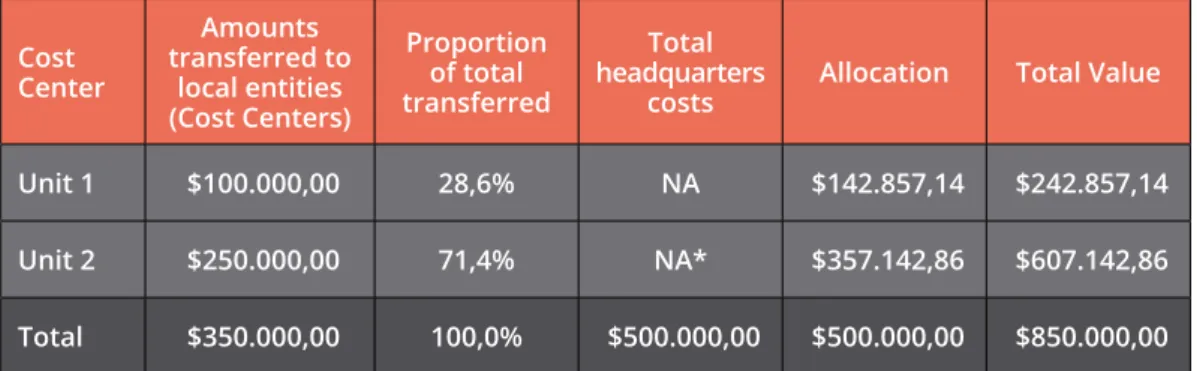
The value used to establish and monitor the phytosanitary measures of a central entity (eg ministry) should also be determined and include the costs of personnel, equipment, travel, etc. used to implement an overall supervision of the implementa-tion of a measure. After determining the total costs of the measure at headquarters, the value should be proportionally allocated to different cost centers. The table below presents a hypothetical example of allocation of headquarters financial costs:
Table 2: Example of financial values applied in cost centers
Cost Center Amounts transferred to local entities (Cost Centers) Proportion of total transferred Total headquarters
costs Allocation Total Value Unit 1 $100.000,00 28,6% NA $142.857,14 $242.857,14 Unit 2 $250.000,00 71,4% NA* $357.142,86 $607.142,86 Total $350.000,00 100,0% $500.000,00 $500.000,00 $850.000,00
* Not applicable
According to the above example, even if the amounts transferred to the units of cost centers were R $ 350,000.00, the aggregate amount reaches R $ 850,000.00. This is because out of the total amount transferred, 28.6% of the total was trans-ferred to the decentralized unit 1 and 71.4% to unit 2. These same proportions are
used to allocate all costs of the measure used by headquarters. Headquarters in this case made an investment of R $ 500,000.00 for the central administration of the measure. These costs are then proportionally allocated between the two cost center units. Therefore, the proportional allocation of headquarters costs is fun-damental so that the financial costs are not underestimated.
1.d. Definition of the beneficiary unit
For a financial analysis per beneficiary unit, it is important to establish which type of unit of analysis will be used. For example, the number of hectares in the geographical area covered by sanitary measures can be used. In this case, if the phytosanitary measures are covered by a million hectares, in Unit 1 the coverage is 400.000 hectares and the Unit 2 600.000 hectares and based on the values with the headquarters allocation suggested, the following formula should be used:
Cost per hectare = Total Value (including allocation of headquarters costs)/Coverage in hectares
In this case, he cost of the measure is set at $ 0.60 (Total Value Unit 1 / Coverage hectares) per hectare in Unit 1 and $ 1.01 (Total Value Unit 2 / Coverage hectares) per hectare in Unit 2.
2. EFFICACY ANALYSIS
2.a. Establishment of the level of efficacy for all management indicators set out in the logical framework.
In this item, the level of efficacy is assessed for all the indicators defined in the logical framework, especially in the specific objectives and inputs, according to the target ceilings, that is, the maximum targets established by the program managers for each goal. For example, if the goal set for the training component of agents was 90% and if a cost center presents evidence of only 80% of trained agents, their efficiency level will be 80% / 90 % = 0,89. That is, the cost center reached only 0.89 point of the pre-established target. If it has reached a value equal to or greater than 90%, it will have reached 1,00 point of the pre-established target.
That is, efficacy measures the efficacy of the services and inputs planned for the implementation of the policy. The level of efficacy for the indicators by cost center is measured from the calculation of the rate of efficacy indicator. Indicator data should be provided by cost centers and efficacy target ceilings (for each indicator) should be agreed and defined in the logical framework.
2.b. Definition of averages of the level of efficacy for all cost centers
After measuring the level of efficacy of each indicator, the averages of the level of efficacy for each cost center are calculated, from the level of efficacy obtained in each of the management indicators.
The average efficacy rate per cost center is calculated from the average efficacy indi-cators established. Efficiency is defined by the goal of reaching the input established
by managers at the lowest cost possible. Any variation (positive or negative) out-side the range of variation in achieving this goal proportionally reduces the final efficacy indicator. The purpose of the rate of efficacy is to measure the ability to implement the necessary measures according to preset goals established in the logical framework.
Efficacy calculation formula:
TE = (CE / CI) / M Where: CI = Installed Capacity EC = Capacity Made TE = Efficacy ratio
TIP 1:
It is important to note that, in some cases, the Capacity is greater than the Installed Capacity. Also, in other cases, the Installed Capacity or Capacity is Zero. That is, there was no adequate planning of the indicator or the level of efficacy of the indicator was zero. In such cases, the formula needs to be adjusted in the following ways:
If CI <CE, then make TE = (CI / CE) / TM If CI = CE = 0 then make TE = Zero
If CI = 0 and CE> 0 then make TE = zero If CI> 0 and CE = 0 then make TE = zero
TIP 2:
When TE> 100%, it is necessary to adjust the rate to 100%. You cannot have a TE greater than 100% for the final aggregate analysis of efficacy.
M = Reaching goal established by the program’s logical framework
After the calculation of the efficacy rate, the average efficacy rate per cost center is defined as the simple arithmetic mean of all the indicators analyzed in each cost center. For example, if there are 21 indicators of efficacy in management objectives, the formula will be:
efficacy rate=
∑
21
i=1Ii
21
Where: Ii = Eficacy indicator for each management input
3. COST EFFICACY ANALYSIS (EFFICIENCY) 3.a. Establishing the efficacy of the cost per unit of analysis in each cost center
In this step, the cost is adjusted for the loss of efficacy, that is, the cost of the cost center is divided by the efficacy rate to arrive at the management efficiency of each cost center. In other words, the lower the efficiency level, the greater the distortion of the original financial cost.
Cost efficacy measures how much the cost invested in phytosanitary measures was effectively “integrated” in its overall goals. The calculation of cost efficacy is equal to the average cost of each cost center divided by the rate of efficacy.
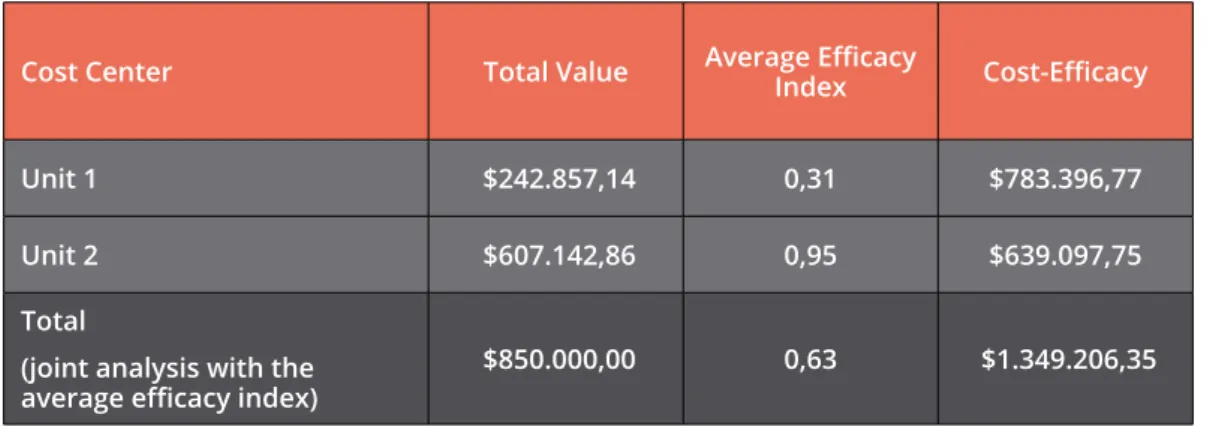
Using the previous example of cost-per-unit in Table 1 and taking into account that the level of efficacy found (% efficiency of planned management targets for implementation of the measure) in Unit 1 was 0.31 and Unit 2 was of 0.95, we would have the following cost-efficacy values:
Table 3: Example of cost effectiveness per unit of analysis in each cost center
Cost Center Total Value Average Efficacy Index Cost-Efficacy
Unit 1 $242.857,14 0,31 $783.396,77
Unit 2 $607.142,86 0,95 $639.097,75
Total
(joint analysis with the average efficacy index)
$850.000,00 0,63 $1.349.206,35
It is interesting to note that in the example above, even Unit 1 having significantly lower costs than Unit 2, its low efficacy was so significant that it resulted in a Cost-efficacy level greater than Unit 2. That is, at the end of the cost-Cost-efficacy analysis, Unit 1 is significantly less efficient compared to Unit 2.
This analysis should also be carried out by using a unit of analysis. For example, the measure by area covered by phytosanitary measures. The formula to be used in this step is as follows:
Cost-Efficacy per hectare = Value Total cost efficacy / Coverage in hectare
In this case, Unit 1 has an efficiency level of $ 1,96 per hectare (cost efficacy Unit 1/ total coverage unit 1), while in Unit 2 the efficiency (cost-efficacy) level reached $ 1,06 (cost efficacy Unit 2/total coverage unit 2. That is, even with high-level of financial costs, Unit 2 is more cost-effective than Unit 1. The main advantage of using a unit of analysis (as hectare) is that the analysis can be adjusted to incorporate aspects that may influence higher or lower costs, eg distance for phytosanitary inspections. In this case, units that need to do inspections in larger territories can adjust their cost- efficacy according to their territorial coverage.
Step-by-Step for elaborate the economic analysis (cost-benefit
related to projected impacts set by the general objective of the
logical framework):
1. ECONOMIC COST ANALYSIS
The economic cost is an adjusted value of the total financial cost of the program by an “opportunity cost” factor and other market “price distortions”.
1.a. Opportunity cost factor
“The true cost of something is what you give up to get it. This includes not only the money spent in buying (or doing) the something”12
The opportunity cost is the associated value granted to a specific resource allo-cation decision. When a decision is made, the comparative advantages are taken into account, but all other allocation decisions are discarded. In other words, the selected option represents the most significant benefit and lowest cost compared to all others.
For the analysis of phytosanitary measures, the opportunity cost is the non-financial resource used during the implementation of the measures that adds values to the financial costs of the intervention. If a cost center, for example, spends a financial value of $ 100.000 for the execution of phytosanitary measures and uses 60% of counterparts resources provided by international partners, the economic cost must include the $ 100.000 plus the counterpart contributions. This is true since the cost center values only met 40% of the implementation requirements and an extra funding was required for a full implementation of the measure.
The cost opportunity is frequently obtained from economic counterparts of cost center partners. The procedure must be carried out region by region, considering all the economic counterparts identified and engaged with the cost centers in a given region. Example: if the sum of all the expected economic counterparts of the
12 Bishop, M. (2004). Economics A-Z adapted from “Essential Economics” in The Economist. Recovered (29.10.2018) en https://www.economist.com/economics-a-to-z/o#node-21529616
phytosanitary measures were X and the sum of the counterparts effected were Y, the cost-opportunity factor would be calculated by the result of the ratio X: Y, includ-ed in the cost-opportunity formula from MAPA. In addition, in the case of specific phytosanitary measures, it is possible to define parameters of opportunity cost base by country or type of measure. For example, in Brazil, the MAPA established a 15% counterpart of the centers of the agreed cost in contracts negotiated with state departments of agriculture.
FACTOR COST OPPORTUNITY = 1 + (ECONOMIC COUNTERPARTS REFERRED TO PARTNER’S / PARTNERS ECONOMIC CONTRACTS)
1.b. Other adjustments for economic distortions
Other economic adjustments include the differentiation between the market prices and the price used by the cost centers when acquiring the necessary inputs for the implementation of the program. The adjustment is obtained with the average of the differences of the prices paid by the cost centers and the values obtained at the marketplace for specific inputs.
Economic price represents the average market value of a product or service, within a specific market. In summary, the calculation of the distortion factor should take into account discount factors (such as inflation), but focuses on verifying the average of the differences between the “intervention price” (values of items purchased by cost centers) and the “price without distortion” of each item purchased (average market values). It should also apply the exchange rates between countries (in the case of inputs purchased or traded externally) to correct possible distortions of a currency value (shadow pricing).
For example, if a cost center purchased a computer for a specific price $ 5.000; however, the market price is, on average, 25% lower, an adjustment in the value of the computer is required. In this case, the market value of the economic invest-ment is $ 4.000. That is, if the price paid for inputs is computed in the cost-benefit analysis, the value closest to its true market value should be used.
1.c. Total economic cost or per unit of analysis (eg hectare) adjusted to other discount factors
The economic cost of phytosanitary measures is the adjusted cost of the financial value practiced for price distortions, opportunity costs and discounting factors (Gittinger, 1992). In this case, it is also essential make adjustments in financial val-ues taking into account discount factors. The discount factor is a depreciation rate based on the time of the intervention. For example, inflation or the cost of money (eg interest rate) for the implementation of a multi-annual phytosanitary measure should be used in the final calculations of the economic costs.
DISCOUNT FACTOR (FD)
FD=
(1+i)n
1
Where:
FD = Discount factor i = applied discount rate n = discount time (in years)
1.d. Final calculation of the economic cost
Based on the factors indicated above, the formula for calculating economic costs is as follows:
CEP=
CF x FPS x FCO x FD
N
PESS Where:
CEP = Policy economic cost CF = Total financial cost FPS = Shadow price factor FCO = Opportunity cost factor
FD = Discount factor NPESS = Analysis unit number
2. ANALYSIS OF THE NET BENEFIT (BLP)
The net benefit is obtained by calculating the impact of avoiding economic losses or improving productivity based on impact projection models of a given pest (see impact projection models below). For example, let´s assume, in a given country, that pest prevention, according to epidemiological studies, leads to a 5% reduction in productivity in a region. In this case, it can be estimated that the value of the benefit represents 5% of the total value of the production values of that region. To calculate the benefits generated, the following formula is used:
BLP=
GPP x GMP x TS x FD
N_PESS
Where:
BLP = Net benefit from the policy GPP = Gain in productivity per point of
epidemiological prevention GMP = Average gain in production
TS = Health prevalence rate FD = Discount factor