Publisher’s version / Version de l'éditeur:
Solid state communications, 151, 24, pp. 1873-1876, 2011-10-12
READ THESE TERMS AND CONDITIONS CAREFULLY BEFORE USING THIS WEBSITE. https://nrc-publications.canada.ca/eng/copyright
Vous avez des questions? Nous pouvons vous aider. Pour communiquer directement avec un auteur, consultez la première page de la revue dans laquelle son article a été publié afin de trouver ses coordonnées. Si vous n’arrivez pas à les repérer, communiquez avec nous à [email protected].
Questions? Contact the NRC Publications Archive team at
[email protected]. If you wish to email the authors directly, please see the first page of the publication for their contact information.
NRC Publications Archive
Archives des publications du CNRC
This publication could be one of several versions: author’s original, accepted manuscript or the publisher’s version. / La version de cette publication peut être l’une des suivantes : la version prépublication de l’auteur, la version acceptée du manuscrit ou la version de l’éditeur.
For the publisher’s version, please access the DOI link below./ Pour consulter la version de l’éditeur, utilisez le lien DOI ci-dessous.
https://doi.org/10.1016/j.ssc.2011.10.003
Access and use of this website and the material on it are subject to the Terms and Conditions set forth at
Prediction of a bcc–hcp phase transition for Sn : a first-principles study
Yao, Yansun; Klug, Dennis D.
https://publications-cnrc.canada.ca/fra/droits
L’accès à ce site Web et l’utilisation de son contenu sont assujettis aux conditions présentées dans le site LISEZ CES CONDITIONS ATTENTIVEMENT AVANT D’UTILISER CE SITE WEB.
NRC Publications Record / Notice d'Archives des publications de CNRC:
https://nrc-publications.canada.ca/eng/view/object/?id=595e4531-8dd0-4e05-86ff-7f418415fcc8
https://publications-cnrc.canada.ca/fra/voir/objet/?id=595e4531-8dd0-4e05-86ff-7f418415fcc8
Contents lists available atSciVerse ScienceDirect
Solid State Communications
journal homepage:www.elsevier.com/locate/ssc
Prediction of a bcc–hcp phase transition for Sn: A first-principles study
Yansun Yao
∗, Dennis D. Klug
Steacie Institute for Molecular Sciences, National Research Council of Canada, Ottawa, K1A 0R6, Canada
a r t i c l e i n f o
Article history:
Received 17 May 2011 Received in revised form 3 October 2011 Accepted 4 October 2011 by S. Scandolo
Available online 12 October 2011
Keywords:
A. Metals
C. Crystal structure and symmetry D. Phase transitions
E. Strain, high pressure
a b s t r a c t
The high-pressure structural transformation of elemental Sn is studied using an ab initio density functional theory implementation of the metadynamics method that predicts with sufficient compression, Sn will transform from the bcc structure into an hcp structure. The low-free-energy pathway associated with this phase transition is characterized as the Burgers transition mechanism. The superconducting properties of Sn under pressure are also investigated. Both bcc and hcp structures of Sn exhibit very weak electron–phonon coupling and therefore would not sustain superconductivity at high pressure.
Crown Copyright © 2011 Published by Elsevier Ltd. All rights reserved.
1. Introduction
Tin occupies a special position in the elements of Group IVa. The lighter group IVa elements (C, Si, and Ge) have a tendency to form strong sp3tetrahedral bonds at ambient conditions. Since
in these elements s and p states are sufficiently close in energy to drive an s2p2
→
sp3 hybridization, C, Si, and Ge are able toform covalent diamond structures at ambient conditions [1]. As one descends the Group IVa list in the periodic table, the sp3
tetrahedral bonds become weaker and their metallic character increases simultaneously. In the heavy element Pb, relativistic effects become significant, which increases the s
→
p promotion energy and prohibits the formation of sp3bonds [2]. As a result, Pbforms a metallic fcc structure at ambient conditions. Sn is located at the borderline between the two distinctly different bonding patterns. The sp3bond formation energy in Sn is nearly equal to
the s
→
p promotion energy, and therefore Sn can only form weak sp3bonds at low temperatures [3]. The diamond structureof Sn, or
α-Sn, is unstable upon increasing temperature and Sn
transforms to a metallic phase (β-Sn) at approximately 286 K. This phase transition was suggested as being attributed to significant entropy contributions to the free energy. Upon compression,β-Sn
is stable up to 9.5 GPa and then transforms to a body-centered tetragonal structure (bct) [4,5]. Near 45 GPa, the bct structure further transforms to a bcc structure, and the latter remains stable∗Correspondence to: Steacie Institute for Molecular Sciences, National Research Council of Canada, Room 2007, 100 Sussex Drive, Ottawa, ON, K1A 0R6, Canada. Tel.: +1 613 991 1237; fax: +1 613 947 2838.
E-mail address:[email protected](Y. Yao).
up to at least 120 GPa [6], the highest pressure achieved in previous experiments.
The structures of Sn above 120 GPa are however still unknown, and this provided the motivation for the present study. Since pressure usually weakens directional forces and drives crystalline structures toward close-packed forms, it is reasonable to suggest the hcp structure as a post-bcc form of Sn. Density functional theory (DFT) [7] calculations, however, showed that the bcc and hcp structures of Sn have very close energies and therefore their relative ordering could not be determined [8]. Several calculations suggested that the bcc
→
hcp transition cannot occur in Sn [3,9], while others suggest that the transition can occur but the predicted transition pressures in reported calculations differ by more than 100 GPa [10,11]. Since the bcc and hcp structures are very close in energy, examining the phase transition via energetics alone may therefore not be adequate. In order for this phase transition to occur, an energy barrier has to be crossed and this requires knowledge of the free-energy surface. In the present study, we use a recently developed structural search algorithm, the metadynamics method [12,13], to explore the free-energy surface of Sn and search for its structures at high pressure, starting from the initial free-energy minimum for the bcc structure. This enables us to directly simulate the structural transformations of Sn under experimental conditions. In addition, we investigated the superconducting properties of Sn under pressure, using phonon-mediated Eliashberg theory [14] based on the Bardeen–Cooper–Schrieffer (BCS) model [15]. 2. Theoretical detailsAll calculations in the present study were performed using the pseudopotential method with ab initio implementations of DFT.
0038-1098/$ – see front matter Crown Copyright©2011 Published by Elsevier Ltd. All rights reserved.
1874 Y. Yao, D.D. Klug / Solid State Communications 151 (2011) 1873–1876
Since relativistic effects become relevant for energetic proper-ties of Sn (insignificant for structural properproper-ties), scalar relativistic effects have been included in enthalpy and metadynamics cal-culations. The spin–orbit (SO) coupling has negligible effects in energetics [3], and therefore is not included. This was recently demonstrated by Pedersen et al. [16] who showed that, for Sn, although the SO coupling yielded a minor splitting of sev-eral electronic bands, the effect on the density of states was small. The Vienna ab initio simulation (VASP) program [17] was used for both enthalpy and metadynamics calculations com-bined with the projected augmented wave (PAW) potential [18], the Perdew–Burke–Ernzerhof (PBE) exchange–correlation func-tional [19], and a kinetic energy cutoff of 320 eV. The semicore 4d states are included in the pseudopotential to avoid core over-laps between neighboring atoms at reduced volumes. For en-thalpy calculations, a 24
×
24×
24 (bcc) and 24×
24×
16 (hcp) Monkhorst–Pack (MP) k-point mesh [20] were used to sample the first Brillouin zone (BZ). The calculated enthalpies were checked and confirmed with ABINIT program [21], which yields identical transition sequence with minor differences in predicted transition pressures. The metadynamics calculations employed a 32 atom supercell and a 2×
4×
4 k-point mesh, with each metastep consist-ing of a molecular dynamics (MD) equilibration in a NVT ensemble. The linear response method was used to compute lattice dynamics. Phonons were calculated using the ABINIT program with a norm conserving pseudopotential [22] (70 Hartree for the kinetic energy cutoff), and were also confirmed with the Quantum ESPRESSO (QE) program [23] employing an ultrasoft pseudopotential (with non-linear core-corrections) [24]. Phonon calculations were performed on a 4×
4×
4 q-point mesh, with each individual point calculated using a 18×
18×
18 (bcc) or 18×
18×
12 (hcp) k-point mesh. The QE program was employed for electron–phonon coupling (EPC) calcu-lations, with the wave-function and charge density expanded by a kinetic energy cutoff of 60 and 600 Ry, respectively. The EPC cal-culations were performed on a 8×
8×
8 (bcc) and 8×
8×
8 (hcp) q-point mesh, using individual EPC matrices obtained with a 32×
32×
32 (bcc) and 32×
32×
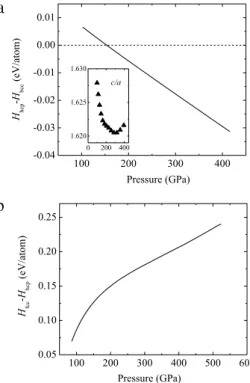
20 (bcc) k-point mesh. 3. Results and discussionComparison of enthalpies for the bcc and hcp structures is presented inFig. 1(a). The enthalpies were obtained by fitting the calculated energy–volume data to the equation of state (EOS) [25]. The enthalpy difference between the two structures is indeed very small, but indicates that the hcp structure becomes more stable than the bcc structure at high pressure, i.e., above 154 GPa. The c/a ratio of the hcp phase decreases upon compression until 286 GPa, and then increases. This is consistent with a previous DFT calculation [11] in which the c/a ratio of the hcp phase was shown to steadily decrease from 0 to 200 GPa. The enthalpy calculations provide an estimate for the transition at zero Kelvin. Using the calculated phonon density of states (DOS), the estimated vibrational free energy from the quasiharmonic method [26] for the hcp structure is 0.006 eV/atom higher than that of the bcc structure at 220 GPa and 300 K (see later). As an initial estimate, assuming this free energy difference, inclusion of the free energy would increase the bcc
→
hcp transition pressure. This is consistent with previous experiments in which no bcc→
hcp transition was observed below 120 GPa [6]. The enthalpy of the fcc structure is also calculated, and this shows that no transition to fcc should be expected at high pressure (Fig. 1(b)).The metadynamics algorithm as implemented for solid–solid phase transitions was used to simulate the phase transitions in Sn. This implementation employs scaled components of the edge vectors of the simulation supercell as collective variables. Metadynamics simulations have been performed at 200, 300 and
a
b
Fig. 1. Calculated enthalpy differences per Sn atom (a) between hcp and bcc
structures and (b) between fcc and hcp structures. Inset shows the change in c/a
ratio for the hcp structures as a function of pressure.
400 GPa with T
=
300 K. All calculations started with a 4×
2×
2 bcc supercell. To eliminate unphysical rotations, the cell matrix h was defined as an upper triangular matrix with a six-component vector (h11,
h22,
h33,
h12,
h13,
h23). The dominant deformation modes inthe simulation cell are derived from the elastic response matrix (Hessian matrix) (Table 1). The eigenvectors of the Hessian matrix projected on the cell vector describe six elastic modes for the cell. The eigenvalues of the Hessian matrix describe the curvature of the free energy along the corresponding eigenvectors. A prerequisite for metadynamics calculations is that the initial structure is located at a free-energy well, represented by all positive eigenvalues. In Table 1, the s1 mode describes an extension along
[
100]
bccdirection, combined with a contraction of
(100)
bcc planes. Thes5 mode corresponds to a contraction along
[
010]
bcc and anextension along
[
001]
bccwith equal magnitude. The s2,
s3, and s4modes, each representing a change of off-diagonal components of the h matrix, correspond to three shearing modes. The s6
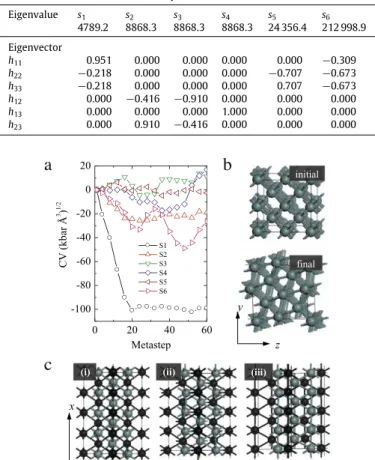
mode describes contractions in all three cell axis that corresponds to a nearly hydrostatic volume decrease. The evolution of the collective variables associated with the six elastic modes during the metadynamics simulation at 200 GPa and 300 K is shown in
Fig. 2(a). The simulation cell was initially annealed at 300 K prior to the metadynamics calculation. Once the metadynamics is initiated, the simulation cell undergoes a direct structural transformation at the very first metastep, indicating a low free-energy barrier to the new phase (Fig. 2(a)). The phase transition is activated by the s1
mode, and the structure evolves into an hcp structure by metastep 20. The simulation cells before and after the phase transition are shown inFig. 2(b). The same metadynamics simulation was repeated at 300 and 400 GPa and both converged to an hcp structure. This therefore suggests that the hcp is indeed a more favorable structure than bcc at high pressure, and, with sufficient compression a bcc
→
hcp transition should occur in Sn.The microscopic mechanism for the bcc
→
hcp transition in Sn is characterized by the evolution of individual collective variables (Fig. 2(a)). A large drop and negative sign in the active mode s1 reveals that this structural transformation is described by aY. Yao, D.D. Klug / Solid State Communications 151 (2011) 1873–1876
Table 1
Eigenvalues (in units of kbar Å) and the corresponding eigenvectors of the Hessian matrix for the initial 4×2×2 bcc supercell calculated at 200 GPa.
Eigenvalue s1 s2 s3 s4 s5 s6 4789.2 8868.3 8868.3 8868.3 24 356.4 212 998.9 Eigenvector h11 0.951 0.000 0.000 0.000 0.000 −0.309 h22 −0.218 0.000 0.000 0.000 −0.707 −0.673 h33 −0.218 0.000 0.000 0.000 0.707 −0.673 h12 0.000 −0.416 −0.910 0.000 0.000 0.000 h13 0.000 0.000 0.000 1.000 0.000 0.000 h23 0.000 0.910 −0.416 0.000 0.000 0.000
a
b
c
Fig. 2. Structural evolution during the metadynamics simulation at 200 GPa and
300 K, with Gaussian width and height parameters of 7(kbar Å3)1/2and 49 kbar Å3
(30.58 meV), respectively. (a) Evolution of the six collective variables (CV) indicating a phase transition in the first 20 metasteps. (b) The initial simulation cell and the simulation cell evolved after the phase transition, viewed along [100] direction. (c) Evolution of the hcp structure from the bcc structure. To highlight the stacking sequence, the neighboring crystallographic planes ({011} for bcc and {0001} for hcp) are separated by using gray and dark colors.
contraction in
[
100]
bcc direction and an expansion of(100)
bccplanes. The
{
110}
bcc planes have the highest packing densityamong all crystallographic planes in a bcc lattice, but are not close-packed along the
⟨
100⟩
bcc direction. As a simple approximation,i.e., representing crystal lattices by packing rigid spherical atoms, the making of
{
110}
bcc planes truly close-packed requires acompression along the
⟨
100⟩
bcc direction and an extension along⟨
1¯10⟩
bccdirection. As shown inFig. 2(c), this mechanism is fulfilledexactly in the s1mode displacements. The
(100)
bccplane expansioncauses an extension in the
[
011¯
]
bcc direction, and this combineswith the contraction in
[
100]
bcc direction making the(011)
bccplanes truly close-packed. The planar deformation is accompanied by a shearing mode that displaces every second plane along the
[
01¯1]
bcc direction into a (ABAB. . . ) stacking sequence. Followingthe shearing displacement, the then close-packed
(011)
bccplanesbecome
(0001)
hcpbasal planes. The shearing mode correspondsto a change of internal coordinates in the simulation cell, which evolve during the MD equilibrations made at each metastep. In the rigid atom approximation, a bcc
→
hcp transition does not require changes in the inter-plane spacing [27]. Since chcp evolves fromtwice of the inter-plane distance (
√
2abcc), while ahcpis one halfof the diagonal of the
(011)
bccrectangle (√
3abcc
/2), the c
hcp/
ahcpratio is the natural ideal value
√
8/3 and the accompanied volume drop is∼
8%. The present enthalpy calculations (Fig. 1(a)), however, show that the bcc→
hcp transition in Sn induces a much smallera
b
Fig. 3. (a) Calculated phonon band structure and DOS of hcp structure at 220 GPa.
The phonon DOS of bcc structure at same pressure is presented for comparison. (b) Calculated EPC parameterλof Sn as a function of pressure. The calculations below and at 150 GPa employed a bcc structure while the calculations above 150 GPa employed an hcp structure.
volume drop, c.a
., below 0.5%. This indicates that the inter-plane
spacing ([
011]
bcc) is elongated during the transition (fulfilled by(100)
bcc plane expansion) to compensate for the large volumelost in close packing the
(011)
bccplanes. In comparison with thecharacteristic mode s1, the other five modes made insignificant
contributions (shearing and volume changes) in the evolution of simulation cell (Fig. 2(a)). Notably, the transition mechanism revealed by the metadynamics simulation, which corresponds to a low-free-energy pathway for bcc
→
hcp transition in Sn, is consistent with the Burgers transition mechanism [28] originally proposed for theα
→ β
transition in Zr.The phonon dispersion relations for the hcp structure at 220 GPa are shown inFig. 3(a). The absence of imaginary modes establishes the stability of the hcp structure at high pressure.
Fig. 3(a) also shows a comparison between the phonon DOSs of hcp and bcc structures at same pressure. While the phonon DOS at mid and high-frequency ranges are very close in the two structures, the bcc phonon DOS is greater below 4 THz, enhanced by soft modes in the BZ. The DOS peak near 3 THz in the bcc phonon spectrum has a notable contribution from the transverse T1mode at the Brillouin
zone N point (or A point in hcp), which corresponds to the shearing mode of the
(011)
bccplanes (Fig. 2(c)). Low frequency phonons areeasier to excite and therefore contribute more effectively to the entropy. Thus, the vibrational free energy for the bcc structure at 300 K is slightly lower (by 0.006 eV/atom using a quasiharmonic approximation estimate) than that of the hcp structure, which increases the phase transition pressure from the estimate at 0 K.
Since Sn becomes a superconductor below 3.72 K at ambient pressure [29], it is of interest to expand a superconductivity study into the higher pressure range. The phonon linewidths, EPC parameter,
λ, defined as the first reciprocal moment of
the Eliashberg phonon spectral functionα
2F(ω), were therefore
calculated for both bcc and hcp structures [30]. The calculated EPC in both bcc and hcp phases are very weak (i.e.λ <
0.3)1876 Y. Yao, D.D. Klug / Solid State Communications 151 (2011) 1873–1876
and decrease with pressure (Fig. 3(b)). Such a weak EPC at high pressure would therefore not sustain superconductivity in Sn. This is consistent with a previous theoretical study in which the
λ
of Sn was estimated as 0.46 at ambient pressure and predicted to decrease to 0.34 at 3.5 GPa [31]. Using the Allen and Dynes modified McMillan equation [32], Tc=
ωlog 1.2exp
−
λ−µ1.∗04(1(1++λ)0.62λ)
, the estimated Tcin the bcc structure at 100 GPa is only 4.6 mK and it vanishes rapidly upon increasing pressure. For this estimate, the phonon frequency logarithmic averageω
logwas calculated directlyfrom the phonon spectrum [23] and the Coulomb pseudopotential
µ
∗ is taken as an empirical value of 0.1. The present study therefore suggests that superconductivity of Sn would be strongly suppressed and eventually would vanish by applying pressure. This is consistent with a previous superconductivity measurement [33] at low pressure (below 1 GPa), in which the Tc of Sn shows a decrease from its ambient pressure value at the rate of−
495 mK/GPa.4. Summary
In this study, we have examined the high-pressure phase transitions of Sn to determine whether the hcp phase is the most probable structure in the megabar pressure region. We predict, via the use of the metadynamics technique, as implemented with density functional theory, that Sn should transform to from the bcc to the hcp structure above 154 GPa. The hcp structure of Sn is predicted to form via the Burgers transition mechanism and is predicted to not exhibit significant superconducting behavior. Acknowledgment
The authors would like to thank Roman Martoňák for providing them with the metadynamics code and for valuable suggestions.
References
[1] A. Mujica, A. Rubio, A. Muñoz, R.J. Needs, Rev. Modern Phys. 75 (2003) 863. [2] N.E. Christensen, Sashi Satpathy, Z. Pawlowska, Phys. Rev. B 34 (1986) 5977. [3] N.E. Christensen, M. Methfessel, Phys. Rev. B 48 (1993) 5797.
[4] H. Olijnyk, W.B. Holzapfel, J. Phys. (Paris) Colloq. 45 (Suppl. 11) (1984) C8-153. [5] M. Liu, L.-G. Liu, High Temp.- High Pressures 18 (1986) 79.
[6] S. Desgreniers, Y.K. Vohra, A.L. Ruoff, Phys. Rev. B 39 (1989) 10359. [7] W. Kohn, L.J. Sham, Phys. Rev. 140 (1965) A1133.
[8] J.L. Corkill, A. Garcia, M.L. Cohen, Phys. Rev. B 43 (1991) 9251.
[9] S. Cui, L. Cai, W. Feng, H. Hu, C. Wang, Y. Wang, Phys. Status Solidi (B) 245 (2008) 53.
[10] B.H. Cheong, K.J. Chang, Phys. Rev. B 44 (1991) 4103. [11] Andrés Aguado, Phys. Rev. B 67 (2003) 212104.
[12] R. Martoňák, A. Laio, M. Parrinello, Phys. Rev. Lett. 90 (2003) 075503. [13] R. Martoňák, D. Donadio, A.R. Oganov, M. Parrinello, Nat. Mater. 5 (2006) 623. [14] G.M. Eliashberg, Zh. Eksp. Teor. Fiz. 38 (1960) 966; Sov. Phys. JETP 11 (1960)
696.
[15] J. Bardeen, L.N. Cooper, J.R. Schrieffer, Phys. Rev. 108 (1957) 1175.
[16] T.G. Pedersen, P. Modak, K. Pedersen, N.E. Christensen, M.M. Kjeldsen, A.N. Larsen, J. Phys.: Condens. Matter 21 (2009) 115502.
[17] G. Kresse, J. Hafner, Phys. Rev. B 47 (1993) 558. [18] G. Kresse, D. Joubert, Phys. Rev. B 59 (1999) 1758.
[19] J.P. Perdew, K. Burke, M. Ernzerhof, Phys. Rev. Lett. 77 (1996) 3865. [20] H.J. Monkhorst, J.D. Pack, Phys. Rev. B 13 (1976) 5188.
[21] X. Gonze, J.M. Beuken, R. Caracas, F. Detraux, M. Fuchs, G.M. Rignanese, L. Sindic, M. Verstraete, G. Zerah, F. Jollet, M. Torrent, A. Roy, M. Mikami, Ph. Ghosez, J.-Y. Raty, D.C. Allan, Comput. Mater. Sci. 25 (2002) 478. [22] N. Troullier, J.L. Martins, Phys. Rev. B 43 (1991) 1993.
[23] P. Giannozzi, et al., J. Phys.: Condens. Matter 21 (2009) 395502. [24] D. Vanderbilt, Phys. Rev. B 41 (1990) 7892.
[25] P. Vinet, J.H. Rose, J. Ferrante, J.R. Smith, J. Phys.: Condens. Matter 1 (1989) 1941.
[26] P. Pavone, S. Baroni, S. de Gironcoli, Phys. Rev. B 57 (1998) 10421. [27] R.M. Wentzcovitch, M.L. Cohen, Phys. Rev. B 37 (1988) 5571. [28] W.G. Burguers, Physica 1 (1935) 561.
[29] W. Dehaas, J. Deboer, G. Vandenberg, Physica 2 (1935) 453. [30] S.Y. Savrasov, D.Y. Savrasov, Phys. Rev. B 54 (1996) 16487. [31] K.J. Chang, M.L. Cohen, Phys. Rev. B 34 (1986) 4552. [32] P.B. Allen, R.C. Dynes, J. Phys. C 8 (1975) L158. [33] J. Wittig, Z. Phys. 195 (1966) 215.