Publisher’s version / Version de l'éditeur:
Canadian Journal of Civil Engineering, 11, 1, pp. 82-91, 1984-03
READ THESE TERMS AND CONDITIONS CAREFULLY BEFORE USING THIS WEBSITE. https://nrc-publications.canada.ca/eng/copyright
Vous avez des questions? Nous pouvons vous aider. Pour communiquer directement avec un auteur, consultez la première page de la revue dans laquelle son article a été publié afin de trouver ses coordonnées. Si vous n’arrivez pas à les repérer, communiquez avec nous à [email protected].
Questions? Contact the NRC Publications Archive team at
[email protected]. If you wish to email the authors directly, please see the first page of the publication for their contact information.
NRC Publications Archive
Archives des publications du CNRC
This publication could be one of several versions: author’s original, accepted manuscript or the publisher’s version. / La version de cette publication peut être l’une des suivantes : la version prépublication de l’auteur, la version acceptée du manuscrit ou la version de l’éditeur.
Access and use of this website and the material on it are subject to the Terms and Conditions set forth at
Uniaxial compressive strength of first-year and multi-year sea ice
Sinha, N. K.
https://publications-cnrc.canada.ca/fra/droits
L’accès à ce site Web et l’utilisation de son contenu sont assujettis aux conditions présentées dans le site LISEZ CES CONDITIONS ATTENTIVEMENT AVANT D’UTILISER CE SITE WEB.
NRC Publications Record / Notice d'Archives des publications de CNRC:
https://nrc-publications.canada.ca/eng/view/object/?id=b7c1aeda-1b9a-4425-8da9-636dadb17251 https://publications-cnrc.canada.ca/fra/voir/objet/?id=b7c1aeda-1b9a-4425-8da9-636dadb17251-
? -
Ser
National Research
Conseil national
T H ~
I
$
Council Canada
de recherches Canada
N2ld
1
'
ne.
1180c .
2
ELDG
UNIAXIAL COMPRESSIVE STRENGTH OF FIRST-YEAR AND
MULTI-YEAR SEA ICE
by
N.K. Sinha
ANALYZED
DBR Paper No. 1180
Division of Building Research
Price $1.25
OTTAWA
NRCC 23260
T h i s paper, w h i l e being d i s t r i b u t e d i n r e p r i n t form by t h e D i v i s i o n of B u i l d i n g Research, remains t h e c o p y r i g h t of t h e o r i g i n a l p u b l i s h e r . It should n o t be reproduced i n whole o r i n p a r t w i t h o u t t h e permission of t h e p u b l i s h e r . A
l i s t
of a l l p u b l i c a t i o n s a v a i l a b l e from t h e D i v i s i o n may be o b t a i n e d by w r i t i n g t o t h e P u b l i c a t i o n s S e c t i o n , D i v i s i o n of B u i l d i n g R e s e a r c h , N a t i o n a l R e s e a r c h C o u n c i l of Canada, O t t a w a , O n t a r i o ,KIA OR6
.'
- - - c 3 -Uniaxial compressive strength of first-year and multi-year sea ice'
N . K . SINHA
9
Division of Building Research, National Research Council of Canada, Ottawa, Ont., Canada K I A OR6 #
Received September 12, 1983 Manuscript accepted November 9, 1983
Strain-rate and stress-rate sensitivity of the compressive strength of first-year columnar-grained ice, first-year congealed frazil ice, and columnar-grained ice from an old floe have been investigated with load applied in the horizontal plane. In spite t of similar salinity and density, the frazil ice proved to be considerably stronger than the columnar-grained ice. The strength of porous old floe ice with columnar-grained structure was very much the same as that of first-year ice of similar structure, but the clear bulk ice of the old floe was strongest. Rate sensitivity of strength for the three types of saline ice was similar to that of fresh-water ice. Ductility of the old clear ice (as measured by the strain at upper yield) was the same as that of fresh-water ice; ductility of porous old ice was comparable to that of new frazil ice. New columnar-grained ice proved to be the most ductile material.
Keywords: columnar-grained, compressive strength, ductility, first-year, frazil, multi-year, rate sensitivity, sea ice. Nous avons CtudiC la sensibilitt de la resistance en compression aux taux de dCformation et de contrainte de la glace colonnaire de premiere annCe, du frasil conge16 de premiere annee et de la glace colonnaire d'une vieille banquise. L'Ctude a CtC faite sous charge appliquCe dans le plan horizontal. En dkpit d'une salinite et d'une densite semblables, le frasil s'est montre beaucoup plus resistant que la glace colonnaire. Bien que la rksistance de la glace poreuse a structure colonnaire d'une vieille banquise ait CtC la mCme que celle de la glace de premiere annCe ayant la mCme structure, la glace claire massive d'une vieille banquise s'est avCr6e la plus forte. La sensibilite de la resistance en compression aux taux de deformation et de contrainte des trois types de glace saline Ctait semblable a celle de la glace d'eau douce. La ductilitC de la vieille glace (dCterminCe par la deformation a la limite superieure de la resistance) Ctait la mCme que celle de la glace d'eau douce; la ductilitt de la vieille glace poreuse Ctait comparable
a
celle du frasil. La nouvelle glace colonnaire s'est avCrCe le matCriau le plus ductile.Mots-elks: glace colonnaire, resistance a la compression, ductilitk, premiere annCe, frasil, vieille banquise, glace de mer.
Can 1 Civ Eng 11, 82-91 (1984)
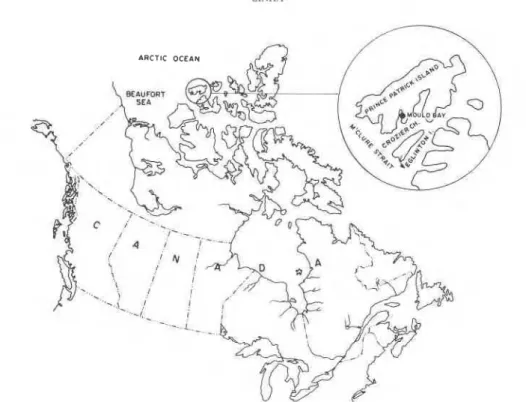
Introduction was covered with a uniform flat sheet of new ice under
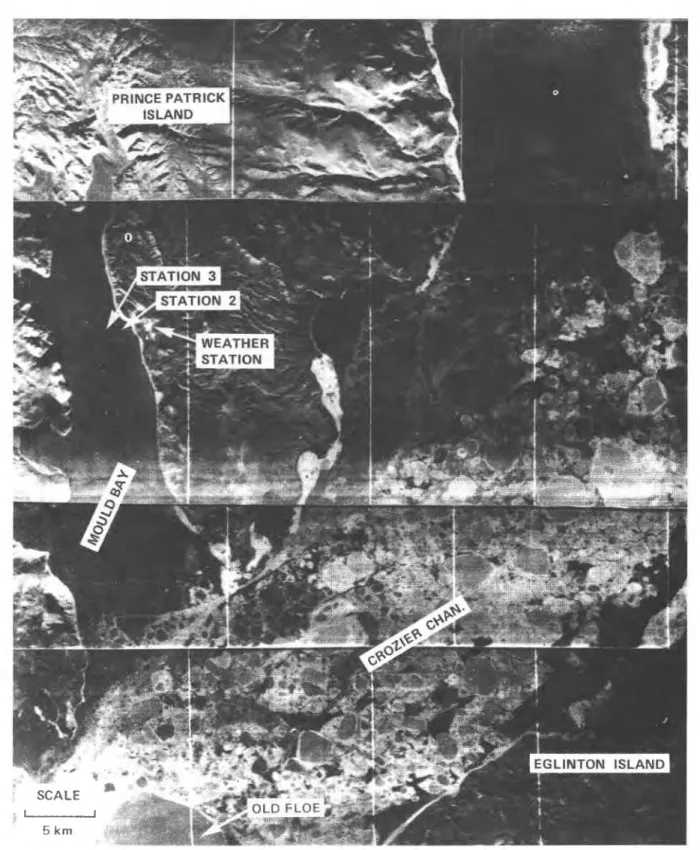
Interest in the strength and deformation properties of a Snow cover of 1-2 cm. A variety of old floes sur- sea ice is growing as a result of increasing exploration rounded by new ice covered most of Crozier Channel, in the ice-affected waters off the coast of Newfoundland although open leads kept occurring in many places and Labrador and in the ti^, participation in the since the floes were mobile. Figure 2 shows the SLAR Canada- U. S .A. Radarsat/Firex Project to determine (Side Looking Airborne Radar) imagery of the ice con- the microwave properties of first-year and multi-year ditions in Mould Bay and the surrounding regions ob- sea ice under natural conditions offered an opportunity tained by AES Electra (NDZ-734) during a flight on to make observations at the High Arctic Weather Sta- October 11, 1981. A detailed report on this phase of tion at Mould Bay, Prince Patrick Island (76"14'N, the work is in preparation (B. E. Troy, Jr., J . P. 1 19"201W). Tests were carried out in October 1981 to Hollinger, R. 0 . Ramseier, K. W . Asmus, M. F. Hart- determine loading rate sensitivity of uniaxial, uncon- man, and C . A. Luther. Microwave emission from sea fined, compressive strength of freshly recovered, first- ice at Mould Bay, Canada, October 1981. Private year columnar-grained and congealed frazil slush ice
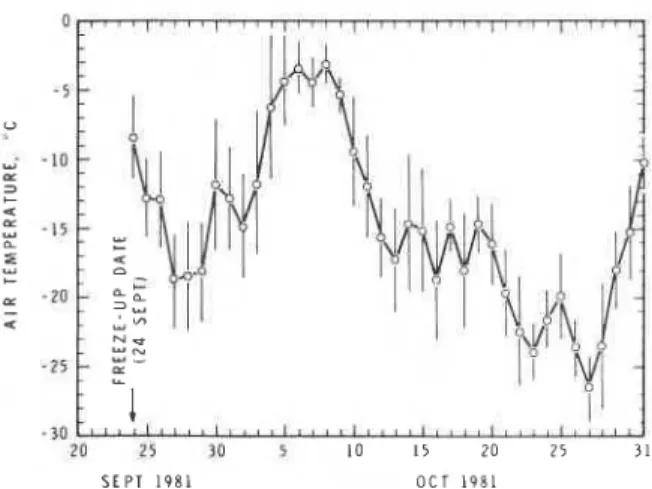
from Mould Bay and of old sea ice from a large floe Freeze-up for complete ice cover in Mould Bay was about 10 km in diameter in crozier channel. ln all cases September 24 under calm conditions that prevailed for
the major axis of the samples and the applied load were almost another 10 days. During this time the ice grew
in the horizontal plane. to a thickness of about 25 cm. A record of air tem-
peratures for this period of September-October is
Site, weather, and ice characteristics shown in Fig. 3. The warm spell made it very difficult
w i t h the exception of a few grounded pieces of to work on the ice in the Bay, but it provided an excel-
multi-year ice near the shore, all of Mould Bay (Fig. 1) lent o ~ ~ o f i u n i t ~ to gather microwave data On new ice with a thin water-saturated snow cover. This warm pe- 'This paper was presented at the 1983 Annual Conference riod was a l s ~ used for surveying the area by helicopter of the Canadian Society for Civil Engineering, Ottawa, On- and for examining the surface conditions of a large
FIG. 1. Map show was uniformly covered with hummocks and melt ponds. All the melt ponds were covered with a thin layer of new ice; in some cases it covered sea water and in other cases, brackish water. Large blocks of samples of hummock ice were obtained on October 7 with a chain saw and brought to the base camp for storage at about -10°C and for subsequent detailed micro- structural analysis and mechanical tests. It is possible that this was a second-year floe (R. 0 . Ramseier, pri- vate communication), but since its life history was un- known it will be referred to as old or multi-year floe ice in this paper.
An east-west experimental line across Mould Bay was established for microwave studies and 11 stations were marked along it. Examination of the ice at the various stations showed predominantly columnar- grained structure, except for the ice cover around Station 2 that consisted almost entirely of congealed, frazil slush type ice (see the classification of fresh-water ice by Michel and Ramseier 1971).
Experimental procedures
The High Arctic Weather Station at Mould Bay was used as the base camp (Figs. 1 and 2). A small, port- able, unheated structure served as a cold laboratory and part of the sleeping quarters as the warm laboratory. Mechanical tests were performed during the second half of October when air temperatures dropped below about
- 15°C (see Fig. 3) so that the desired temperature of
ing site location.
the laboratory could be controlled by heating. Large blocks of first-year sea ice were cut with a chain saw when the air temperature was below about - 15°C. A
commercial test machine (Soiltest CT-405) with a de- sign load capacity of 50 kN was used. This is a con- ventional screw-driven machine capable of delivering an actuator displacement rate, i , of 3 X to 7 x lo-' m m s s ' , or a nominal strain rate, G, = i l l , of 1.2 X to 2.8 X s-' for a specimen length, 1, of 250 mm.
Tests were made on large prismoidal samples with final dimensions of 50 X 100 X 250 mm, their long dimensions parallel to the surface of the ice cover or floe. A portable band saw was used to prepare samples from large blocks cut by chain saw. The specimen sur- faces were finished by hand with sandpaper to remove all cut marks and the end surfaces (50 x 100 mm) of each specimen were given a final polish to make certain that they were flat and at right angles to the long axis of the cylinders. Finished specimens were weighed and their dimensions measured. These procedures were car- ried out at a room temperature of about - 15°C. The samples were turned periodically during subsequent storage until tested in order to reduce adverse effects due to brine drainage or migration.
The tests were conducted at - 10 k 0.5"C and at - 18
*
0.5"C, dictated primarily by air temperatures outside the laboratory (Fig. 3). Surface temperatures of the specimens were measured both before and after testing,84 CAN. I. CIV. ENG. VOL. l l . 1984
FIG. 2. SLAR image October 21, 1981 recorded by AES Electra.
using a thermistor system. As well, a deep hole was each batch and a mercury thermometer inserted to mon- drilled along the longitudinal axis of one specimen from itor temperature during the test. This specimen was not
S E P T 1 9 8 1 O C T 1 9 8 1
FIG. 3. Daily minimum, maximum, and mean air tem-
peratures in Mould Bay during September-October 1981.
used for strength testing. For most of the specimens, an examination of the microstructure of the ice was also carried out after testing.
Each specimen was tested between a pair of polished steel platens and load was measured with a calibrated load cell. Deformation was measured by means of a pair of specially designed gauges (gauge lengths of 150 mm)
mounted directly on the two 100 X 250 mm faces of the
specimen (Sinha 1981 a ) . Output from the load cell and from the two displacement gauges was recorded sepa- rately using strip chart recorders warmed in heated and well-insulated boxes that also housed the load cell elec-
tronics and the 6 V dry cells for the displacement
gauges. Calibration of these gauges was checked after every few tests to ensure the accuracy of the strain measurements.
When the ice blocks were brought to the base camp a vertical slice was removed and sectioned in 10 mm thick sections for salinity profile determination. These sections were melted in sealed plastic containers in a microwave oven and stored overnight in a warm room before their salinities were measured by means of a calibrated refractometer.
Results and analysis
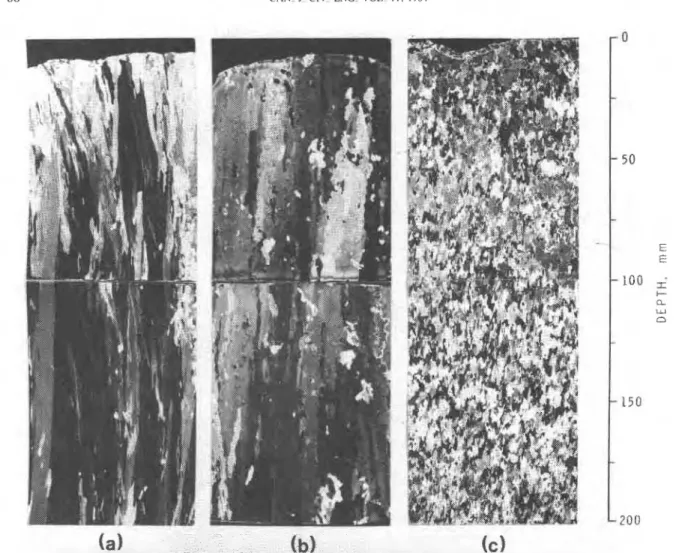
The ice sheet at all the stations across the Bay (7 km) was uniform. Variations were not more than about 0.05 m. All first-year columnar-grained ice used for strength testing was taken from station 3, situated about 1.5 km from the eastern shore of Mould Bay. Here, the ice was columnar-grained through its entire depth (about 0.4 m), the c axis of the grains tending to be in the horizontal plane except for about 50 mm at the top
(Fig. 4). The c axis of the grains in the horizontal plane
tended to be parallel to the axis of the channel and the tidal current and therefore similar to the ice observed by Weeks and Gow (1 978, 1980) in the western Arctic and
by Sinha ( 1 9 8 3 ~ ) in the eastern Arctic. Because of this
anisotropy in the horizontal plane, samples were pre- pared with their major axes parallel, perpendicular, or 45" to the direction of the channel axis, designated Ilc, L C , and L C , respectively. Vertical salinity and density profiles of this ice are given in Fig. 5. Density was calculated from the mass and the volume estimated from the dimensions of the samvles. As these were large and each contained at least two brine channels, the densities are a good representation of the bulk charac- teristics of the ice. The lowest salinity and the corre- sponding highest density at a depth of about 0.25 m correlated well with the lowest growth rate occurring during the warm spell in October. Similar field observations had also been made earlier in the eastern Arctic (Nakawo and Sinha 1981; Nakawo
1983).
Ice at station 2 about 1 km from the eastern shore was congealed frazil slush (Fig. 4). No anisotropy was ob- served in the horizontal plane. The vertical salinity and density profile are shown in Fig. 6; it is significant that both the density and salinity were comparable to those of columnar-grained ice.
The upper layer of the hummock ice from the old floe was vefbubbly and white, but the number of large bubbles decreased rapidly with depth until, at about 0.2 m, the ice was almost transparent, with uniform distribution of very small bubbles. It was, however, columnar-grained (Fig. 4) from the top surface (includ- ing the white top ice) to the bottom of the blocks (about 0.7 m in depth). The shape of the grains, at right angles to the length of the columns, was ill defined and the ice could best be described as bottom ice. This indicated that a considerable amount of the top ice of the original ice cover from which the floe came had melted away. The vertical salinity and density profiles of this ice are shown in Fig. 7. Density was determined not only from the large samples of ice (50 mm thick) prepared for strength testing but also from smaller prismoidal sam- ples (30 mm thick) prepared from a neighbouring block. Both measurements showed that density in- creased rapidly with depth down to about 0.2 m.
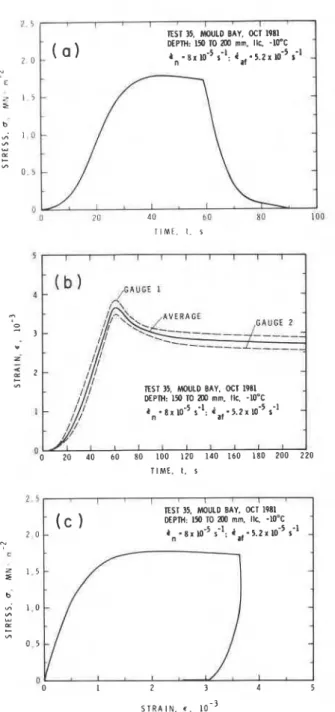
All tests, irrespective of type of ice or rate of loading, showed upper yield type of failure. An example of a stress and strain history, including recovery, and the stress-strain diagram for the entire loading and recov- ery period for a moderate rate of loading are shown in Fig. 8. Note the differences in the slope of the stress-strain diagram during the initial loading period and beginning of recovery, and the high contribution of elastic and delayed-elastic (delayed recovery) strain to total strain. Figure 9 shows the response of different types of ice subjected to the highest crosshead displace- ment rate that could be delivered by the test machine. In spite of a constant crosshead displacement rate dur-
86 CAN J CIV. ENG V O L 1 1 1984
v
" , *-
e 4(a)
tbl
(el
FIG 4 Vert~cal th ~ n sectlons showlng columnar-gralned structure for ( a ) f~rst-year Ice from stat~on 3, ( b ) hummock Ice from old floe, and ( c ) frazll Ice from statlon 2. (Scale In mm )
D E N S I T Y p k g . S A L I N I T Y S ' l o D E N S I T Y p k g . m - 3 S A L I N I T Y S ' l o 800 850 9 0 0 950 2 4 6 8 10 1 2 1 4 -
-
-I
' l . L ' l ' l l l ' L L FIG 5. Vertlcal dens~ty and salln~ty profile of flrst-year FIG. 6 Vert~cal densrty and sallnlty proflle In fraz~l Ice sea ~ c e from statlon 3, October 18, 1981. from statlon 2, October 18, 1981D E N S I T Y . ~ . k g b K 3 S A L I N I T Y , 5 . " l o
FIG. 7 . Density and salinity profile of the hummock ice in
an old floe.
ing a test, the true strain rate of the specimen was not constant. There were differences in the strain paths if strain rates were constant at nominal rates, in, and in the actual paths recorded by the strain gauges in Figs. 8 b and 9a-c. The peak strain rate after the upper yield stress, a[ (to be referred to as failure stress), in all these figures approached the nominal strain rate, $, as indi- cated by the slope of the strain-time records. The aver- age strain rate, ial = € , I t f , where and t [ are failure strain and failure time, respectively, was observed, however, to be considerably lower than in (see Sinha 198 1 a ) . The strain rate in the specimen and its variation with time during testing depend on the relative stiffness of the specimen with respect to that of the test machine and load train (Sinha 198 16).
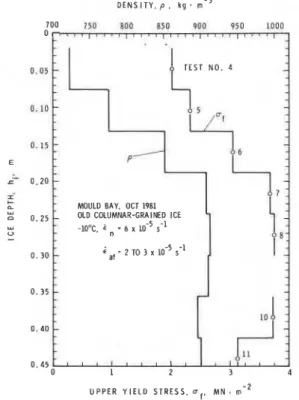
An example of special interest is given in Fig. 10 for the test series on multi-year ice from different depths. All these samples were loaded on the same crosshead displacement rate. Particularly noticeable is the de- pendence of loading history on the quality of the speci- men. The denser samples were stiffer than the porous ice, so that the loading rate imposed by the test system depended on the stiffness of the samples. The increase in strength with depth correlates well, in general, with the corresponding variation in density (Fig. 1 I).
A knowledge of failure times is required if one in- tends to use strength data for any application for which loading times or rate of loading are important. Load (hence stress for small strain) and time for failure are simple to ascertain accurately, even under adverse field conditions. Figure 12 illustrates the relation between a,
7 5 . , I ' a r [ ' l '
E S T 35. MOULD BAY. OCT 1981 DEPM: 1% TO 200 mm. IIc - 1 V C
-
2 0
-
T I M E . I, s
E S T 35. MOULD BAY. OCI 1981
W P M : 1% TO 200 mm. Ilc. -lO°C
1
T I M E , t . I
E S T 35. MOULD BAY. OCT 1981 M P M : 1% TO 2W mm. I t . -lO°C
a n . 8 ~ m - 5 1.l: i a , . 5 . z r 1 ~ - 5 c1
FIG. 8. (a) Stress-time record for a horizontal sample of first-year sea ice during loading and unloading; (b) defor- mation history during loading and recovery on unloading for the test in Fig. 8a; ( c ) stress-strain diagram for the test in Fig. 8a, b.
and t f for all the tests carried out at - 10°C. Although there are only a few experimental results at various rates for multi-year ice, clear ice from depths greater than about 0.2 m appeared to be significantly stronger than the white top ice. Figure 12 also shows that the frazil ice samples were significantly stronger than the young
1 8 8 TO 2 4 4 2 4 4 TO 3 0 0 1 0 356 TO 4 1 2 3 M O U L D B A Y . O C T 1 9 8 1 O L D FLOE I C E , - 1 0 ° C 2 I 200 300 T I M E . t , s
FIG. 10. Stress history for horizontal samples of columnar- grained ice from different depths, in a hummock of an old floe, subjected to the same crosshead displacement rate.
FIG. 11. Depth dependence of density and upper yield
stress for horizontal hummock ice from an old floe at - 10°C
subjected to the same crosshead rate.
-
(COLUMNAR. Ilc)
-10°C. MOULD BAY. OCT 1981 OLD. COLUMNAR NEW. COLUMNAR, Ilc
NEW, FRAZIL *\
U P P E R Y I E L D OR F A I L U R E T I M E . I f , a
FIG. 12. Dependence of upper yield or failure stress on failure time for sea ice in the horizontal plane.
strength (see Sinha 1982 for detailed discussion) may be obtained by using the average stress rate, defined as
where 6 , is unit stress rate (= 1 MN. m-2. s-').
Substitution of t C / t l from [ I ] in [2] and rear-
rangement gives
On substitution of the values of C and 0, determined
earlier, this gives
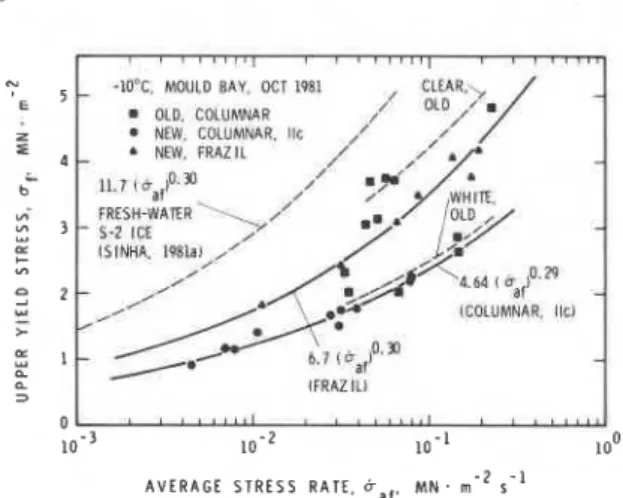
[4a] uf = 4.64(kaf)0-29 for
IIc
iceand
[4b] uf = 6.99(kar)0 30 for frazil ice
Experimental results are compared with [4a, b] in Fig. 13. The stress rate exponents in [4], describing the stress rate sensitivity of strength, are comparable to 0.28 obtained for horizontally oriented sea ice (Sinha 1983a) and to 0.30 for similarly oriented fresh-water ice (Sinha 1981 a ) . Vertically oriented, first-year, columnar-grained ice from Mould Bay also had a com- parable stress rate sensitivity of 0.34, according to the field tests performed during the summer of 1982 (Sinha 19838). Later field tests on first-year Beaufort Sea ice were analysed following the method developed by Sin- ha (1981a) and showed similar stress rate sensitivity (Frederking and Timco 1983) for columnar-grained ice but significant differences for granular ice.
Deformation in ice is difficult to measure even under the controlled conditions of a well-equipped laboratory. Techniques reported by Sinha ( 1 9 8 1 ~ ) and sub- sequently corroborated in the field (Sinha 1983a)
90 CAN. J. CIV. ENG. VOL. 1 1 . 1984
3 1 1 1 1 1 1 1 1 1 1 l l . . l the strain rate sensitivity, p, for first-year columnar-
-1O'C. WULD IBAY K T IWJ1
-
OID COLUMNAR grained Ilc ice shows excellent agreement with the value
NIW. CULUMNAP, HC
/'
of 0.33 obtained for fresh-water columnar-grained ice* NEW. WAZll
-
for constant crosshead rate tests (Sinha 1981 a ) and of 0.35 obtained for the same fresh-water ice tested under
-
2-2 ICE-
closed-loop controlled, constant strain rate loading con-ditions (Sinha 1982). These values differ significantly,
ICOLUMNRR. llCl however, from the value p obtained by Wang (1979),
that is 0.54, for the same type of sea ice subjected to
-
closed-loop controlled, constant strain rates at the sameIFRUILI temperature.
- 3 Failure strain, Er, is, by definition,
A V E R A G E S T R E S S RATE. M N . rn-' r - '
FIG. 13. Dependence of upper yield stress on average stress rate for sea ice with load applied in the horizontal plane.
I -10°C. MOULD BAY. OCT 1981
N
-
a 5 - OLD. COLUMNARi
1-
0 - ' " " " " ' ' ' ' ' " " L 1 0 - 3 A V E R A G E S T R A I N RATE. c a f . 1 - IFIG. 14. Dependence of upper yield stress on average strain rate for sea ice subjected to loading in the horizontal plane.
bolstered confidence in the reliability of the strain measuring system. Results shown in Figs. 8 and 9 (discussed earlier) also confirm that highly accurate strain measurements can be made in the field. Such reliability of strain measurements makes it possible to apply strain rate analysis to strength results. The de-
pendence of u, on
4,
for all the tests in Fig. 12 is shownin Fig. 14. The strain rate sensitivity of strength can be represented (Sinha 198 1 a ) by
where I?, is the unit or reference strain rate (= 1 s-I).
Regression analysis of the results for first-year Ilc ice
gave P = 45 2 23 and p = 0.32
*
0.05, with acorrelation coefficient of 0.92. The results for frazil ice
gave P = 49 2 26 a n d p = 0.27 -C- 0.05, with a
correlation coefficient of 0.93. The numerical value of
Substitution of gar/&, from [ S ] and tiltl from [2] in [6] gives
Thus, on substitution of the values of C, P, p, and 0 ,
obtained earlier,
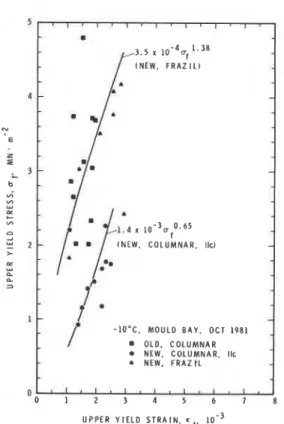
[gal er = 1.42 X I O - ~ U ; 65 for columnar-grained Ilc
and
[8b] ei = 3.50 x IO-~U:'~ for frazil ice
The relation between ul and E, and the calculations
based on [8a, b] are shown in Fig. 15. The increase in
failure strain with increase in strength observed here for u
two types of first-year ice is characteristically similar to the earlier behaviour of fresh-water ice (Sinha 1981 a ,
1982). An increase in er with increase in of was also
noticed for vertical samples of columnar-grained sea ice (Sinha 19836). An apparent tendency for decreasing ductility with increasing strength, noticed for first-year ice by Sinha (1983a), is now thought to be question- able. The data were highly scattered and varied in the
range of 4 X lo-' to 10 X lo-'. These values are
significantly larger than those obtained during the present study. The errors could have been introduced in the measurements by end effects; the strain gauge was mounted not on the sample but between the top and bottom platens since the investigator was forced to use a small specimen size because of the low capacity (less
than 10 kN) of the test machine. The softer nature of
that machine in comparison with the present equipment could also have introduced errors (Sinha 1981 b).
Conclusion
This study has confirmed that strength testing of sea ice can be readily carried out in the field using relatively simple equipment, provided care is taken to control the factors that affect strength and deformation properties.
5 ,
,
,,
,,
,,
.
,
,,
.
Asmus, S . A . Digby, I. Kilukishak, M . Komangapik,rn S . Koonark, and L. B. Solar for their assistance in the
3 . 5 10-4uf field, and to R . Jerome for his assistance in carrying out
4
d
-
I
( N E W . F R A Z I L ) the data analysis.
This paper is a contribution from the Division of Building Research, National Research Council of
cu
Canada, and is published with the approval of the Director of the Division.
- ( N E W . C O L U M N A R . llc)
-
OLD. C O L U M N A R NEW. C O L U M N A R . Ilc NEW. F R A Z t L 0" ' " " ' . " ' ~
1 . 0 1 2 3 4 5 6 7 8FIG. 15. Relations between stress and strain at upper yield.
I
Rate sensitivity of strength, that is, increase in strength with increase in rate of loading, was similar for the three types of ice studied, namely, first-year columnar- grained and frazil ice, and multi-year columnar-grained ice. This rate sensitivity has also been shown t o be similar t o that previously measured in fresh-water ice. Strength and ductility at a given rate of loading, howev- er, depend on the type of ice, that is, o n texture, fabric, impurity, and air bubble inclusions. Consequently, large variations in strength and deformation can be ex- pected if strength tests are performed without strict at- tention t o the structural differences in the types of ice.
Acknowledgements
T h e author is most grateful to R . 0 . Ramseier for the
opportunity to participate in the A E S I E M R
"Radarsat-198 1" program at Mould Bay, and would
like t o express his thanks for financial support by AES.
H e wishes also t o express his sincere thanks to K . W.
FREDERKING, R., and TIMCO, G. W. 1983. Uniaxial com-
pressive strength and deformation of Beaufort Sea ice. VTT Symposium 27. The Seventh International Conference on Port and Ocean Engineering under Arctic Conditions (POAC), Helsinki, Finland, April 5-9, 1, pp. 89-98.
MICHEL, B., and RAMSEIER, R. 0 . 1971. Classification of
river and lake ice. Canadian Geotechnical Journal, 8( 1 ),
pp. 36-45.
NAKAWO, M. 1983. Measurements on air porosity of sea ice.
Annals of Glaciology, 4, pp. 204-208.
NAKAWO, M., and SINHA, N. K. 1981. Growth rate and
salinity profile of first-year sea ice in the High Arctic. Journal of Glaciology, 27(96), pp. 3 15-330.
SINHA, N. K. 1981a. Rate sensitivity of compressive strength
of columnar-grained ice. Experimental Mechanics, 21(6), pp. 209-219.
1981 b. Comparative study of ice strength data. Pro-
ceedings, International Association for Hydraulic Research
Symposium on Ice, QuCbec, Vol. 1 I, pp. 581 -595.
1982. Constant strain- and stress-rate compressive strength of columnar-grained ice. Journal of Materials Science, 17(3), pp. 785- 802.
1983a. Field test 1 of compressive strength of first-
year sea ice. Annals of Glaciology, 4, pp. 253-259.
19836. Field tests on rate sensitivity of vertical strength and deformation of first-year columnar-grained sea ice. VTT Symposium 27. The Seventh International Conference on Port and Ocean Engineering under Arctic Conditions, Helsinki, Finland, April 5-9, 1, pp. 23 1-242. WANG, Y. S. 1979. Crystallographic studies and strength
tests of field ice in the Alaskan Beaufort Sea. Proceedings, Fifth International Conference on Port and Ocean En- gineering under Arctic Conditions. Trondheim, Norway, Vol. 1, pp. 651-665.
WEEKS, W. F., and COW, A. J. 1978. Preferred crystal orientations in the fast ice along the margins of the Arctic Ocean. Journal of Geophysical Research, 83(C10), pp. 5105-5121.
1980. Crystal alignment in the fast ice of Arctic Alaska. Journal of Geophysical Research, 85(C2), pp. 1137-1146.