Host-parasite network structure is associated with community-level immunogenetic diversity
Texte intégral
Figure

Documents relatifs
Male pipefish show significant growth allometry, with disproportionate growth in the brooding tail region relative to the trunk, resulting in increasingly skewed region-specific
Le lactate sanguin était plus bas pour le groupe massage, mais seulement à un moment de la récupération (vingt minutes après l’effort) (Moraska, 2005).. Hemmings
Moreover, we also show in this article that the beam broadening spectral width of an oblique beam may be exceedingly narrow, if the radar beam is subject to specific vertical
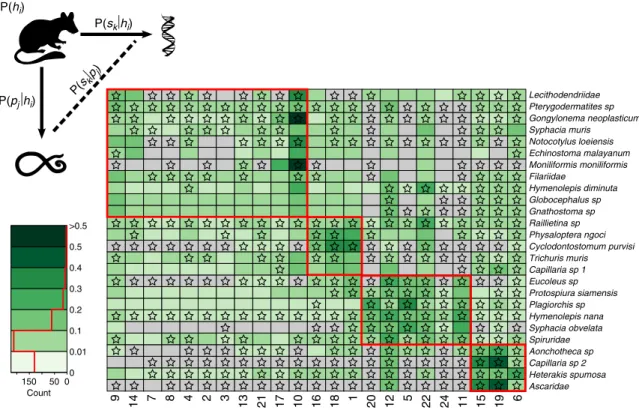
To examine the factors that affect the roles that individuals play in potential parasite transmis- sion, we projected each of our single- and multi-species bipartite
L’archive ouverte pluridisciplinaire HAL, est destinée au dépôt et à la diffusion de documents scientifiques de niveau recherche, publiés ou non, émanant des
In our approach, we reformulate the problem as an optimization problem: Given the poly- nomial pair (f, g) of a given degree, we look at the nearest polynomial pair (p, q) of the
Keywords: X-ray diffraction, structure analysis, quasicrystals, EXAFS Keywords (user supplied): local order... For Peer Review Only Chemical decoration in cubic
-3 يمهلأا : يس يسلا حضتت يمهلأا يس يسلا ح يس ل درك لعف رش بم نم لم عت ل دلا عم ضعب ضعبلا اد يزلا يح يسلا لد بتملا نيب د ل بعل كرحلا يح يسلا ار د م ه يف قلاعلا يل
