Aerodynamic Drag on Deformable and Active
Structures in High Reynolds Number Conditions
by
Mark Andrew Guttag
Submitted to the Department of Mechanical Engineering
in partial fulfillment of the requirements for the degree of
Doctor of Philosophy
at the
MASSACHUSETTS INSTITUTE OF TECHNOLOGY
February 2018
@
Massachusetts Institute of Technology 2018.
Author ...
Certified by.
All rights reserved.
Signature redacted
Department of Mechancal Engineering
December 31, 2017
3ignature
redacted
Pedro M. Reis
Professor of Mechanical Engineering Ecole Polytechnique Federale de
Lausanne (EPFL), Switzerland and Visiting Associate Professor of
Civil and Environmental Engineering, Massachusetts Institute of
Technology
Thesis Supervisor
A ccepted by ...
ARCHIVES
MASSACHUSM79S INSTITUTE OF TECHNOLOGYFEB 09 2018
Signature redacted
Rohan Abeyaratne
Aerodynamic Drag on Deformable and Active Structures in
High Reynolds Number Conditions
by
Mark Andrew Guttag
Submitted to the Department of Mechanical Engineering on December 31, 2017, in partial fulfillment of the
requirements for the degree of Doctor of Philosophy
Abstract
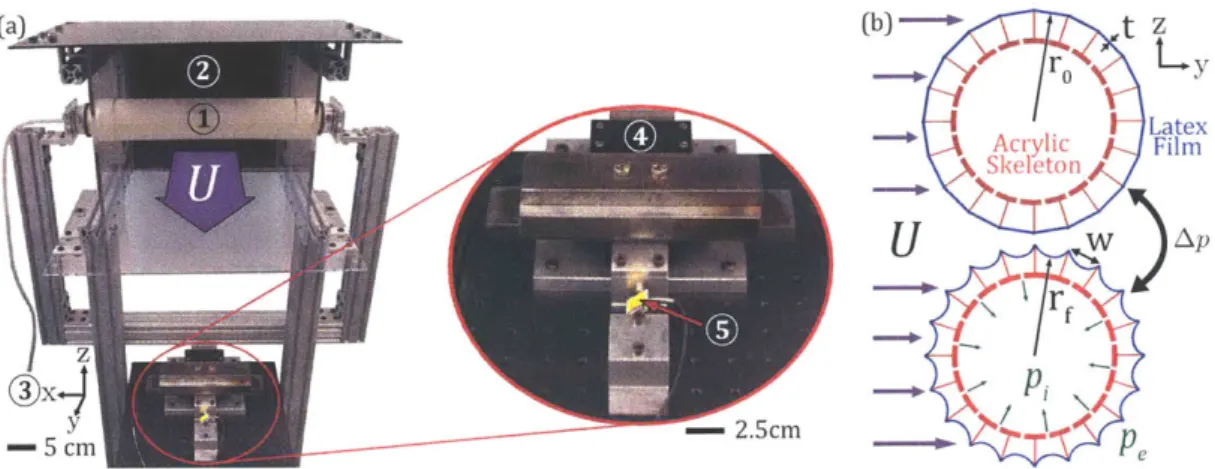
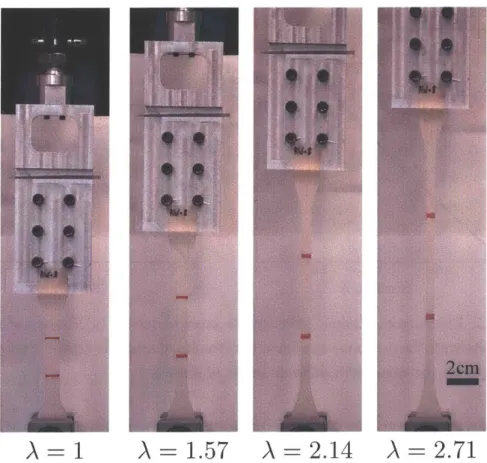
We explore the effect of topography on the aerodynamic behavior of deformable struc-tures, at high Reynolds numbers. We first introduce a novel mechanism to control the aerodynamic drag on cylinders, in the critical Reynolds number regime. We created both axially grooved and dimpled specimens, comprised of latex membranes stretched over rigid acrylic skeletons. By decreasing the internal pressure of the specimens, the latex stretched inward thus changing the shape of the surface. Using a combination of finite element simulations and precision mechanical experiments, we characterized the relationship between the mechanical deformation in the membrane and pneumatic loading. Wind tunnel experiments were used to explore how changing several geo-metric parameters, of both grooved and dimpled cylinders, affected the aerodynamic
performance. We also used the tunable nature of the specimens to automatically
control the dependence of the drag coefficient on the Reynolds number. Additionally, we studied the effect of holes in thin flexible strips at high Reynolds numbers. In this investigation, instead of controlling the deformation of the specimens, we modified the initial geometry by cutting holes in strips and examined the deformation under uniform aerodynamic loading. We used a combined experimental and numerical ap-proach to study the effect of perforation on the drag coefficient. The work presented in this thesis, represents an important first step towards utilizing deformation to control the aerodynamic performance of structures.
Thesis Supervisor: Pedro M. Reis
Title: Professor of Mechanical Engineering Ecole Polytechnique F6derale de Lausanne (EPFL), Switzerland and Visiting Associate Professor of Civil and Environmental Engineering, Massachusetts Institute of Technology
Acknowledgments
The work completed in this thesis could not have been completed alone, and I had a tremendous amount of help and support from a number of people.
First, I would like to thank my adviser, Pedro Reis. At points early on in my PhD it seemed like nothing was going right, but your constant encouragement and guidance allowed me to push on and complete this work. You have been an amazing adviser and friend, and are always a pleasure to work with.
Second, I would like to thank Mary Boyce who was my adviser for my masters. Mary, from the moment I set foot on MIT's campus you made me feel like this was the right place for me. You helped me realized how much fun academic research could be and led me to become a better scientist and engineer.
I would also like to thank the other members of my committee; Mark Drela, Peko Hosoi and Xuanhe Zhao. Since our first committee meeting, your feedback has been invaluable and integral to the completion of this work.
Many members of the EGS.Lab provided help at various stages of this work. In particular, the work presented in Chapter 5 was done in close collaboration with Hussain Karimi and Claudio Falc6n.
Finally, I would like to thank my family; Mom, Dad, Addie, Michael, Andrea and David. My entire life you have all pushed me to be the best I can be in every endeavor. I feel incredibly blessed to have you all in my life, and I know that you are all there for me when I need you.
I especially want to thank my Mom and Dad for everything you've done to get me to this stage in my life. Your passion for education is the reason that I pursued a PhD. Mom, without you pushing me to join the Science Olympiad team in high school I might have never become an engineer. And Dad, I feel incredibly lucky to have had you as an extra adviser at MIT, and I always value your sage advice.
Contents
1 Introduction and Literature Review 9
1.1 Aerodynamic drag on bluff bodies . . . . 12
1.2 Drag reduction strategies . . . . 17
1.3 The effect of dimples on drag . . . . 22
1.4 Drag on grooved cylinders . . . . 25
1.5 Flexible structures . . . . 29
1.6 Effect of Porosity in Rigid Structures . . . . 33
1.7 O utline of Thesis . . . . 34
2 Aerodynamic drag on deformable grooved cylinders 37 2.1 M otivation . . . . 38
2.2 Wind tunnel experimental setup and sample fabrication . . . . 41
2.3 Material characterization of the latex . . . . 44
2.4 Mechanics of deformation of the surface . . . . 48
2.5 Aerodynamic drag characterization with wind tunnel experiments . . 51
2.6 C onclusion . . . . 59
3 Aerodynamic drag on deformable dimpled cylinders: a parameter study 61 3.1 M otivation . . . . 62
3.2 Design, fabrication and assemblage of the experimental specimens . . 63
3.3 Mechanics of deformation of the dimples during pneumatic actuation 66 3.4 Wind tunnel experiments on fixed dimpled specimens . . . . 71
3.5 Conclusions . . . .
4 Programmable aerodynamic drag control on dimpled cylinders 93
4.1 Minimizing drag by actively changing the dimple depth . . . . 94
4.2 Programmable drag by actively changing the dimple depth . . . . 96
4.3 Limitations on the active control mechanism . . . . 100
4.4 Conclusions . . . . 103
5 Aeroelastic deformation of a perforated strip 105 5.1 Introduction . . . . 106
5.2 Procedure of wind tunnel experiments to test perforated flexible strips 107 5.3 Details of the numerical model . . . . 111
5.4 Validation of the numerical model against experiments . . . . 116
5.5 Design and characterization of the strips . . . . 119
5.6 Drag coefficient of the perforated elastic strips . . . . 124
5.7 Results of experiments in the vertical configuration . . . . 128
5.8 Discussion of results . . . . 131
5.9 Conclusion . . . . 133
6 Conclusion 135 6.1 Summary of Findings. . . . . 135
6.2 Limitations and Future Work . . . . 138
6.3 Final Rem arks. . . . . 140
Chapter 1
Introduction and Literature
Review
Any solid structure placed into a moving fluid (or a structure moving through a sta-tionary fluid) will experience forces exerted by the fluid. If the fluid is air (or another gas) these forces are known as aerodynamic forces, and are typically decomposed into two main components: lift and drag. Lift forces are perpendicular to the direction of relative motion, whereas drag forces are in the direction of fluid motion.
This thesis will focus on aerodynamic drag forces. Specifically, we will present results of experimental and numerical work performed to measure the effect of vary-ing the geometry of bodies, either actively or passively, on the drag force. We utilize cylindrical bodies with variable surface shapes to modify the drag, and use this mech-anism to actively control the aerodynamic performance. Additionally, we study the effect of adding porosity to flexible structures on their drag coefficient.
Depending on the context, aerodynamic forces can be either beneficial or detri-mental, and play an important role in nature and many engineering applications. In nature, plants have evolved to make use of aerodynamic forces for different purposes. While some plants rely on insects and birds to drive the pollination process, a mul-titude of other plants make use of wind pollination, also known as anemophily, to distribute pollen [1, 2,3,4]. In anemophilous plants, pollen can be carried up to 100 km by the wind before pollination occurs [5]. To make efficient use of the wind to
distribute their seeds, anemophilous plants tend to have small pollen grains (20 - 60
microns in diameter) which can be easily carried by the wind [4]. The pollen grains of many anemophiles, have air filled cavities to increase the buoyancy and thus improve the efficiency of pollen distribution [6].
In addition to its contributions to the reproductive process, the wind also plays an important role in the growth of plants. Despite the Reynolds number on a leaf being relatively low (generally Re < 104), the boundary layer at the surface of leaves is generally turbulent throughout [7]. The turbulent boundary layer enhances the gaseous exchanges through the surface of the leaves necessary for photosynthesis to occur [8]. In addition to this direct influence, the wind can also indirectly influence the photosynthetic cycle [9, 10]. The motion caused by wind affects the amount of light that reaches the leaves inside of the canopy, which is a critical factor in photosynthesis [9, 10].
While aerodynamic forces may benefit plants in their reproduction and growth, the wind can also have detrimental effects on plants. The lateral drag forces induced by high winds can be large and potentially damaging to plants. In order to resist these side forces and prevent harm, plants have evolved different mechanisms including massive trunks [11], expansive root systems [11], complex surface textures [12] and even the ability to reconfigure their shape [13].
While evolution occurs over generations, on a shorter time scale the forces exerted on plants by the wind can affect the growth of individual plants. The response of plants to mechanical loading is known as thigmomorphogenesis [8]. A mechanically stimulated plant will grow a shorter and stockier stem, compared to one that has not been stimulated [14]. This effect was studied in tomato plants, where it was found that the entire plant would stop growing in response to local strains in the stem [15]. Like momentary stimulation, exposure to regular loading throughout their lifetime can also effect plants. For example, the branches of trees exposed steady to winds are thicker than those that are not [16].
Just as in plants, animals have evolved to make use of aerodynamic forces. The ability to fly is necessary for many animals to survive, and the interaction between
the wings and air generates the lift forces required to sustain flight. The mechanics of flapping flight have been studied extensively [17,18,19]. Small animals can fly over a range of speeds and are capable of hovering, whereas large birds usually only fly at a narrow range of speeds and require space for takeoff [20]. For winged flight, higher speeds generally produce more lift, thus it is thought that larger birds are incapable of hovering or flying at very low speeds, because of the higher lift forces required to counteract gravitational forces [20].
As in nature, aerodynamic forces can be helpful or harmful in man-made appli-cations. The canonical example of an application that harnesses aerodynamic forces is airplanes. At sufficiently high speed, the flow over the wings produces lift forces equal to the weight of the plane, allowing it to fly. To reduce their speed for landing, airplanes utilize air brakes that increase drag. Similarly to air brakes, parachutes harness drag forces to reduce speed [21].
In cars, aerodynamic forces also play an important role. Drag forces exerted on a moving vehicle cause a reduction in fuel efficiency, and lift forces oriented upward degrade their maneuverability [22,23]. When lift forces are oriented downward, vehicle performance can be increased by improving tire adhesion [24]. This mechanism is exploited in race cars through the addition of structural features like small wings, or
by modifying the geometry of the vehicle body [24].
While aerial and ground vehicles generally use their own motion to generate aero-dynamic forces, wind loading on stationary structures must often be accounted for during the design process. For example, the primary concern in the design of a bridge is the ability to withstand heavy vertical loads without collapsing. However, if the wind force is not considered, catastrophic failure can occur because of wind induced self-excitation [25]. Likewise, the designs of modern skyscrapers must also account for aerodynamic forces. For example, in the design of the Burj Khalifa (the tallest building in the world at the time of writing), complex modeling and experimentation was done to help inform the final shape of the building to minimize the detrimental effects of wind on the building [26,27]. Ultimately, through a combination of aerody-namic and structural design, on a windy day the top floor of the 828 m tall building
only sways about 1.5 m [28].
The research presented in this thesis is inspired by observations from both nat-ural and man-made products. For example, inspired by the Saguaro cactus, we will investigate the drag forces on longitudinally grooved cylinders (Chapter 2). We shall design and fabricate specimens with tunable topography to study the effect of dif-ferent groove geometries. Inspired by the drag reduction caused by dimples on golf balls, we study the effect of dimples on the aerodynamic performance of cylinders (Chapter 3). We will examine how modifying the depth, size and array of dimples can influence the drag on cylinders. The novel active specimens used for this work allow for the continuous transformation of the surface topography and thus a more thorough exploration of the effect of different geometries on drag. In addition, we will utilize the tunable nature of both the grooved and dimpled cylinders to control the aerodynamic performance, specifically the relationship between the drag coefficient and the Reynolds number (Chapter 2, 4). Finally, we will study the combined effect of flexibility and porosity on the drag of structures using a combined numerical and experimental approach (Chapter 5).
1.1
Aerodynamic drag on bluff bodies
There are two main contributions to the drag force on a solid object placed in a fluid flow: friction drag (sometimes referred to as skin friction) and form drag (also known as pressure drag). Friction drag arises from tangential viscous forces and form drag arises from normal pressure forces over the surface of the structure [29]. Throughout this thesis, we will focus on bluff bodies which have separated flow over a significant portion of the surface [30]. By contrast, streamlined bodies generally have attached flow on most of the surface. Flow separation is a phenomenon characterized by the boundary layer breaking away from the surface of the structure because of an adverse pressure gradient [31]. Bluff bodies are ubiquitous, and examples range from high-rise buildings [26] to automobiles [32] and even cyclists [33].
used to quantify the magnitude of the drag force. The drag coefficient is a dimension-less number that takes into account both the friction and form drag on the object, and is defined as
Fd
Cd =
(11)
SpU2A
where Fd is the total drag force, p is the density of the fluid, U is the relative velocity of the fluid and A is a reference area. Depending on the type of object, the reference area has different conventions. Typically, for bluff bodies, the frontal area (the 2D projection of the body as seen from the stream) is used [31]. The drag coefficient of an object is not a constant; it is a function of the Reynolds number, defined as
Re=PUL (1.2)
where L is a characteristic length of the object, and p is the dynamic viscosity of the fluid. For cylinders, the characteristic length is typically the diameter. Fig. 1-1 shows the drag coefficient of a smooth cylinder as a function of the Reynolds number [29,
34,35, 36, 37,38].
As a characteristic example, to describe the flow field around bluff bodies, we will focus on cylindrical geometries in this introductory chapter. This is also the geometry
that we will work with in Chapters 2 - 4. Depending on the Reynolds number,
the flow has different characteristics. For very low Reynolds number (Re < 4) the flow stays attached to the surface as shown in the schematic diagram of Fig. 1-2(a). In this regime, the drag is very high and is caused entirely by skin friction [39]. As the Reynolds number increases (4 < Re < 40) eddies form on the rear of the cylinder and remain attached to the body as shown in Fig. 1-2(b). In these relatively low Reynolds number regimes, the drag still arises primarily from skin friction [29]. Further increasing the Reynolds number (40 < Re < 400), the wake becomes unstable
and vortices are alternately shed [29]. Initially, the vortices, known as the "von
Kairmin vortex street," are not steady in this regime. However, the vortices become turbulent and organized when the Reynolds number is increased [29,40]. This regime
xx x 10'-0 b0 +,+++ + - 10-- 10-1-10-1 100 10 1 102 103 10 4 105 106 1 07
Reynolds Number
Figure 1-1: The variation of the drag coefficient of a smooth cylinder with the Reynolds number. The different symbols represent data from Wieselsberger [34],
Delany and Sorenson [35], Finn [36], Tritton [37] and Roshko [38]. This figure was
adapted from Panton [29].
is schematically shown in Fig. 1-2(c, d). At even higher values of Reynolds number (typically Re ,> 100) the drag primarily consists of pressure drag, and the contribution of skin friction is small.
In the lower Reynolds number regime (Re < 400), the drag coefficient is a
mono-tonically decreasing function of Reynolds number and scales as Cd ~ Re-1. However,
in the range of 400 < Re < 3 x 10⁵ the drag coefficient is nearly constant at a value
of about Cd = 1.2. As the Reynolds number is increased past Re ~ 3 x 10⁵, there
is a steep drop, followed by a quick recovery of the drag coefficient and ultimately a plateau at very high Reynolds number. Using the nomenclature presented by Achen-bach in his seminal work on rough cylinders [41], we define the regimes prior to the
drop in Cd, the decrease of Cd, the increase of Cd and the plateau as the subcritical,
critical, supercritical, and transcritical regimes, respectively. This dependence of Cd
on Re, is known as the drag crisis, and is shown schematically in Fig. 1-3.
The drag crisis occurs only at high Reynolds numbers, and for cylinders can
(c)
(d)
(g)
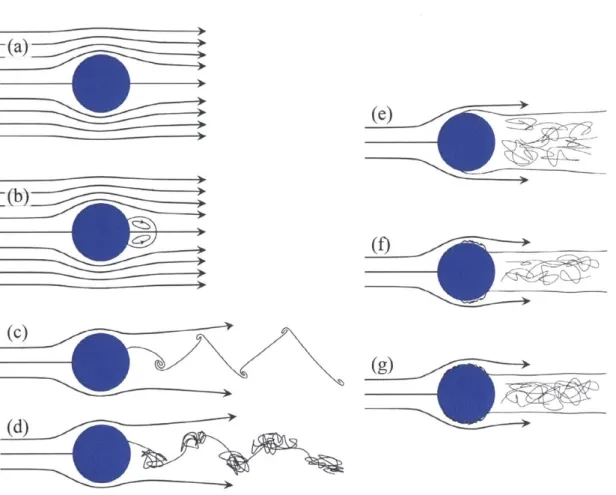
Figure 1-2: Schematic diagrams of the flow around a cylinder in different Reynolds number Regimes. (a) Re < 4: fully attached flow. (b) 4 < Re < 40: attached eddies on the rear of the cylinder. (c, d) 40 < Re < 400 alternating vortex shedding of initially non-turbulent vortices (c) then at higher Re the vortices are turbulent (d). (e) 400 < Re < 3 x 10⁵ laminar boundary layer separation causing a large turbulent wake. (f) 3 x 10⁵ < Re < 1.5 x 10⁶ laminar separation and turbulent reattachment
delays separation. (g) Re > 1.5 x 10⁶ the boundary layer transitions to turbulence before separation. The exact values of the Re of each regime can vary slightly. The values for the transitions between the various regimes were adapted from Panton [29].
subcritical regime, the flow produces a laminar boundary layer that separates on the surface of the cylinder just before the center line (at about 800 measured from the stagnation point [29, 41]). After the flow separates, it produces a large turbulent wake as shown in Fig. 1-2(e). In the critical regime, the laminar boundary layer still separates early on the cylinder, but then reattaches as a turbulent boundary layer, creating a region known as the separation bubble [41,42]. The turbulent boundary
(e)
(~a)
Ab
-1
Subcritical Critical Supercritical Transcritical
Reynolds Number
Figure 1-3: Schematic diagram of the functional dependence of the drag coefficient on the Reynolds number around the drag crisis. For cylinders, the Reynolds numbers shown here schematically fall approximately in the range Re = 104 ~ 107, as shown
in Fig. 1-1. This figure was adapted from Achenbach [41].
layer remains attached to the surface of the cylinder for much longer, and separates around 120', measured from the stagnation point [29]. This produces a much smaller wake region than the subcritical regime, thus causing a reduction in drag. Fig. 1-2(f) shows a schematic of this phenomenon with a greatly exaggerated separation bubble. In the supercritical regime, the boundary layer transitions directly from laminar to turbulent before the flow separates, and separation occurs on the rear of the cylinder, as shown in Fig. 1-2(g) [38,41]. As the Reynolds number increases, the boundary layer transitions to turbulence earlier on the surface [29]. In the transcritical regime, the boundary layer is turbulent everywhere on the surface of the cylinder, except very close to the stagnation point, and the drag coefficient stabilizes [41].
In this thesis, Chapters 2, 3 and 4 focus on the drag on cylinders at Reynolds num-bers around the drag crisis. In this work, we did not perform any flow visualization experiments. While we did not directly study the flow field, the underlying principles presented in this section hold. By modifying surface topography of the cylinders, we show that it is possible to manipulate the dependence of the drag coefficient on the
Reynolds number.
1.2
Drag reduction strategies
There has been considerable research on methods to modify the flow around bluff bodies. One major point of focus has been strategies to reduce the drag forces on structures [32, 41,43,44, 45,46,47]. This type of research has numerous engineering applications where drag forces are important, ranging from the automotive indus-try where reducing drag can improve fuel efficiency, to the sports indusindus-try where optimizing a dimple pattern can improve the performance of golf balls [48].
We will classify drag reduction strategies into two categories: active and passive. Active strategies require an input of power to the system in order to modify the drag characteristics, while passive strategies require no power input and generally rely on modifications to the initial geometry of the system.
There are many examples of active drag reduction strategies that utilize various mechanisms. They can either interact with the boundary layer on the surface of the body, or they can directly affect the wake [32]. Methods that interact with the boundary layer generally are intended to delay the separation point by enhancing the momentum of the fluid in the boundary layer [32]. In contrast, direct-wake control effects the flow field in the wake, often by directly affecting how the vortices interact [32].
One heavily studied active drag reduction strategy is the use of oscillatory mo-tion [43, 44, 49, 50, 51]. The oscillamo-tion of cylinders is intended to alter the structure and frequency of the vortex shedding into the wake. It had been shown that for translational oscillations, vortex shedding in the wake locks in phase with the applied periodic forcing causing the vortex shedding to strengthen, thus increasing the mean drag force on cylinders [50,51]. However, rotary oscillation has been shown to be ca-pable of reducing drag forces [43,44,49]. In particular, at Re = 15, 000, for a cylinder
undergoing sinusoidal angular oscillation a drag reduction of up to 80% was observed along with a lock-in of the vortex shedding frequency with the forcing frequency [43].
Figs. 1-4(a) and (b) show flow visualization results of the wake of a stationary (a) and rotary oscillating cylinder (b), respectively [43]. The much narrower wake in the rotary oscillation leads to a significantly lower drag [43].
Other active strategies to reduce drag utilize time-periodic blowing and suction at the surface of bodies [32,45,46]. In one study, experiments were performed on a sphere with an axisymmetric slit in the surface just upwind of the separation point [45]. Us-ing a speaker, a time periodic signal with a frequency higher than the natural sheddUs-ing frequency induced alternating blowing and suction at the surface [45]. When the spec-imen was exposed to uniform flow in the subcritical regime ( Re = 6 x 10⁴ ~ 2 x 10'), a drag reduction of nearly 50% was attained [45]. Using flow visualization techniques and surface pressure measurements, it was discovered that the drag reduction was caused by an introduction of a flow phenomenon similar to the separation bubble, which delayed the final separation [45]. The presence of the separation bubble in-dicates a mechanism of drag reduction very similar to the one that causes the drag crisis of a smooth cylinder described in Section 1.1 [45].
A similar strategy making use of time-periodic blowing and suction has been
employed to reduce the drag on cylinders at lower Reynolds numbers (Re = 47 ~
3900) [46]. In this numerical study, spatially distributed and time periodic blowing
and suction was applied on the upper and lower surfaces of the cylinder as shown in Fig. 1-4(c) [32,46]. A drag reduction of up to 25% was found at the upper range of
Reynolds number explored (Re = 3900) [46]. This method of drag reduction directly
affected the vortex shedding rather than altering the separation point. Thus it is applicable to geometries with fixed separation points, and was shown to effectively reduce the drag on a 2D model vehicle with a blunt trailing edge [32,52].
Another active method that directly interacts with the wake in order to reduce drag, is known as base bleed [32,47, 53,54]. Base bleed is similar to the blowing and suction concepts presented above, however a steady flow of fluid is injected directly into the wake from the rear of the body, as shown in Fig. 1-4(d) [47]. The bleed flow interferes with the vortex formation, weakening the vortices and increases the base pressure at the rear of the body, thus decreasing the drag [32,47]. While base bleed
does effectively reduce drag it also requires a constant input of power to produce the bleed flow.
A common passive method to reduce the drag using direct wake interaction, is
known a splitter plate [32, 55, 56, 57, 58]. A splitter plate is a plate that is placed behind the body, in the center of the wake, and alters the interaction of the top and bottom shear layers. Like base bleed, splitter plates weaken the vortices and increase the base pressure at the rear of the body [32].
(a)()
(b) (d)
S Stagnation point
Figure 1-4: Methods of active drag reduction. (a, b) Visualization of the flow behind a cylinder without (a) and with (b) high frequency rotary oscillation [43]. Images adapted from Tokumaru and Dimotakis [43]. (c) Schematic diagram of distributed forcing using blowing and suction on the surface of a cylinder [32]. Image adapted from Choi et al. [32]. (d) Schematic diagram of the flow resulting from base bleed in the wake [47]. Image adapted from Bearman [47].
While splitter plates are a passive drag reduction technique that utilizes the method of direct interaction with the wake, many passive drag reduction strate-gies alter the boundary layer flow to delay separation. In order to delay separation, the adverse pressure gradient must be overcome by increasing the momentum in the boundary layer [32]. On bluff bodies, this can be achieved by either laminar separation and turbulent reattachment of the flow, or through direct transition of the boundary layer from laminar to turbulent before separation [32]. Recall from Section 1.1 that
both these methods occur naturally on bluff bodies around the drag crisis. The sepa-ration bubble occurs in the critical regime [41,42], and direct transition to turbulence occurs in the supercritical and transcritical regimes [38,41]. For boundary layer in-teractions to effectively reduce the drag, the Reynolds number must be large enough to induce a boundary layer instability, yet small enough to be below the Re at which the separation bubble naturally occurs [32]. This means that boundary layer control
methods are applicable in the subcritical regime [32].
Regarding passive drag reduction strategies, surface roughness is the classic ex-ample that affects the boundary layer. The effect of surface roughness has been thoroughly studied in numerous geometries [41, 59,60,61,62,63]. Achenbach, in his seminal papers on the effect of surface roughness on cylinders [41] and spheres [59], found that adding sand grains to a bluff body can significantly reduce the drag in the subcritical regime. For roughened spheres and cylinders he was able to reduce the drag by a factor of 5 [59] and 2 [41], respectively. He found that bluff bodies with sur-face roughness exhibit a rapid decline in the drag coefficient with increasing Reynolds number until reaching a minimum, at which point the drag quickly increases until reaching a plateau as shown in Fig. 1-5. Achenbach also showed that, by increasing the scale of surface roughness, the critical Reynolds number (i.e. the Re at which the drag coefficient was minimized) decreased and the minimum Cd increased [41,59].
Examining the local pressure and skin friction distributions on the surface of the cylinders, Achenbach determined that the steep decline in drag coefficient was accompanied by the presence of a separation bubble [41]. In the supercritical regime, the boundary layer directly transitioned from laminar to turbulent before separation occurs [41]. The similarities between the rough and smooth cylinders in both the functional dependence of Cd on Re (albeit shifted), shown in Fig. 1-5, and the flow characteristics clearly indicate that the introduction of surface roughness causes a change in the behavior of the drag crisis [41,59,60,61].
In many studies, the surface roughness was created through the adhesion of grains to the surface in an unorganized pattern [41,59,64]. However, many studies have used organized patterns on the surface to achieve drag reduction [32,65]. One such example
I-2 1.0 0-8 10-6 0-4 10' 2 5 105 2 5 5 Re=U, D~v
Figure 1-5: The dependence of drag coefficient on the Reynolds number for rough cylinders with different levels of roughness. Image adapted from Achenbach [41].
is the use of vortex generators [32,65,66]. Vortex generators are devices, with height on the order of the boundary layer thickness, placed on the surface of structures before the separation point [32]. They produce vortices in the boundary layer which increase the lateral mixing in the boundary layer thus delaying separation [32,65,66].
In addition to vortex generators, the drag reduction capabilities of many other organized surface modifications have been studied [48,61,64,67,68]. One study ex-amined the difference in drag on circular cylinders with patterned surfaces and uni-formly roughened surfaces [64]. They created a grid-like pattern on the surface with a roughness coefficient (i.e. the physical scale of the roughness) the same as that as a surface with uniform roughness and performed experiments to determine the drag coefficient [64]. They found that in the transcritical regime, the drag coefficient of the patterned surfaces was lower than that of the roughened surface [64]. This result is similar to that of many studies on dimpled bluff bodies, which is the focus of the next section. . =9D= x 1 0 kD=450x 10 ________________ ___________ Sm ot 107 106
1.3
The effect of dimples on drag
Golf balls are the canonical example of dimpled surfaces used for drag reduction. From the inception of the game of golf, there has been a desire to maximize the length a ball will travel. After the introduction of a soft remoldable ball known as the "Gutta-percha" ball in 1845, it was found that balls with marked up surfaces actually flew farther than smooth balls [48]. The first patent for the use of dimples on a golf ball was based on this observation [69]. In the years since the introduction of dimples on golf balls, there have been a significant number of studies on utilizing dimples to reduce drag or control the flow on surfaces [32,48,61,67,68,70,71,72].
One early study by Bearman and Harvey [48] on the aerodynamics of golf balls, involved performing wind tunnel experiments on golf balls with a dimple depth to sphere diameter ratio of d/D = 9 x 10 3. They compared the results from wind tunnel
tests on golf balls, to those of both smooth spheres and rough spheres [48,59,73]. In previous works on both smooth and uniformly roughened spheres, after the drag coefficient reached a minimum, a steep increase and subsequent plateau of Cd were observed in the supercritical and transcritical regimes [59, 73]. In golf balls it was found that the dimples induced an earlier drag crisis, and after the initial drop in
Cd the steep increase in Cd generally associated with the supercritical regime did not occur [48]. Instead, after the critical regime Cd did not increase significantly and instead only increased slightly with Re as shown in Fig. 1-6a.
More recently, the mechanism for this drag reduction and subsequent nearly con-stant drag coefficient has been studied by Choi et al. [67]. They performed wind tunnel experiments on dimpled spheres with a dimple depth to sphere diameter ratio of d/D = 4 x 10 3, in which they studied velocity of the flow above the surface using
a hot-wire probe [67]. Fig. 1-6(b) shows a schematic of the mechanism responsible for the drag reduction [67]. The flow separates at the front of the dimples, and reattaches
at the back, causing a separation bubble similar to that observed in the critical regime on a smooth sphere [32,67]. After the flow has reattached, the increased momentum in the boundary layer generated by the separation bubble delays the final
separa-(a)
golf boi05
(O _2 4250-0 -s _ -. - - - -0.1$~ I -- ' IsNbdh -,# Wwe 0t (b) generation by teserlyrInstabilitydknPla reattnehod flow with hbbe high momeftun
near the wall
(d) stiff film
soft
)Reattachment point Separatin point
0* I.25' 22.5' 33.75' 45' 56.25" 67.5' 78.75* 90* 101.25* 112.5* 123.75* 135*
(a) Type A
Reattachment point Separation point
01 11.25* 22.5* 33.75* 45* 56.251 67.5* 78.735 90* 101.25* 112.5' 123.75' 135* (b) Type B
Reattachment point Separation point
0* 11.25* 22.5* 33.75* 453 56.25' 67.5' '0.75 90 101.25 112.5 123.75 135 (c) Type C oE+04
(e)
ASn CD Km 4.sw 0.4 - DeMMUed SAM61th Reynolda number tOE.OeFigure 1-6: Aerodynamics of dimpled surfaces. (a) The dependence of drag coefficient on the Reynolds number for golf balls compared to smooth and uniformly roughened spheres. This figure was adapted from Bearman and Harvey [48]. (b) Schematic dia-gram of separation bubble formed in the dimples. This image was adapted from Choi
et al. [67]. (c) Diagram showing the differences in the flow, particular the separation
and reattachment points on dimpled spheres with different dimple depths. This image was adapted from Aoki et al. [74]. (d) Schematic of the wrinkling mechanism used to produce hemispherical specimens with tunable dimple depths. This image was adapted from Terwagne et al. [75]. (e) Comparison of the functional dependence of the drag coefficient on the Reynolds number for smooth, sand roughened and dimpled cylinders. This image was adapted from Bearman and Harvey [68].
tion point [67]. After the drop in Cd, the initial separation does not always occur at the same location (increasing the Re causes the initial separation to occur closer to the front of the body) [67]. However, in this Reynolds number regime, the flow always reattaches within the dimples and has the same final separation point [67]. The continuing presence of the separation bubbles, even after the initial drop in Cd, is different from the case of roughened surfaces. For roughened surfaces, after the
CO
1.0E.05
2 4 6 a 0 2 a to 2 4
critical Reynolds number the boundary layer directly transitioned to turbulence and the drag coefficient increases significantly [41]. In the subcritical regime, the increase in momentum caused by the separation bubbles in the earlier dimples is not high enough to overcome the adverse pressure gradient and delay the main separation, thus the Cd is still high (for spheres Cd= 0.5) [67].
A further study, by Aoki et al. [74], on the mechanism for drag reduction on a
dimpled sphere, examined the effect of changing the dimple depth. In this study the flow patterns were measured experimentally for dimpled spheres with various dimple depths (d/D = {7.9, 15.1, 18.8} x 10-3), and the results were compared to those of
Choi et al. [67]. Their findings were similar to those of surface roughness: increasing the depth of the dimples caused the critical Reynolds number to decrease, and the minimum drag coefficient to increase [74]. Moreover, Aoki et al. [74] observed that, for each specimen, the Cd increased slightly with Re above the critical Reynolds number, and the rate of increase was higher for the deeper dimples. Just as in the previous study by Choi et al. [67], they observed separation bubbles forming in the dimples [74]. They discovered the deeper dimples formed separation bubbles further upstream and the reattachment point shifted to the end of the dimple, which lead to the main separation point shifting further upstream as shown in Fig. 1-6(c) [74]. The separation occurring closer to the front of the body explains the higher Cd for the specimens with deeper dimples [74].
Another study that examined the effect of the dimple depth utilized the wrin-kling instability to create specimens with dimples that could change their depth [75]. Dimples were formed by depressurizing the cavity of hollow hemispherical specimens comprised of a soft foundation and a stiff outer film as shown in Fig. 1-6(d) [75]. Combining two hemispherical specimens, wind tunnel experiments were performed on a spherical body with dimples whose depths could be tuned by varying the pres-sure in the cavity [75]. The results from the wind tunnel tests were consistent with previous results; increasing the dimple depth induced an earlier drag crisis and a higher minimum drag coefficient [74,75. Therefore, at high Re a shallower dimpled specimen may have a lower Cd than a deeper dimpled one. However, at a lower Re,
the opposite may be true. As a result of this behavior there is no universal optimal dimple depth for all Reynolds numbers.
While spheres are the most commonly tested geometry with dimples, because of the direct application in golf balls, other geometries such as cylinders have also been studied [68, 76, 77]. For dimpled cylinders with dimple depth to cylinder diameter
ratio d/D = 9.1 x 10⁻³ the drag crisis is again found to occur earlier than for a
smooth cylinder [68]. Above the critical Reynolds number, the drag coefficient does not increase as much as for the sand roughened cylinder with similar scaled roughness,
as shown in Fig. 1-6(e) [68].
In Chapter 3, we shall expand on the existing literature on the drag on circular cylinders with dimples, by systematically varying the dimple depth. Additionally, we explore the effect on the drag profile of other parameters including the radius and arrangement of dimples. This exploration is done using specimens with the ability to actively change depth, allowing us to span a wide range of dimple depths with a single specimen. In Chapter 4 we utilize the active nature of the dimples to tune the
dependence of Cd on Re.
1.4
Drag on grooved cylinders
Similarly to dimples, modifying the surface of bluff bodies to include grooves can
reduce drag [12, 78, 79, 80,81,82,83, 84, 85]. While many of the studies on dimples
were inspired by the dimples on golf balls, numerous studies using longitudinal grooves have been inspired by the Saguaro cactus (Carnegiea gigantea). The Saguaro cactus, shown in Fig. 1-7(a), is essentially a large cylindrical structure with axial grooves that is able to withstand high wind speeds without toppling over [86]. It has been proposed that the grooves reduce the drag forces on the cactus, and this hypothesis has lead to many subsequent studies [12,79].
In a set of studies inspired by the Saguaro cactus, Talley et al. [12, 78] reported experiments that compare cylinders with different surface shapes (smooth, rough, and
studies, specimens with v-shaped grooves were machined with a depth to cylinder diameter ratios d/D = {35, 70, 105} x 10'. Within the tested range of Re, the
grooved cylinders showed a monotonic increase in Cd with Re, until asymptoting at
values in the range 1.04 < Cd < 1.13, depending on the groove depth (the deepest
(b) 1.4 12 1.0 0.6 0.4 0.2 1' (c) 1.4 1 9 0.6 0A 0.2 1 (d) Valley Valley Partial (0904) sepamfon
--A Tlangie exp. A Triangle cal. -o- Arc exp.
x10
* Arc cal. -- Smooth exp WVeselsberg
1 x1O0
er
1 x1o
Re
S20 grooves evcp -0c- 26 grooves exp. -- 32 grooves exp.
A 20 grooves Cal. N 26 groVes Cal,. 32 pooves cal.
4 amooth eRe. * Smooth Cal. ... Nakvjam&&Botahe
Ii
i
105 Re (e) ow Valley Valley Partial RSeparation Separato (9=9()Figure 1-7: Cactus inspired aerodynamic research. (a) Representative photograph of a Saguaro cactus (Scottsdale, Arizona) [87]. (b) Comparison of the dependence of the drag coefficient on the Reynolds number for cylinders with triangular and arc-shaped grooves. This image was adapted from Yamagishi and Oki [83]. (c) Comparison of the dependence of the drag coefficient on the Reynolds number for cylinders with different numbers of grooves. This image was adapted from Yamagishi and Oki [84].
(d - e) Flow visualization using the surface oil-film technique and numerical results
to determine the separation points on cylinders with triangular (d) and arc-shaped (e) grooves. These images were adapted from Yamagishi and Oki [83].
grooves providing the lowest Cd). This monotonic increase of Cd indicates that all specimens studied in these experiments were already in the supercritical and trans-critical flow regimes (i. e, the trans-critical Reynolds number was below the explored range
of Re; Re* < 2 x 10') [12,78].
A subsequent experimental and numerical study by Yamagishi and Oki [83]
ex-amined the effect of the shape of grooves on Cd over a range of Reynolds numbers
(Re ~ 1 x 10⁴ to 1 x 10'). Their experiments used specimens comprised of aluminum
cylinders with 32 longitudinal grooves machined into the surface. They examined both triangular and arc-shaped groove geometries with a depth to diameter ratio of
d/D = 10.4 x 10⁻³ [83]. In their experiments Yamagishi and Oki found that both the
triangular and arc-shaped grooves induced the drag crisis at the same Re, but the triangular-grooved cylinders exhibited a lower minimum drag coefficient and lower Cd in the supercritcal and transcritical regimes [83], as shown in Fig. 1-7(b). Combining
experimental results using the oil-film technique and numerical results at Re = 1 x 10⁵
(both shown in Fig. 1-7(d) and (e)), they observed a separation bubble forming in the grooves similar to that found in dimples [83]. For both groove shapes, the flow reattached within the grooves, however it reattached further upstream in the trian-gular grooves [83]. This lead to the main separation point being farther down stream for the triangular grooves (as shown in Fig. 1-7(d) and (e)) and thus a lower Cd in the transcritical regime [83].
Another more recent study focused experiments on cylinders with catenary shaped
grooves around the critical Reynolds number regime (Re = 2 x 10⁴ ~ 1.2 x 10⁵) [85]. In
this study, experiments were performed with cylinders of varying groove geometries. Specimens were tested with groove depth to cylinder diameter ratios of d/D = 1.7 x
10-3 and 3.3 x 10⁻³ and groove width to diameter ratios of w/D = 5.7 x 10⁻², 9 x 10⁻²
and 14 x 10-2 [85]. The sharpness of the grooves (i.e. how round they were) was changed by varying the shape factor in the catenary equation that defined the groove shape [85]. It was found that increasing the ratio, A*, between the area of all the grooves and the area of the cylinder, decreased the critical Reynolds number, and increased the minimum drag coefficient [85]. This finding was robust, independently
of whether A* was modified by changing the groove depth, groove width, or shape factor [85].
Another study, by Kimura and Tsutahara [82], examined the effect of the location
and depth of a single circular arc-groove (d/D = {17, 12, 7} x 10-3). Studying
the fluid flow, they found that for the deeper grooves there was recirculating flow (i.e. a separation bubble) in the grooves and a delayed separation. However for the shallowest groove, there was no recirculation detected, and the separation was only delayed slightly [82]. They also found that regardless of the the groove depth, the optimal location for the grooves to delay separation was 800 relative to the stagnation
point [82].
In addition to exploring groove depth and shape, the effect of the number of grooves has also been explored [84,85]. In a combined experimental and numerical study by Yamagishi and Oki [84], cylinders with 20, 26 and 32 triangular grooves were
tested. In this study the width and depth of the grooves were fixed (d/D = 10.4 x 10 3
and w/D = 7.5 x 10⁻²), meaning that the spacing between the grooves was varied [84]. They found that increasing the number of grooves decreased the critical Reynolds
number and made the drag crisis more gradual as shown in Fig. 1-7(c) [84]. A
separate study varied the number of grooves by varying the width of the grooves (w/D = 5.7 x 10⁻², 9 x 10⁻² and 14 x 10-2) and maintaining a constant spacing between them [85]. In this study, increasing the number of grooves was found to increase the critical Reynolds number [85].
From these existing studies, it is clear that different groove patterns effect the aerodynamic performance of cylinders. However, the parameter space explored ex-perimentally has been limited by the cost, both fiscal and temporal, of manufacturing different grooved specimens for each configuration. Additionally, a grooved specimen has a narrow range of Reynolds number for which it has low drag, and for all other Re
the Cd is higher. In Chapter 2, we will present the results of wind tunnel experiments
performed using cylindrical specimens with grooved surfaces that can actively change shape. The advantage of testing active specimens is twofold. First, we are able to study a wide range of groove depths with a single specimen. Second, we will show
that it is possible to actively change the surface shape so that the drag coefficient can minimized over a range of Reynolds numbers.
1.5
Flexible structures
So far, we have focused on fixed structures that are not deformed by fluid flow. However, many flexible bodies can be readily deformed by aerodynamic or hydro-dynamic loading. The class of problems relating to the interaction of deformable structures and a fluid moving relative to one another are known as fluid-structure interactions (FSI), and have been a topic of intense research [88,89]. To name just a few representative examples, FSI is prevalent in wide ranging areas including drag reduction in fish locomotion [90], high-speed printing on paper [91], aerodynamic instability of bridges [92, 93, 94, 95, 96], energy harvesting in wind-loaded flexible structures [97,98,99], the modeling of parachutes [100], the waving of flags and
ban-ners [101, 102,103] and the dynamics of wind-loaded flexible wings [104,105,106].
In this section, we will focus on FSI problems related to continuous flexible struc-tures. The reconfiguration of plant leaves under wind loading is a representative and instructive example of such an FSI problem. The self-adaptation of the shape of the leaf at different flow conditions relaxes the state of stress in the plant and reduces the possibility of damage such as uprooting [107]. The effect of wind loading can be quantified by measuring the drag force, Fd, acting on the plant leaves. As presented
in Section 1.1, drag forces can be written as Fd = !pU2L2
Cd, where U is the mean
speed of the flow, L is the typical length scale of the body, p is the density of the
fluid and Cd is the drag coefficient. Generally, Cd is a function of the Reynolds
num-ber, and the functional dependence is not known a priori. However, as discussed in Section 1.1, for bluff bodies at moderate to high Reynolds numbers, Ca is nearly a constant, and thus the drag force scales as Fd oc U2 [13].
In a series of studies on leaves and other flexible objects exposed to a steady flow [13,108], it has been shown that the possibility of reconfiguration (as shown in Fig. 1-8(a)) can lead to drag reduction such that the exponent with which drag scales
on U is reduced from the classic quadratic behavior; i.e. Fd oc U2+v where V < 0.
This exponent is commonly referred to as the Vogel exponent. Different types of plants have been shown to be associated with different values of V, in the range of
-1.3 < V < -0.1. The higher values of V occurred for tree branches, which is to be
expected since they are closer to static bluff bodies [131.
(a) 1ms (d) L U IP (b) W i --R F
-Figure 1-8: Flexible structures in flow. (a) Reconfiguration of a tulip tree leaf at
different wind speeds adapted from Vogel [108]. (b and c) Schematic diagram of
experiments to determined the Vogel exponent in different geometries. These images were adapted from Gosselin et al. [109]. (d) Schematic diagram of the flapping flag configuration commonly used to study flutter. This image was adapted from Eloy et
al. [102].
In order to explain the appearance of Vogel exponents as a way to understand drag reduction caused by the reconfiguration of flexible bodies, several reduced
mod-els for loading configurations have been proposed. In these modmod-els the complex fluid-structure interaction that reconfigures the shape of the flexible body is modeled by a reduced loading force [110,111,112,113]. Pioneering approaches to this problem first used dimensional analysis to determine the theoretical Vogel exponent for bending of
flexible beams and plates, found V = -2/3, which is in reasonably good agreement
with experiments [107]. A similar argument has been used to predict V for flexible structures in the asymptotic regime of large deformations with respect to the typical length scale of the flexible body. Gosselin et al. [109] coupled a simple model with experiments to determine the relation of the Cauchy number, C, (defined as the ratio of the force attributable to fluid loading on the plate to the bending rigidity of the plate per unit of length), to the Vogel exponent, as well as the extent of drag reduc-tion. These experiments were performed using a wind tunnel where both rectangular specimens and disks cut in along several radii were exposed to flow at moderate to
high Reynolds numbers; 6,400 < Re < 54, 000 as shown in Fig. 1-8(b) and (c). Over
this extensive range, the drag coefficient remains nearly constant for rigid bluff bod-ies. On the other hand, flexible objects, especially in the large deformation regime, led to different Vogel exponents. The model of Gosselin et al. [109] showed that, for a rectangular plate, the streamlining effect on drag reduction is dominant for small deformations. For large deformations the effect of projected frontal area reduction caused by reconfiguration is more significant.
With an alternative point of departure, Alben et al. [114,115] have used free-streamline theory to address the coupling between hydrodynamic loading and elastic bending on a fiber, specifically to establish how the aerodynamic drag scales with the flow velocity during reconfiguration. To explore this drag scaling, experiments were performed on a glass fiber of length L and rigidity E supported at its mid-point, while being exposed to a flowing soap film (thickness h) with uniform speed
U. The underlying reduced equation for the beam curvature depended solely on
one parameter, the non-dimensional speed 7 = (pfhL3U2/2E)1/2, which can also be
regarded as the ratio between the kinetic energy of the fluid and the elastic potential energy of the fiber. They found that for q < 1, the fiber remained nearly undeformed;
Cd was constant and the dimensionless drag force, Fd, scaled quadratically with ij,
Fd oC q2. For j
>>
1, the fibers took on a self-similar shape, and Fd OC p4/3 [114]. This means that no reconfiguration is displayed by the flexible beam when 7 < 1, and thus V = 0, whereas the q>
1 case leads to a Vogel exponent of V = -2/3, as shown by this coupled elastohydrodynamic system.A third, and arguably more standard, approach to generate a reduced model to
describe the aeroelastic coupling is to explicitly include the reconfiguration effect on the normal loading pressure by dividing it into two terms. The first term is the local drag force acting in the same way as the drag acting on a perpendicular plate. The second term arises from the local acceleration of the flow on the deformed flexible body. This idea was first presented by Lighthill [113]. The details of this model will be explained in Chapter 5. The combined action of these loading terms were applied recently for the deformation of flexible elastic sheets exposed to a uniform air flow by Buchak et al. [110]. In their study, sheets were laid flat and clamped on the downwind end of a wind tunnel. The air flow then caused the sheets to lift, bend and accumulate, such that the bunch of sheets eventually arrives to a steady state supported by the fluid loading. The model was used to successfully compute the shape of the sheets, using the drag coefficient as the only fitting parameter for a large range of wind speeds.
So far, we have only presented work on static, or quasi-static flexible structures. However, a common area of study in FSI problems relates to the fluttering of flex-ible structures exposed to uniform flow [91,101,102,103,111,112, 116,117]. One of the canonical examples of this type of problem is the flapping of a flag exposed to wind [101,102,103,117]. Fig. 1-8(d) shows a schematic diagram of the flapping flag geometry [102]. At low wind speeds the flag remains in what is known as the stretched state, where it is straight and aligned with the flow [117]. As the wind speed increases there is a critical velocity at which the flag spontaneously starts to flap with a steady frequency [103,118]. At higher wind speeds the flag begins to start flapping irregu-larly [117]. The flapping occurs because of the destabilizing pressure forces from the wind and the stabilizing bending stiffness of the flag [101,112,116].
There has been a large body of work studying the spontaneous transition from the stretched state to the steady flapping state [91, 101, 102, 117, 118]. Above the critical velocity, the amplitude of the stable flapping increases with velocity [102].
A hysteresis has been observed, allowing steady flapping to persist even below the
critical velocity if flapping has been initiated [102]. Additionally the mass and length of the plates can affect the critical wind speed [101,102].
In Chapter 5 we present a combined numerical and experimental study on flexible strips deformed by the wind. We perform wind tunnel experiments on flexible porous strips where we measure the wind speed and quantify the deformation in the strips. We will use the reduced loading model used by Buchak et al. [110] to determine the drag coefficient based on the results of the experiments. Additionally we will explore the effect of the Cauchy number on the drag coefficient.
1.6
Effect of Porosity in Rigid Structures
We commented above on how the flexibility of a structure can have a strong effect on the aerodynamic drag that it experiences (because of reconfiguration). The porosity,
0, defined for a slender perforated plate as the fraction of material replaced by voids,
can also have a strong effect on the aerodynamic drag. In the limit of large Re, the effect of porosity has often been studied in relation to screens, which cause a reduction in pressure when used to obstruct flow [119]. Many investigations [119,120,121,122,
123, 124, 125, 126, 127] have been done with both experimental measurements and
theoretical modeling to examine the dependence of the drag coefficient on the pressure loss coefficient, K, rather than directly on 0. The pressure loss coefficient, when the
incident flow is normal to the screen, has been typically defined as K = Ap/(jpaU 2),
where Ap is the pressure difference across the screen. The value of K is known to be
a function of
#,
Re and the Mach number M [119]. However, at large Re and low M,the pressure loss coefficient becomes only a function of
#,
with past studies [125,127]proposing the relation K - (1-
#)/#
2, where the proportionality constant is of orderTaylor [126] was one of the pioneers in describing the effect of porosity on the drag of a perforated screen. His modeling strategy was to replace the screen by a uniformly spaced array of sources. The flow field produced by combining the free stream flow with the one generated by the resistance sources yielded a prediction for the drag coefficient of the screen as a function of the pressure loss coefficient [127].
This method proved to be reasonably accurate for small values of K (large values of 0) where Cd decays to 0 with K, but failed at high values of K (low values of 0) where it predicted that Cd would decrease with increasing K. At high values of K, Cd should attain a constant value (the drag coefficient of the continuous sheet). In work by Koo and James [123], a refinement of this prediction adapted the previous model to determine Cd as a function of K, which produced a saturation of Cd up to a constant value with increasing K [123]. These predictions have been tested experimentally in several studies. Blockley [120] measured the pressure loss and drag coefficients of perforated plates as a function of porosity and found reasonably good agreement with the theoretical results, especially for large porosity. Later, Castro [121] reported experimental results on perforated plates and measurements on the corresponding drag coefficients, using both the wake traverse method and a drag balance method. A similarly good agreement was found with the predictions of Koo and James [123] and experimental results of Blockley [120] for high porosity, but found a worse agreement for low porosity.
All the studies presented in this section, have focused on the effect of porosity
for rigid structures in a flow. However, very little work has been done on flexible porous structures. In Chapter 5, we will study how introducing porosity effects the drag coefficient of flexible strips. We will compare the results of our study on flexible perforated strips to those of the rigid porous plates presented in this section.
1.7
Outline of Thesis
This chapter introduced the fundamental principles leading to drag forces, particu-larly on bluff bodies, along with a literature review of the current state of research.


![Figure 1-7: Cactus inspired aerodynamic research. (a) Representative photograph of a Saguaro cactus (Scottsdale, Arizona) [87]](https://thumb-eu.123doks.com/thumbv2/123doknet/13893336.447629/26.917.161.753.297.816/inspired-aerodynamic-research-representative-photograph-saguaro-scottsdale-arizona.webp)
![Figure 1-8: Flexible structures in flow. (a) Reconfiguration of a tulip tree leaf at different wind speeds adapted from Vogel [108]](https://thumb-eu.123doks.com/thumbv2/123doknet/13893336.447629/30.917.160.766.314.799/figure-flexible-structures-reconfiguration-different-speeds-adapted-vogel.webp)
![Figure 2-1: Representative photograph of a Saguaro cactus (Scottsdale, Arizona) [87].](https://thumb-eu.123doks.com/thumbv2/123doknet/13893336.447629/39.917.301.608.134.548/figure-representative-photograph-of-saguaro-cactus-scottsdale-arizona.webp)