Studying the Variability of System
Setting Effectiveness by Data Analytics
and Visualization
S´ebastien D´ejean1, Josiane Mothe2, and Md. Zia Ullah3(B)
1
IMT, UMR5219 CNRS, UPS, Univ. de Toulouse, 118 Route de Narbonne, Toulouse, France [email protected]
2
IRIT, UMR 5505 CNRS, ESPE, Univ. de Toulouse, 118 Route de Narbonne, Toulouse, France
3
IRIT, UMR 5505 CNRS, UPS, Univ. de Toulouse, 118 Route de Narbonne, Toulouse, France
Abstract. Search engines differ from their modules and parameters; defining the optimal system setting is challenging the more because of the complexity of a retrieval stream. The main goal of this study is to determine which are the most important system components and param-eters in system setting, thus which ones should be tuned as the first priority. We carry out an extensive analysis of 20, 000 different system settings applied to three TREC ad-hoc collections. Our analysis includes zooming in and out the data using various data analysis methods such as ANOVA, CART, and data visualization. We found that the query expan-sion model is the most significant component that changes the system effectiveness, consistently across collections. Zooming in the queries, we show that the most significant component changes to the retrieval model when considering easy queries only. The results of our study are directly re-usable for the system designers and for system tuning.
Keywords: Information retrieval
·
Data analytics·
Retrieval system modules·
Effectiveness1
Introduction
Search engines aim at retrieving the documents that will fit the user’s expec-tations which he/she expresses through a query. Search engines vary according to various components and thus the way they handle the document indexing, the query/document matching model, the automatic query expansion, the docu-ment ranking, etc. For example, regarding the matching model, among the most popular models we can quote VSM [20], Probabilistic model [18], LSI [9], or
Language model [17]; each model has in turn internal parameters that can be
_
varied. When handling a new collection, finding the most appropriate compo-nent/parameter to tune as the first priority is not obvious. This is a challenging problem since many factors influence the system effectiveness, such as the sys-tem components, their parameters, the document collection, the queries, and the considered effectiveness measures while a few studies help in understand-ing this influence. In IR, most of these modules and parameters are tuned on a per-collection basis to optimize the system effectiveness [13]. This is the case in the evaluation campaign series1 although IR research looks also for modules
and parameters (methods) which work best on real-world search tasks.
While it is well-acknowledged that the system should be tuned according to the collection, there are a few studies that tackle the problem of the way to proceed. Grid search is such a method that determines the best value for each parameter to maximize the system effectiveness of a query set where a set of values is defined for each parameter [23]; this method is very resource demanding when there are many possible system settings2. It results in providing the optimized values of the system parameters, but neither offer explanations of these results nor cues on their transferability from one collection to another. Another recent approach is Random search [2] which can randomly explore the space of the possible system settings; it thus can be quicker than grid search but does not guarantee the optimal setting and does not solve the other drawbacks of grid search.
In this paper, we analyze which modules and parameters that influence sys-tem effectiveness the most. This analysis is worth to be conducted at various levels in order to get different types of information; this is done by zooming in and out the data set. The results of this study could be then used to know which component/parameter should be tuned as the first priority for achieving the best system effectiveness on a new collection. The results could also be used to better drive grid search or similar methods when optimizing systems to avoid exploring settings that are unlikely to be effective. This analysis is worth to be based on various data analysis methods; each one is appropriate to reveal different aspects of the problem. We use Analysis of variance (ANOVA) to reveal the components that significantly influence the effectiveness, CART (classification and regression tree) [5] to model the impact of the different component modalities, and data visualization. Finally, this analysis has to be made on a large scale so that the results could be reliable.
We used more than 20, 000 different system settings, applied to three TREC ad-hoc collections and the associated queries that we will detail later on in this paper. Not surprisingly, we show that the most significant influencing factor is the query set.
Considering the system components, the most significant component is the query expansion model when zooming out (all collections together) and when considering each collection individually, although the optimal modality can differ
1
https://trec.nist.gov/data.html.
2
A system setting refers to an IR system configured with a retrieval model and an optional query expansion model with its parameters.
from one collection to another. More unexpected, when zooming in the queries and considering classes of query difficulties, we found out that the most signif-icant module is the retrieval model for easy queries and the query expansion model for hard queries. Therefore, system components should be designed with the options of choosing from retrieval and query expansion models at run time based on the query difficulty level and be tuned accordingly.
The rest of the paper is organized as follows: related work is discussed in Sect.2. Section3 presents the specific objectives, we pursued, the methods and data that we used to achieve our goals. Experimental results are described and discussed in Sect.4. Finally, Sect.5 concludes this paper and mentions future work.
2
Related Work
Several studies used descriptive analysis to understand better the results obtained with various IR systems. In their earlier work, Banks et al. [1] consid-ered two parameters (topic and system) and analyzed the results using variance analysis, cluster analysis, correlation, and a few other methods. The authors stated that the results were inconclusive and that none of these methods had yielded any substantial new insights.
Chrisment et al. [7] and Din¸cer [10] revisited this topic and compared the per-formances of various search strategies by means of principal component analysis (PCA); both analyzed the participants’ runs and showed that PCA can reveal the peculiarities of some runs and of some topics. Bigot et al. [3] conducted a similar analysis on TREC 7 ad-hoc collection considering Benzecri’s χ2 corre-spondence analysis rather than the PCA and suggested a system fusion method which improves about 20% compared to the best system at TREC. Mizzaro and Robertson [16] used network analysis to distinguish good systems from bad sys-tems by defining a minimal subset of queries and concluded that “easy” queries perform the best in this task.
In these studies, the authors use the participants’ run and systems which are considered to be black boxes. Other studies went deeper in the system parame-ter analysis. Compaor´e et al. [8] analyzed two indexing parameters (Block size and IDF) and retrieval modules to determine which parameters significantly affect the system performance on TREC7-8 collection. They concluded that the retrieval model is more important than the indexing module. Bigot et al. [4] enlarged the analysis with regard to the number of parameters considering four different stemming algorithms, twenty-one retrieval models, seven combinations of topic fields as queries, six query expansion models, and other query expansion parameters.
In the same vein, Ferro et al. introduced the grid of points (GOP) to analyze the main and interaction effects of topics, indexing, and retrieval modules on system performance [12]. Using ANOVA, they found that having a stopword list in the indexing module has the biggest positive impact, then the stemmer, and retrieval model; the stopword list has also a significant interaction effect with
the retrieval model. However, they did not consider the query expansion compo-nent in their study and their analysis of the indexing module was conducted on four small TREC collections (TREC 05, 06, 07, and 08). Moreover, varying the indexing module would be very costly to conduct for larger collections because it requires to construct many indexes. Therefore, it is unlikely that real-world systems implement several indexes of their collections. On the contrary, varying retrieval and query expansion modules would be easily done at run time only.
Our study is much ampler than related work; first, in terms of system compo-nents/parameters analyzed since the data set is composed of a total of more than 20,000 system settings including the query expansion module and in terms of collections that include larger collections than previous studies; second, in terms of the variability of the methods used to analyze the results; and third because we consider various levels of analysis (zooming in and out in the collections and query sets). We focus on the significant influential modules and parameters on system effectiveness and analyze whether they differ across the collections, across query difficulty level, and considering different evaluation measures.
3
Objectives, Methods, and Data
3.1 Data Analysis Objectives and Methods
The main objective of this study is to identify which is the most significant com-ponent/parameter of the system that influences the system effectiveness. This analysis is worth to be conducted at various levels in order to extract different types of information: (1) at the collection level, identifying which component significantly influence the system effectiveness the most can help the develop-ers when tuning the system on a per-collection basis. The results could be used to anticipate transferability. Let us say that the most significant component is the same across collections, this is the ones that should be tuned first for any new collection; (2) zooming out and considering the queries of all the collections together would explore the more general trends, more independent to the con-sidered queries. Results are likely to be less collection-biased; (3) Since the query set has a strong significant impact on the system effectiveness, zooming in the query sets is worth exploring. To do so, we consider the level of query difficulty since this is an active research direction [6,19,22]. Zooming in and considering individual query or groups of queries could help in understanding what are the main system failures and how to avoid them.
Various data analysis methods could reveal different aspects of the problem. Among the large set of possible methods, we select the Analysis of VAriance (ANOVA). ANOVA is a statistical method which is used to check if the means of two or more groups are significantly different from each other. It was widely used in the 1990s to explore the TREC IR runs results [21,25] and has recently been revived [12,24]. For a thorough understanding of the ANOVA, we would refer the readers to Miller’s book [15] or Ferro et al. [12]. ANOVA can be designed as One-way (i.e. if there is a significant effect of an independent variable on a continuous dependent variable) or N-way with/without interaction (i.e. if there
exist a significant interaction effect between N independent variables on a con-tinuous dependent variable). In its application to IR, it has the interesting power of being able to show both the main effect of the components and also the inter-action effects; however, it can not be used to decide which levels (modalities) of the factor (component) are the most significant. We also use CART (clas-sification and regression tree) [5], which is appropriate to consider cross-effect of components but also to extract readable models from the data that could explain the results. Finally, this analysis has to be made on a large scale so that the results could be reliable; the collections and settings are presented in the next sub-sections.
3.2 Data Collections
We use three standard TREC collections, namely TREC7-8, WT10G, and GOV2. TREC7-8 consists of 528k documents and a total of 100 topics, WT10G consists of 1,692k documents and 100 topics, and GOV2 consists of 25 million documents and 150 topics. Indeed, when a document collection has been used for different sets of queries, we merged the queries in the experiments. We con-sider the title part of the topics as queries. The collections come with qrels, that is to say, judged documents (relevant or non-relevant) for each topic. Qrels are used by the evaluation program trec eval3 to calculate system effectiveness. We
use the well-known AP (Average Precision) and P@10 (Precision at 10) as the evaluation measures. We use Terrier IR [14] to index the collections and retrieve the results for the queries from the three collections.
3.3 System Components, Parameters, and Settings
Previous studies have focused on the indexing components including the stop-lists, the stemming algorithms used, and the retrieval component [8,11]. Hav-ing in mind the system settHav-ing optimization, adaptHav-ing the indexHav-ing component is very resource demanding since several indexes need to be built and stored. Although it is feasible for small collections, it is more demanding for large col-lections and unrealistic for real-world systems.
In this study, we thus choose to consider the core IR system components that can be combined at run time: the retrieval module and the query expansion module (See Table1).
Each retrieval module has its proper inner parameters that could be tuned in turn; however, these parameters vary from one model to another (e.g. it is k1 and b parameters in the BM25 retrieval model, but it is µ in Language model). We keep the study of the variability of internal parameters of the retrieval model for future work. We thus rather consider in this study a single version of each of the 20 retrieval models and choose its default setting (e.g., BM25 (k1 = 1.2, b = .75), DirichletLM (µ = 2500), and PL2 (c = 1)) in Terrier [14]4. We also
3
http://trec.nist.gov/trec eval/.
4
http://terrier.org/docs/current/javadoc/org/terrier/matching/models/package-summary.html.
Table 1. System components and variants. Component Modalities
Retrieval model (RMod) BB2, BM25, DFRBM25, DFRee, DLH, DLH13, DPH, DirichletLM, HiemstraLM, IFB2, InB2, InL2, InexpB2, InexpC2, JsKLs, LGD, LemurTFIDF, PL2, TFIDF, XSqrAM
Query expansion (QE) 0 (no expansion), Bo1, Bo2, Information, KL, KLCorrect, KLComplete
consider the 6 query expansion models implemented in Terrier which is optional when combined with the retrieval model (making 7 modalities for this variable). To have the first look on the influence of the variables, we consider the three-way ANOVA test that estimates the main effects of the query, query expansion (QE), and retrieval model (RMod) factors on AP measure and report the pre-liminary evaluation result in Table2.
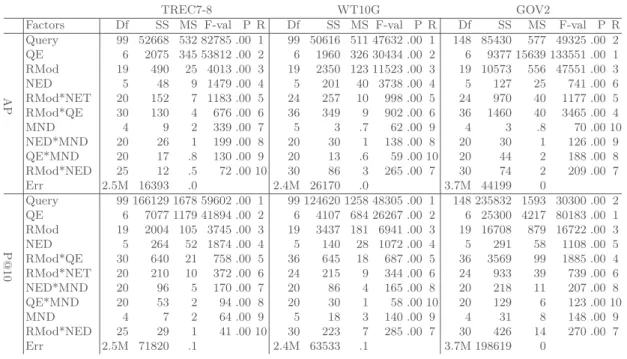
Table 2. Three-way ANOVA considering the main effects of Query, QE, and RMod factors on AP for TREC7-8, WT10G, and GOV2 collections, independently. Columns refers to Df (Degree of freedom), SS (Sum of square), MS (Mean of square), F-val (F-value), P (P-(F-value), and R (Rank in terms of F-value (higher is better)) of each factor; P of .00 refers to P-value < 2e-9.
Columns of the Table2 refers to the degree of freedom (DF), sum of square (SS), mean square (MS), F-value (F-val), P-value (P), and Rank (R, the order of importance in terms of F-value) of each factor. The higher the F-value (the ratio of between-group variability to within-group variability), the higher the effect of the factor on the response variable (say, AP).
From the SS, MS, and F-value of each factor in Table2, we can observe that the most significant factor is generally the query apart from the GOV2 where the query is the second most significant component. Having a closer looks at the variance of the system effectiveness (AP) for GOV2 queries (not reported because of page limit), we observed that it was much higher on GOV2 than on other collections.
The most significant factor when not considering the query factor is consis-tently the query expansion (QE) component5. While some related work did not
consider the query expansion component [12], we show here that it is of huge importance. We thus gave a closer look at the QE component.
Moreover, since any QE models have the same three high-level parameters: the number of documents used, the number of added terms, and the minimal number of documents where the considered terms should occur, we also consider these three parameters (see their description on Table3).
Table 3. Parameters of the query expansion (QE) component.
Parameters Modalities
Number of expansion documents (NED) 2, 5, 10, 20, 50, 100 Number of expansion terms (NET) 2, 5, 10, 15, 20 Minimum number of documents (MND) 2, 5, 10, 20, 50
We finally built numerous system settings; each system setting is being com-posed of a retrieval model among the 20 (Terrier default inner parameters for each of them) and optionally one of the 6 query expansion models; the latter is configured with one modality (level) for each of the three parameters (fac-tors). We build as many systems as there are possible meaningful6 combinations of module/parameter values (i.e. modalities); a system results from setting one of the modules/parameters to one of the modalities from Tables1 and 3; that makes more than 20, 000 systems treating each query.
4
Experimental Results and Discussion
Our experiments are three-fold. First, we consider each collection individually to identify which component significantly influence system effectiveness. The result can be useful for the developers when tuning their system on a per-collection basis and can be used to anticipate transferability issue across collections. Sec-ond, we zoom out the collections by considering the queries of all collections together to perceive the general effect of components on system effectiveness. Third, we zoom in by considering the groups of queries.
5
We also calculated the Two-way ANOVA considering the main and interaction effects of query expansion (QE) and retrieval model (RMod) factors on AP; query expansion is consistently ranked first as well across the collections.
6
Some combinations are not meaningful and thus were not used (e.g., using 5 docu-ments in query expansion while the “expansion model” used is none).
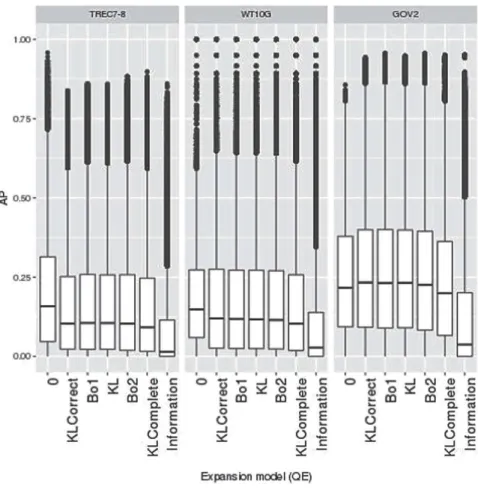
Fig. 1. Distribution of AP values considering the 7 query expansion (QE) modules on TREC7-8, WT10G, and GOV2 collections. Within a collection, boxplots are ordered by decreasing median on TREC7-8 collection
4.1 Significant Component Per-Collection
Our preliminary analysis (Table2) shows that the most significant factor (when apart from queries) is the query expansion (QE). We visualize the distribution of AP measure for the 7 query expansion (QE) modules in Fig.1 (“0” means no expansion). Each boxplot corresponds to an individual query expansion model and shows the distribution of AP values obtained for the various systems (all parameters vary except the query expansion for a boxplot) for each query indi-vidually. We ordered the box-plots in decreasing order based on the median of AP values on TREC7-8 collection. We can see that “Information” QE module performs the worst across collections (right sidebar of each sub-figure). On the contrary, no expansion (“0”) is likely to perform better than any query expansion module in average at least on TREC7-8 and WT10G collections since it obtained the best median and Q3 (first left sidebar of each sub-figure). The chance of no expansion performing better than query expansion is higher, although there are some appropriate combinations for various expansion models that perform about the same. We can see that several models have similar shapes (2nd to 6th bars). This comment holds specifically well for WT10G collection where the maximum AP is the same and bar plots are very similar from one QE model to the other.
Moreover, we keep the analysis of more selective system settings (e.g., good systems) as future work.
Table 4. Six-way ANOVA considering the main and interaction effects (second order) of the Query, QE, RMod, NED, NET, and MND on the AP and P@10 measures for TREC7-8, WT10G, and GOV2 collections, independently. The results are ordered according to the significance of the module based on F-value. Other legends and settings are similar to Table2.
To analyze the system effectiveness into the main and interaction effects of system components, we estimated the Six-way ANOVA with second-order interaction and described the summary in Table4. The higher the F-value and the lower the P-value (<0.001), the more significant the factor is. Whatever the collection, the query expansion (QE) component is the most significant factor when query effect is moved aside. Regardless of measures and collections, the next most significant modules are the retrieval module (RMod).
We can observe that the retrieval model (RMod) has a significant interaction effect with the expansion model (RMod*QE) and the number of expansion terms (RMod*NET) across collections and measures. Query expansion (QE) has a sig-nificant interaction effect with the minimum number of documents (QE*MND). Moreover, we observed the most significant interaction effects of the query with the expansion model (Query*QE) first and retrieval model (Query*RMod) sec-ond [not report]; we have also not reported some least influential factors [because of page limit].
4.2 Zoom-Out on Three Collections Altogether
To perceive a general tread from all the collections, we accumulated the queries and system settings from the three collections altogether, zoomed out on the
parameter space, and estimated the Six-way ANOVA to break down both the AP and P@10 measures into the query, QE, RMod, NED, NET, and MND modules. The results are described in Table5.
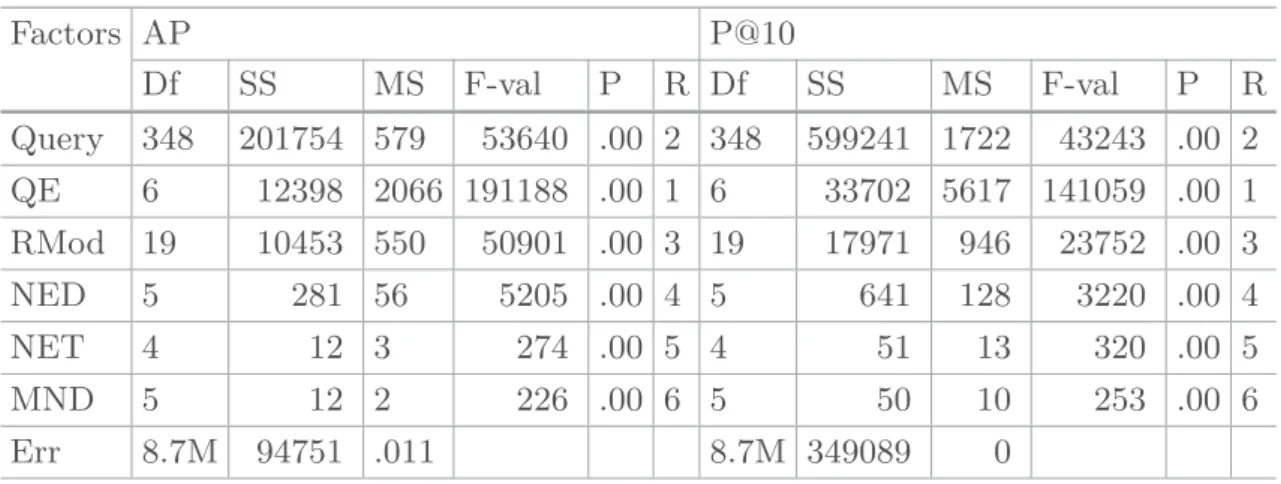
Table 5. Six-way ANOVA for the main effect of Query, QE, RMod, NED, NET, and MND when accumulating the three collections altogether for AP and P@10 measures, respectively. Other legends and settings are similar to Table2.
Factors AP P@10 Df SS MS F-val P R Df SS MS F-val P R Query 348 201754 579 53640 .00 2 348 599241 1722 43243 .00 2 QE 6 12398 2066 191188 .00 1 6 33702 5617 141059 .00 1 RMod 19 10453 550 50901 .00 3 19 17971 946 23752 .00 3 NED 5 281 56 5205 .00 4 5 641 128 3220 .00 4 NET 4 12 3 274 .00 5 4 51 13 320 .00 5 MND 5 12 2 226 .00 6 5 50 10 253 .00 6 Err 8.7M 94751 .011 8.7M 349089 0
Not surprisingly, we can see that the most significant component covering high variability is query expansion (QE) module. The next most significant mod-ules are the query, retrieval model (RMod), and the number of expansion doc-uments (NED) (in decreasing order). Therefore, we can deduce that the query expansion module should be given the first priority to tune for a new large collection.
4.3 Zoom-In the Collections - Groups of Queries
At first, we defined the groups of queries. Given three collections altogether, we calculated the average of AP (AAP) across systems for each query [16], then labeled the queries based on the quantile distribution of AAP. Queries having AAP higher than Q3 (75%) are considered as easy, lower than Q1(25%) are con-sidered as hard, and the remaining queries are concon-sidered as the medium. After defining the difficulty level of a query, we investigated the effectiveness each sys-tem achieved for that query and decided if the query is the easy, medium, or hard for that system. To explore the most important modules and their modal-ities, we employed the CART with a pruning parameter (i.e. cp) of 0.001 for the systems of all, easy, and hard queries, respectively. We visualized the CART for all queries in Fig.2. The labels in the tree correspond to the modalities of the modules in Tables1 and 3. We can clearly see that query expansion (QE) is the most important module in this case. This is consistent with the ANONA analysis in Sects.4.1 and 4.2.
Figure3 displays the resulting CARTs, in one hand for easy queries from the three collections altogether (left part) and on the other hand for hard queries
Fig. 2. CART for zooming out on the parameters space of systems of all queries.
Fig. 3. CART visualization on zooming in the parameters space of systems for Easy (a) and Hard (b) queries.
(right part). We can clearly see that the trees are very different when considering either easy or hard queries of the collections altogether. We also observed this difference across collections [not plotted].
We can also observe that the most significant module (the top parameter for each tree) differs from easy queries to hard queries. For easy queries, the retrieval model (RMod) is the most significant module while the query expansion (QE) is for hard queries. Thus, system components should be designed with the options of choosing from retrieval and query expansion models at run-time and be tuned according to the query difficulty level.
5
Conclusion
In this paper, we have studied the problem of identifying which is the most significant component/parameter that influences the system effectiveness. We have conducted a large-scale analysis of more than 20, 000 system settings that
treated 350 queries from three different TREC ad-hoc collections. Using data analysis methods, we found that query expansion is the most significant sys-tem component when considering the three collections altogether. Zooming in the query set, we found that the most significant module differs according to the query difficulty class. For easy queries, the retrieval model is the most sig-nificant component to tune for optimal performance; this extends the analysis of Mizzaro and Robertson [16] where it was shown that easy query performs well to differentiate the good systems from bad systems. The query expansion is the most significant component for hard queries. These results imply that the transfer of parameter settings can be applied based on the query difficulty class and researchers can use our findings when designing and tuning their systems. These findings could be useful to develop adaptive systems based on the query difficulty classes.
As future work, we would like to study in deeper the interaction of the param-eter settings with the characteristics of document collections, types of informa-tion needs, and suitability of retrieval methods across different search tasks. We also would like to investigate other effectiveness measures as well as a larger number of collections or collection shards in order to extract general trends. For example, we would like to observe if a certain type of collections (e.g., web col-lections) is homogeneous in terms of their parameter settings or if the parameter setting is completely collection dependent. Another track would be to define the minimum number of queries we would need to decide which will be the most important parameter for a given collection. Finally, we would like to apply other models than the decision tree.
References
1. Banks, D., Over, P., Zhang, N.F.: Blind men and elephants: six approaches to trec data. Inf. Retrieval 1(1–2), 7–34 (1999)
2. Bergstra, J., Bengio, Y.: Random search for hyper-parameter optimization. J. Mach. Learn. Res. 13(Feb), 281–305 (2012)
3. Bigot, A., Chrisment, C., Dkaki, T., Hubert, G., Mothe, J.: Fusing different infor-mation retrieval systems according to query-topics: a study based on correlation in information retrieval systems and trec topics. Inf. Retrieval 14(6), 617 (2011) 4. Bigot, A., D´ejean, S., Mothe, J.: Learning to choose the best system configuration
in information retrieval: the case of repeated queries. J. Univ. Comput. Sci. 21(13), 1726–1745 (2015)
5. Breiman, L.: Classification and Regression Trees. Routledge, Abingdon (2017) 6. Chifu, A.G., Laporte, L., Mothe, J., Ullah, M.Z.: Query performance prediction
focused on summarized letor features. In: The 41st International ACM SIGIR Conference, pp. 1177–1180. ACM (2018)
7. Chrisment, C., Dkaki, T., Mothe, J., Poulain, S., Tanguy, L.: Recherche d infor-mation - analyse des r´esultats de diff´erents syst`emes r´ealisant la mˆeme tˆache. Rev. Sci. Technol. l’Inf. 10(1), 31–55 (2005)
8. Compaor´e, J., D´ejean, S., Gueye, A.M., Mothe, J., Randriamparany, J.: Mining information retrieval results: significant IR parameters. In: Advances in Informa-tion Mining and Management, October 2011
9. Deerwester, S., Dumais, S.T., Furnas, G.W., Landauer, T.K., Harshman, R.: Index-ing by latent semantic analysis. J. Am. Soc. Inf. Sci. 41(6), 391 (1990)
10. Din¸cer, B.T.: Statistical principal components analysis for retrieval experiments. J. Assoc. Inf. Sci. Technol. 58(4), 560–574 (2007)
11. Ferro, N.: What does affect the correlation among evaluation measures? ACM Trans. Inf. Syst. 36(2), 19:1–19:40 (2017). https://doi.org/10.1145/3106371
12. Ferro, N., Silvello, G.: A general linear mixed models approach to study system component effects. In: Proceedings of the 39th International ACM SIGIR Confer-ence, pp. 25–34. ACM (2016)
13. Harman, D., Buckley, C.: Overview of the reliable information access workshop. Inf. Retrieval 12(6), 615 (2009)
14. Macdonald, C., McCreadie, R., Santos, R., Ounis, I.: From puppy to maturity: experiences in developing terrier. In: Proceedings of OSIR at SIGIR, pp. 60–63 (2012)
15. Miller Jr., R.G.: Beyond ANOVA: Basics of Applied Statistics. Chapman and Hal-l/CRC, London (1997)
16. Mizzaro, S., Robertson, S.: Hits hits trec: exploring IR evaluation results with network analysis. In: Proceedings of the 30th ACM SIGIR, pp. 479–486. ACM (2007)
17. Ponte, J.M., Croft, W.B.: A language modeling approach to information retrieval. In: Proceedings of the 21st ACM SIGIR Conference, pp. 275–281. ACM (1998) 18. Robertson, S., Zaragoza, H., et al.: The probabilistic relevance framework: BM25
and beyond. Found. Trends Inf. Retrieval 3(4), 333–389 (2009)
19. Roy, D., Ganguly, D., Mitra, M., Jones, G.J.: Estimating gaussian mixture mod-els in the local neighbourhood of embedded word vectors for query performance prediction. Inf. Process. Manag. 56(3), 1026–1045 (2019)
20. Salton, G.: The SMART Retrieval System-Experiments in Automatic Document Processing. Prentice-Hall Inc., Upper Saddle River (1971)
21. Schutze, H., Hull, D.A., Pedersen, J.O.: A comparison of classifiers and document representations for the routing problem (1995)
22. Shtok, A., Kurland, O., Carmel, D.: Query performance prediction using reference lists. ACM Trans. Inf. Syst. 34(4), 19:1–19:34 (2016)
23. Taylor, M., Zaragoza, H., Craswell, N., Robertson, S., Burges, C.: Optimisation methods for ranking functions with multiple parameters. In: Proceedings of the 15th ACM International Conference on Information and Knowledge Management, pp. 585–593. CIKM (2006)
24. Voorhees, E.M., Samarov, D., Soboroff, I.: Using replicates in information retrieval evaluation. ACM Trans. Inf. Syst. (TOIS) 36(2), 12 (2017)
25. Zobel, J.: How reliable are the results of large-scale information retrieval experi-ments? In: Proceedings of the 21st Annual International ACM SIGIR Conference, pp. 307–314. ACM (1998)