Full Length Research Paper
Multivariate statistical characterization of groundwater
quality in Ain Azel plain, Algeria
Lazhar Belkhiri
1*, Abdurrahman Boudoukha
2, Lotfi Mouni
3and Toufik Baouz
41
Department of hydraulics, University of Hadj Lakhdar Batna, Batna 05000, Algeria.
2
Laboratoire de recherche en hydraulique appliquée Université de Hadj Lakhdar Batna, Batna 05000, Algeria.
3Laboratoire de technologie des matériaux et de génie des procédés de l'université de Bejaia,
Targa-Ouzemour 06000, Alegria.
4
Laboratory of Organic Materials, University of Bejaia, Targa- Ouzemour 06000, Algeria.
Accepted 25 May, 2010Multivariate statistical techniques, cluster and principal component analysis were applied to the data on
groundwater quality of Ain Azel plain (Algeria), to extract principal factors corresponding to the
different sources of variation in the hydrochemistry, with the objective of defining the main controls on
the hydrochemistry at the plain scale. Q-mode hierarchical cluster analysis grouped 54 groundwater
samples into three clusters, that is, relatively less saline water (group 1), mixed water (group 2) and
blended water (group 3), based on the similarity of groundwater quality characteristics. Principal
component analysis, applied to the data sets of the three different groups obtained from hierarchical
cluster analysis, resulted in four, five and three latent factors explaining 83.21, 83.36 and 87.30% of the
total variance in groundwater quality data sets of group 1, group 2 and group 3, respectively. The
varifactors obtained from PCA indicate that the parameters responsible for groundwater quality
variations are mainly related to presence and dissolution of some carbonate, dolomitic and evaporite
minerals; natural processes and water-rock interaction in the three water types. The results of this
study clearly demonstrate the usefulness of multivariate statistical analysis in hydro chemical.
Key words:
Cluster analysis, principal component analysis, hydrochemistry, Ain Azel plain, Algeria.
INTRODUCTION
In the current world economic paradigms, sustainable
socioeconomic development of every community
depends much on the sustainability of the available water
resources. Water of adequate quantity and quality is
required to meet growing household, industrial and
agricultural needs. Groundwater quality is a very
sensitive issue, which transcends national boundaries. It
is influenced by many factors, including atmospheric
chemistry, the underlying geology, the vegetation (or
organic matter decay) and anthropogenic agents. The
solubility of minerals in water places an upper limit on the
maximum amounts of certain species of chemicals in
*Corresponding author. E-mail: belkhiri_laz@yahoo.fr.
Abbreviations:
CA,
Cluster analysis;
FA,
factor analysis;
EC,
electrical conductivity;
PCA,
principal component
analysis.
natural waters. Some minerals like carbonates and
evaporites dissolve quickly and change the composition
of water faster, while other minerals like silicates dissolve
more slowly and have less conspicuous effects on the
composition of water. Temperature also plays a vital role
in controlling the chemical and biological composition of a
freshwater body. Previous studies (Frape et al., 1984;
Garrels and McKenzie, 1967; Hem, 1989; Hartman et al.,
2005) have revealed that the chemistry of natural waters
can often be traced to the reaction of these waters with
sediments or rocks through which they flow. Based on
catchments studies in the USA, Walling (1980) observed
differences in the weathering mechanisms of different
rocks. Walling (1980) concluded that total dissolved
solids in the water from limestones, volcanics and sand
and gravel is almost independent of the amount of runoff.
These differences in behaviour accrue from the
differences in the solubilities of the minerals present in
these rocks (Yidana et al., 2008).
and factor analysis (FA), are effective means of
manipulating, interpreting and representing data
concerning groundwater pollutants and geochemistry.
They are frequently employed to characterize the quality
of groundwater. Liu et al. (2003) adopted FA to evaluate
groundwater quality in a black foot disease area, Taiwan.
Two factors, seawater salinization and arsenic pollutant,
were considered and their factor scores were mapped.
Love et al. (2004) applied FA to distinguish several
groundwater signatures, including uncontaminated
groundwater, agricultural activities, mining activities and
sewage pollution. Olmez et al. (1994); Mahknecht et al.
(2003); Farnham et al. (2003) used FA to discuss
geochemical
evolution
and
mineralization
and
groundwater contamination. Additionally, the CA was also
used to interpret the hydrochemical data based on factor
scores, for example, Suk and Lee (1999); Reghunath et
al. (2002); Kim et al. (2005). This study comprises
application of multivariate statistical techniques to
groundwater quality data set obtained from groundwater
of Ain Azel plain in Algeria.
DESCRIPTION OF THE STUDIED AREA
The studied area is located in the east of Algeria. Most of
inhabitants (more than 30000 inhabitants) are centered
on the town of Ain Azel. The principal activity in this area
is the production of cereals (barley and corn) and its
climate is semi-arid. The amount of rainfall varies from
place to place and from season to season, ranging from
346 mm/yr in the plains (altitude < 1000 m) to 534 mm/yr
in the mountains (altitude > 1000 m). The annual maximum
and minimum temperatures are 21.8 and 8.5
˚C,
respectively (Belkhiri, 2005).
According to many authors (Savornin, 1920; Galcon,
1967; Guiraud, 1973; Vila, 1980) the area of concern is
distinguished by two geological sets. In the South,
autochthonous Jurassic and Cretaceous carbonate
lithologies are mainly observed in Djebels Boutaleb,
Djebel Hadjar Labiod and Fourhal (Figure 1). In the
North, allochthonous Jurassic and Cretaceous lithologies
are observed in Djebels Kalaoun and Sekrine. A
lithostratigraphic study of Ain Azel area identifies the
following two aquifer formations. The first is a carbonate
and sandy formation of about 700 m thick presenting
fracture porosity and constitutes the Barremian formation.
The second is an alluvial formation of about 250 m thick
corresponding to a Mio-Plio-Quaternary formation with
interstitial porosity (Boutaleb, 2001; Belkhiri, 2005). A
mineralogical study shows that the metalliferous minerals,
particularly the sphalerite, the gangue minerals and the
dolomite contain variable quantities of trace metals such
as Zn, Pb, Cd, Fe and Cu (Boutaleb, 2001).
The studied area is situated in the alluvial plain of the
Mio-Plio-Quaternary (Figure 1) showing a heterogeneous
continental detrital sedimentation (Boutaleb, 2001;
Belkhiri, 2005; Attouche, 2006). This aquifer is directly
fed by stream water coming from different relief’s
surrounding the depression inter-mountainous of Ain
Azel. The plain hosts a large number of water-wells with
depths varying from 8 - 38 m. Most of these wells supply
water for drinking and irrigation. The direction of
groundwater flow around Ain Azel plain is from south to
north and from west to east. In general, the groundwater
flows toward center of the plain (Figure 2) and development
this map shows a piezometric depression, which
coincides with high density of the well in the center of the
plain. The limits of south and west are of imposed entering
flux; however the limit of east is of null flux. The pumping
tests on different wells showed high transmissivity (30 - 36
m
2/day) indicating high yields (Belkhiri, 2005).
MATERIALS AND METHODS Sample collection and analysis
18 wells currently in use were selected based on the preliminary field survey carried out to understand the overall distribution of the various types of wells in the studied area (Figure 1). The selected wells are used for domestic, agricultural, and domestic/agricultural purposes and are uniformly distributed over the area of concern. Groundwater samplings were performed three times in 2004: June, September and December and a total of 54 groundwater samples were collected during this period. The samples were collected after pumping for 10 min. This was done to remove groundwater stored in the well. These samples were collected using 4 - 1 acid-washed polypropylene containers. Each sample was immediately filtered on site through 0.45 µm filters on acetate cellulose. Filtrate for metals analyses were transferred into 100-cm3 polyethylene bottles and
immediately acidified to pH < 2 by the addition of MerckTM ultrapure
nitric acid (5 ml 6 N HNO3). Samples for anions analyses were collected into 250-cm3 polyethylene bottles without preservation. All
the samples were stored in an ice chest at a temperature of < 4˚C
and later, transferred to the laboratory and stored in a refrigerator at a temperature of < 4˚C until analyzed (within 1 week). Immediately
after sampling, pH and electrical conductivity (EC) were measured in the field using a multi-parameter WTW (P3 MultiLine pH/LF-SET).
Subsequently, the samples were analyzed in the laboratory for their chemical constituents such as calcium, magnesium, sodium, potassium, chloride, bicarbonate, sulfate, lead and iron. This was achieved using standard methods as suggested by the American Public Health Association (APHA, 1989; 1995). Ca, Mg, HCO3 and
Cl were analyzed by volumetric titrations. Concentrations of Ca and Mg were estimated titrimetrically using 0.05 N EDTA and 0.01 N and those of HCO3 and Cl by H2SO4 and AgNO3 titration,
respectively. Concentrations of Na and K were measured using a flame photometer (Model: Systronics Flame Photometer 128) and that of sulfate by turbidimetric method (Clesceri et al., 1998). Standard solutions for the above analysis were prepared from the respective salts of analytical reagent grades. Trace metals were determined by Graphite Furnace Atomic Absorption Spectrophotometer (Perkin-Elmer AAnalyst 700) using multi element Perkin-Elmer standard solutions. The accuracy of the chemical analysis was verified by calculating ion-balance errors where the errors were generally around 10%.
Multivariate statistical analysis
744 746 748 750 752 754 756 758 760 762 764 280 282 284 286 288 290 292 1 2 3 4 5 6 7 8 9 10 11 12 13 14 15 16 17 18
DJ. FOURHAL
DJ. BOUTALEB
DJ. Kalaoun
DJ. Sekrine
DJ
. H
ad
jar
L
ab
iod
Kef el Djebas
Ain Azel
Mine of Kherzet Youssef Mine of Chaabet el Hamra 5o30' 5o30' Oued Annfif 47 o ' 35o47'Miocene (congloerate, clay and marl)
Aptian (carbonate)
Barremian (carbonate and sandstone) Neocomian (sandstone and marl) Jurassic (carbonate)
Cenomanian and Turonian (limestone)
Aptian (marl)
Lias (marl) Triassic (evaporite)
Mio-Plio-Quaternary (studied aquifer)
Wells
Algeria
Libya Egypt Tunisia Mali Niger Mauritania Chad Sudan MEDITERRANEAN SEA Morocco ATLANTIC OCEAN NORTHERN ATLANTIC OCEAN SOUTHERN INDIAN OCEAN SEA RED 0 o 30 o 30 o 0 o 20o 20oALGERIA
Morocco Mali Niger Libya TunisiaSpain MEDITERRANEAN SEA
ATLANTIC OCEAN Mauritania Annaba Setif Alger
St
ud
y
ar
ea
Figure 1. Map showing water sampling locations and geology of the studied area.
widely to investigate environmental phenomena e.g., (Anazawa et al., 2003; Anazawa and Ohmori, 2005; Güler and Thyne, 2004; Laaksoharju et al., 1999). The combined use of principal component analysis (PCA) and cluster analysis enabled the classification of water samples into distinct groups on the basis of their hydrochemical characteristics. Multivariate statistical tools have been successfully used to study and classify different sediment types (Huisman and Kiden, 1998; Tebens et al., 2001),
and hydrogeochemical processes (Cameron, 1996; Duffy and Brandes, 2001; Gupta and Subramanian, 1998). Momen et al. (1996) used cluster analysis and PCA to identify the temporal and spatial variation of water chemistry in Lake George in New York. Tariq et al. (2005) similarly applied multivariate techniques to trace metal levels in tannery effluents in Pershawar in Pakistan. Their study involved samples from tannery effluents, groundwater and soils and with the aid of multivariate tools they were able to
744 746 748 750 752 754 756 758 760 762 764 280 282 284 286 288 290 292 Flowpath Fl ow pa th DJ. FOURHAL DJ. BOUTALEB DJ. Kalaoun DJ. Sekrine DJ. H adjar Lab iod Kef el Djebas Ain Azel Mine of Kherzet Youssef Mine of Chaabet el Hamra 5 30o ' 5 30o ' Oued Annfif 35 47o ' 35 47o '
Wells Flow direction 900 Water table contour (m)
Figure 2. Potentiometer surface map in December, 2004 (unit: m).
correlate important chemical species of the three media and established significant relationships. Using factor analysis, Zeng and Rasmussen (2005) attributed the variations in quality of water from Lake Lanier in Georgia to anoxia associated with lake stratification. This paper dwells on the strength of multivariate techniques to characterize the hydrochemical variations along the Ain Azel plain. It employs the combined use of cluster and factor analysis to assess the spatial and temporal variations of groundwater chemistry.
Cluster analysis
Cluster analysis was used to determine if the samples can be grouped into statistically distinct hydrochemical groups that may be significant in the geologic context. A number of studies used this technique to successfully classify water samples (Alther, 1979; Williams, 1982; Farnham et al., 2000; Alberto et al., 2001; Meng and Maynard, 2001). Comparisons based on multiple parameters from different samples were made and the samples were grouped according to their ‘similarity’ to each other. Classifications of samples according to their parameters are known as Q-mode classifications. In the present study Q-mode HCA was used to classify the samples into distinct hydrochemical groups. The Ward’s linkage method (Ward, 1963) was used in this analysis. A classification scheme using Euclidean distance (straight line distance between two points in c-dimensional space defined by c variables) for similarity measurement, together with Ward’s method for linkage, produces the most distinctive groups where each member within the group is more similar to its fellow members than to any member outside the group (Güler et al., 2002). All 11 hydrochemical variables measured (consisting of EC, pH, Ca, Mg, Na, K, Cl, SO4, HCO3, Pb
and Fe) were utilized in this analysis. For statistical analysis, all the variables were log-transformed and more closely correspond to normally distributed data. Subsequently, they were standardized to their standard scores (z-scores) as described by Güler et al. (2002). Hydrochemical results of all samples were statistically analyzed
by using the software STATISTICA®.
Factor analysis
Factor analysis is a multivariate analytical technique, which derives a subset of uncorrelated variables called factors that explain the variance observed in the original dataset (Anazawa and Ohmori, 2005; Brown, 1998). Factor analysis is used to uncover the latent structure of a set of variables. In technical terms, common factor analysis represents the common variance of variables, excluding unique variance and is thus a correlation-focused approach seeking to reproduce the intercorrelation among the variables. On the other hand, components (from PCA) reflect both common and unique variance of the variables and may be seen as a variance-focused approach that reproduces both the total variable variance with all components as well as the correlations. PCA is far more commonly used than principal factor analysis (PFA). However, it is common to use ‘‘factors’’ interchangeably with ‘‘components’’ in multivariate analysis. Factor analysis can be performed on any kind of scientific data to establish a pattern of variation among variables or reduce large data sets into factors for easy handling and interpretation.
The total number of factors generated from a typical factor analysis indicates the total number of possible sources of variation in the data. Factors are ranked in order of merit. The first factor or component has the highest eigenvector sum and represents the most important source of variation in the data. The last factor is the least important process contributing to the chemical variation. Factor loadings on the factor loadings tables are interpreted as correlation coefficients between the variables and the factors. In this research, PCA was applied to chemical data from the Ain Azel plain to extract the principal factors corresponding to the different sources of variation in the data. Here, PCA was selected for the reasons stated above. In order to maximize the variation among the variables under each factor, the factor axes were subsequently varimax rotated.
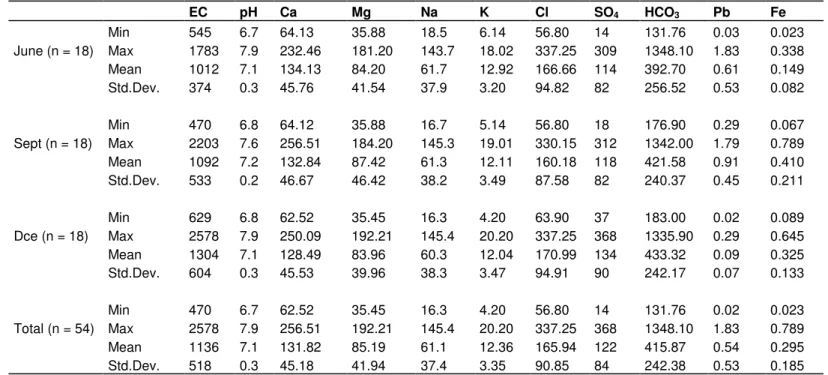
Table 1. Statistical summary of hydrochemical parameters of groundwater. EC pH Ca Mg Na K Cl SO4 HCO3 Pb Fe June (n = 18) Min 545 6.7 64.13 35.88 18.5 6.14 56.80 14 131.76 0.03 0.023 Max 1783 7.9 232.46 181.20 143.7 18.02 337.25 309 1348.10 1.83 0.338 Mean 1012 7.1 134.13 84.20 61.7 12.92 166.66 114 392.70 0.61 0.149 Std.Dev. 374 0.3 45.76 41.54 37.9 3.20 94.82 82 256.52 0.53 0.082 Sept (n = 18) Min 470 6.8 64.12 35.88 16.7 5.14 56.80 18 176.90 0.29 0.067 Max 2203 7.6 256.51 184.20 145.3 19.01 330.15 312 1342.00 1.79 0.789 Mean 1092 7.2 132.84 87.42 61.3 12.11 160.18 118 421.58 0.91 0.410 Std.Dev. 533 0.2 46.67 46.42 38.2 3.49 87.58 82 240.37 0.45 0.211 Dce (n = 18) Min 629 6.8 62.52 35.45 16.3 4.20 63.90 37 183.00 0.02 0.089 Max 2578 7.9 250.09 192.21 145.4 20.20 337.25 368 1335.90 0.29 0.645 Mean 1304 7.1 128.49 83.96 60.3 12.04 170.99 134 433.32 0.09 0.325 Std.Dev. 604 0.3 45.53 39.96 38.3 3.47 94.91 90 242.17 0.07 0.133 Total (n = 54) Min 470 6.7 62.52 35.45 16.3 4.20 56.80 14 131.76 0.02 0.023 Max 2578 7.9 256.51 192.21 145.4 20.20 337.25 368 1348.10 1.83 0.789 Mean 1136 7.1 131.82 85.19 61.1 12.36 165.94 122 415.87 0.54 0.295 Std.Dev. 518 0.3 45.18 41.94 37.4 3.35 90.85 84 242.38 0.53 0.185
All values are in mg/l except pH and EC (µ.Siemens/cm).
RESULTS AND DISCUSSION
Hydrochemical characteristics
Statistics of the chemical compositions of the groundwater
samples are shown in Table 1. The groundwater samples
of the study area have pH values ranging from 6.7 - 7.9,
which indicate that the groundwater is slightly alkaline. The
electrical conductivity (EC) values ranged 470 - 2,578
µS/cm. The order of abundance of the major cations is
Ca Mg > Na
> K and all samples exceeded the desirable
limit of Ca for drinking water (75 mg/l) except sample 10,
but only 78% of them exceed that of Mg (50 mg/l). The
abundance of the major anions is HCO
3Cl > SO
4and
almost 28% of the samples exceeded the desirable limit of
Cl (200 mg/l), but the sulfate concentrations are all below
health guidelines (WHO, 1993). The concentration of lead
for the three campaigns ranges from 0.02 - 1.83 mg/l and
all samples exceeded the WHO guideline limit of 0.01
mg/l. In the case of iron, the concentration in many of the
samples was higher than the WHO permitted limit of 0.3
mg/l and the percent samples above the WHO limit
ranges from 60 - 83% for the three campaigns. Since in
this region, except for agricultural activity no other
anthropogenic activities were being carried out in this
region and hence the high Fe concentration in these
waters could not be assigned to the anthropogenic
activities but rather the water-rock interaction should be
the reason for the higher value of Fe observed in the
plain. It is clearly observed that the concentrations of the
major elements do not undergo an appreciable change
during the three campaigns. For this reason the three
campaigns were grouped as one.
Cluster analysis
Cluster analysis suggests three groups of groundwater’s
(Figure 3 and Table 2). EC seems to be a major
distinguishing factor, which increases with concentrations
increasing in all major-ions following the order: Group 1,
2 and 3 (Table 2). The Group 1 is composed of the wells
3, 4, 5, 6, 7, 10, 12 and 13, and concerns 44% of the
water samples. This type of water is relatively fresh with a
mean EC of 782 µS/cm, which is the characteristic of less
saline water (Ca-Mg-HCO
3). This group is basically
bicarbonate dominated, however; calcium and magnesium
are also present.
Group 2 is represented by the wells 1, 8, 11, 15, 16 and
17, and it occupies 24% of the water samples. The
electrical conductivity for this group is 1.062 µS/cm,
which is the characteristic of mixed water (Mg-Ca-HCO
3-Cl). This water type 2 is bicarbonate and chloride dominated
and it also has low concentrations of sulfate. This water
type can be interpreted as the first step of water-rock
interactions occurring in dilute solutions, explained by the
abundance of carbonate and evaporite formations in the
aquifer.
Group 3 includes samples: 2, 9, 14 and 18, where the
EC is 1.956 µS/cm which is the characteristic of blended
water (Mg-Ca-Cl-HCO
3). Chloride content is also high with
Figure 3. Dendrogram of the hydrochemical samples.
Table2. Mean parameter values of the three principal water groups (determined from HCA).
Group EC pH Ca Mg Na K Cl SO4 HCO3 Pb Fe
G1(n = 24) 782 7.0 108.93 54.98 26.3 10.81 82.83 98 352.03 0.45 0.319
G2 (n = 18) 1062 7.1 120.08 89.44 78.0 12.37 198.05 127 342.62 0.54 0.336 G3(n = 12) 1956 7.3 195.22 139.25 105.4 15.43 284.01 164 653.41 0.70 0.185 pH (standard units), EC (µ.Siemens/cm) and mean (mg/l).
and geographical position, discharges of industrial waste-
water and contamination of the groundwater by seawater
were excluded as the source of high concentrations. A
local contamination by septic tanks, sewage systems,
agricultural fertilizers and dissolution of the formations
clay, marl and salt and could be responsible for this
elevation.
Factor analysis
Table 3. Rotation PCA loading matrix Group 1 2 3 Component 1 2 3 4 1 2 3 4 5 1 2 3 EC 0.92 0.22 -0.18 0.06 0.20 -0.09 -0.02 0.92 -0.14 -0.13 0.69 0.62 pH -0.16 -0.28 0.37 0.78 0.80 0.21 -0.22 0.14 0.07 -0.96 -0.07 -0.07 Ca 0.81 0.05 0.02 -0.27 -0.86 0.25 0.01 0.11 0.21 0.44 0.84 -0.15 Mg 0.81 0.26 0.12 -0.28 0.13 0.87 0.20 0.05 0.03 0.68 0.62 0.10 Na 0.34 -0.82 0.06 0.26 -0.28 0.37 -0.59 0.37 0.43 0.93 0.29 -0.07 K 0.23 -0.26 -0.46 0.63 0.05 -0.14 0.07 -0.14 0.93 0.24 -0.93 -0.04 Cl 0.88 -0.38 -0.07 0.06 0.78 0.27 0.07 0.36 0.25 0.93 0.18 -0.20 SO4 -0.47 0.06 -0.15 0.77 0.05 0.14 0.94 -0.04 0.07 0.91 -0.35 -0.06 HCO3 0.40 0.78 0.00 -0.36 -0.40 0.07 0.84 0.09 0.06 -0.91 0.05 0.32 Pb -0.01 0.09 0.89 0.00 0.35 0.74 -0.02 -0.35 0.05 -0.66 0.05 -0.23 Fe 0.23 0.78 0.36 0.13 -0.16 0.72 -0.04 0.05 -0.16 0.00 -0.02 0.91 % of variance 32.32 20.86 12.24 17.80 22.13 19.93 18.47 11.80 11.02 49.72 24.45 13.14 Cumulative % 32.32 53.17 65.41 83.21 22.13 42.06 60.54 72.34 83.36 49.72 74.17 87.30 The bold values indicate absolute component loadings higher than 0.5, which are considered significant contributors to the variance in the hydrochemistry.
determine the total number of factors for each data set in
this analysis. Under this criterion, only factors with
eigenvalues greater than or equal to 1 will be accepted as
possible sources of variance in the data, with the highest
priority ascribed to the factor that has the highest
eigenvector sum. The rationale for choosing 1 is that a
factor must have a variance at least as large as that of a
single standardized original variable to be acceptable.
Group 1
Four principal components (PC) were extracted and
rotated using the varimax normalization (Kaiser, 1960).
An initial run using the Kaiser criterion (Kaiser, 1960)
resulted in five principal components. However, it was
observed that the fifth factor would not constitute a
unique source of variance in the hydrochemistry since it
had only one loading greater than 0.50. It was therefore
dropped and four factors were chosen for varimax
rotation. The results of (Table 3) show that the four PC
account for more than 83.21% of the total variance, which
is quite good and can be relied upon to identify the main
sources of variation in the hydrochemistry. PC1
represents about 32.32% of the variance and has high
absolute loadings for EC, Ca, Mg and Cl and probably
shows the result of mineral water reactions in the area.
PC 2, which accounts for 20.86% of the total variance,
contains high loadings for Na, HCO
3and Fe. PC1and
PC2 represents the major geochemical processes taking
place, which is most probably the presence and
dissolution of some carbonate, dolomitic and evaporite
minerals in the aquifer. PC3 and PC4, respectively, show
high loadings for Pb and pH, K and SO
4. PC3 and PC4,
respectively, account for 12.24 and 17.80% of the variation
in the hydrochemistry.
Group 2
Five significant PCs explain 83.36% of the total variation
in the hydrochemistry. Most of the variance is contained
in the PC1 (22.13%), which is associated with the
variables pH, Ca and Cl (Table 3). PC 2 represents 19.93%
of the total variation in the hydrochemistry and has high
loadings for Mg, Pb and Fe. The variables Na, HCO
3and
SO
4contribute most strongly to the third component
(PC3) that explains 18.47% of the total variance. PC1,
PC2 and PC3 are assumed to be indicative of the natural
processes and water-rock interaction. PC4 and PC5,
respectively, show high loadings for EC and K.
Group 3
Three PCs explain 87.30% of the total variance (Table 3).
Most of the variance is contained in the PC1 (49.72%),
which is associated with the variables pH, Mg, Na, Cl,
SO
4, HCO
3and Pb and probably shows the result of
mineral water reactions in the plain. The aquifer is
sedimentary rocks, which range from sandstones to
conglomerates to clays with varying mineralogical
compositions. The variables EC, Ca and K contribute
most strongly to the third component (PC2), which
explains 24.45% of the total variance and probably
represents the presence of carbonate minerals in the
aquifer. PC3 explains 13.14% of the variance and is
mainly related to Fe and assumed to be indicative of the
water-rock interaction.
CONCLUSION
Multivariate statistical techniques including cluster and
principal component analysis can successfully be used to
derive information from the data set about the possible
influences of the environment on groundwater quality and
also identify natural groupings in the set of data. These
methods are important to avoid misinterpretation of
environmental monitoring data due to uncertainties. In
this study, multivariate statistical methods were applied to
data set obtained from Ain Azel plain, Algeria.
Interpretation of analytical data showed that the
abundance of the major ions is as follows: Ca Mg > Na
> K and HCO
3Cl > SO
4. Three major water types are
suggested by the Q-mode HCA analysis. The samples
from the area were classified as less saline water
(Ca-Mg-HCO
3), mixed water (Mg-Ca-HCO
3-Cl) and blended
water (Mg-Ca-Cl-HCO
3). The varifactors obtained from
PCA indicate that the parameters responsible for
groundwater quality variations are mainly related to
presence and dissolution of some carbonate, dolomitic
and evaporite minerals in relatively less saline water type;
natural processes and water-rock interaction in mixed
water type; water-rock interaction in blended water type.
The results of this study clearly demonstrate the
usefulness of multivariate statistical analysis in hydro
chemical.
REFERENCES
Alberto WD, Del PDM, Valeria AM, Fabiana PS, Cecilia HA, De Los Angeles BM (2001). Pattern recognition techniques for the evaluation of spatial and temporal variations in water quality. A case study: Suquıa River Basin (Cordoba-Argentina). Water Res., 35: 2881-2894. Alther GA (1979). A simplified statistical sequence applied to routine
water quality analysis: a case history. Ground Water, 17: 556-561. Anazawa K, Ohmori H (2005). The hydrochemistry of surface waters in
Andesitic Volcanic area, Norikura volcano, central Japan. Chemosphere, 59: 605-615.
Anazawa K, Ohmori H, Tomiyasu T, Sakamoto H (2003). Hydrochemistry at a volcanic summit area, Norikura, central Japan. Geochimica et Cosmochimica Acta., 67 (18S): 17.
APHA-AWWA-WPCF (1995). Standard methods for the examination of water and waste water (19th ed.). New York, USA.
APHA (1995). Standard methods for the examination of water and wastewater, 19th edn. Am. public Health Assoc. Wash., DC.
APHA (1989). Standard methods for examination of water and wastewater, 17th edn. Am. Public Health Assoc., Wash. DC. Attoucheik L (2006). Etude géochimique des rejets du complexe minier
de Kherzet Youssef (SETIF) et son impact sur l’environnement, Thesis, IST. USTHB, Algeria.
Belkhiri L (2005). Etude hydrogéologique et problème de la qualité des eaux souterraines de la plaine de Ain Azel, Wilaya de Sétif Est Algérien. Thesis, University of Batna, Algeria.
Boutaleb A (2001). Les minéralisations à Pb-Zn du domaine Sétifien-Hodna : Gitologie, pétrographie des dolomies, microthermométrie et implications métallogéniques. Ph.D. thesis statement in mining geology, IST. USTHB, Algeria.
Brown CE (1998). Applied Multivariate Statistics in Geohydrology and Related Sciences. Springer, New York.
Cameron EM (1996). The hydrochemistry of the Fraser River, British Columbia: seasonal variation in major and minor components. J. Hydrol., 182: 209-215.
Clesceri LS, Greenberg AE, Eaton AD (1998). Standard methods for the
examination of water and wastewater, 20th edn. Am. Public Health Assoc., Am. Water Works Assoc., Water Environ. Fed., Wash. Duffy CJ, Brandes D (2001). Dimension reduction and source
identification for multispecies groundwater contamination. J. Contaminant Hydrol., 48: 151-165.
Farnham IM, Johannesson KH, Singh AK, Hodge VF, Stetzenbach KJ (2003). Factor analytical approaches for evaluating groundwater trace element chemistry data. Analytica Chimica Acta., 490(1-2): 123-138.
Farnham IM, Stetzenbach KJ, Singh AK, Johannesson KH (2000). Deciphering groundwater flow systems in Oasis Valley, Nevada, Using trace element chemistry, multivariate statistics, and Geographical Information System. Math. Geol., 32: 943-968. Frape SK, Fritz P, McNutt RH (1984). Water-rock interaction and
chemistry of groundwaters from the Canadian Shield. Geochim. Cosmochim. Acta., 48: 1617-1627.
Galcon J (1967). Recherches sur la géologie et les gîtes métallifères du Tell Sétifien, Doct Thesis Sc. Nat. Publ. Serv. Geol., from Algeria. Garrels RM, MacKenzie FT (1967). Origin of the chemical compositions
of some springs and lakes, In: Equilibrium Concepts in Natural Waters. Am. Cancer Soc., Wash., DC.
Guiraud R (1973). Evolution post-triasique de l’avant pays de la chaîne Alpine de l’Algérie, d’après l’étude du bassin d’El Eulma et les régions voisines, Thesis Sc. Nat. Nice, France.
Güler C, Thyne GD (2004). Hydrologic and geologic factors controlling surface and Groundwater chemistry in Indian wells-Owens Valley area, southeastern California, USA. J. Hydrol., 285: 177-198. Güler C, Thyne GD, McCray JE, Turner AK (2002). Evaluation of
graphical and multivariate statistical methods for classification of water chemistry data. Hydrogeol. J., 10: 455-474.
Gupta LP, Subramanian V (1998). Geochemical factors controlling the chemical nature of water and sediments in the Gomte River, India. Envron. Geol., 36: 102-108.
Hartman J, Berna Z, Stuben D, Henze N (2005). A statistical procedure for the analysis of seismotechtonically induced hydrochemical signals: A case study from the Eastern Carpathians, Romania. Tectonophys., 405: 77-98.
Hem JD (1989). Study and interpretation of the chemical characteristics of natural water. US Geol. Surv. Water-Supply Paper, p. 2254. Huisman DJ, Kiden P (1998). A geochemical record of late Cenozoic
sedimentation history in Southern Netherlands. Geologie en Mijnbouw, 76: 277-292.
Kaiser HF (1960). The application of electronic computers to factor analysis. Educ. Psychol. Measurement, 20: 141-151.
Kim JH, Kim RH, Lee JH, Cheong TJ, Yum BW, Chang HW (2005). Multivariate statistical analysis to identify the major factors governing groundwater quality in the coastal area of Kimje, South Korea. Hydrol. Processes, 19(6): 1261-1276.
Laaksoharju M, Gurban I, Skarman C, Skarman E (1999). Multivariate mixing and mass balance (M3) calculations, a new tool for decoding hydrogeochemical information. Appl. Geochem., 14: 861-871. Liu CW, Lin KH, Kuo YM (2003). Application of factor analysis in the
assessment of groundwater quality in a blackfoot disease area in Taiwan. Sci. Total Environ., 313: 77-89.
Love D, Hallbauer D, Amos A, Hranova R (2004). Factor analysis as a tool in groundwater quality management: two Southern African case studies. Phys. Chem. Earth., 29(15-18): 1135-1143.
Mahlknecht J, Steinich B, Navarro de Leon I (2003). Groundwater chemistry and mass transfers in the Independence aquifer, central Mexico, by using multivariate statistics and mass-balance models. Meng SX, Maynard JB (2001). Use of statistical analysis to formulate
conceptual models of geochemical behavior: water chemical data from Butucatu aquifer in Sao Paulo State, Brazil. J. Hydrol., 250: 78-97.
Momen B, Eichler LW, Boylen CW, Zehr JP (1996). Application of multivariate statistics in detecting temporal and spatial patterns of water chemistry in Lake George, New York. Ecol. Modelling, 91: 183- 192.
Olmez I, Beal JW, Villaume JF (1994). New approach to understanding multiple-source groundwater contamination: Factor analysis and chemical mass balances. Water Res., 28(5): 1095-1101.
multivariate statistical techniques in hydrogeochemical studies: an example from Karnataka, India. Water Res., 36(10): 2437-2442. Savornin J (1920). Etude géologique du Hodna et du plateau Sétifien,
Thèse Sc. Nat. Lyon. France.
STATISTICA® 5.0 for Windows (1998). StatSoft, Inc.,Tulsa OK. USDA,
Natural Resources Conservation Services, 1999. Soil taxonomy: A basic system of soil classification for making and interpreting soil surveys. Agric. Handbook No. 436, p. 871.
Suk HJ, Lee KK (1999). Characterization of a ground water hydrochemical system through multivariate analysis: clustering into ground water zones. GroundWater. 37(3): 358-366.
Tariq RS, Shah MH, Shaheen N, Khalique K, Manzoor S, Jaffar M (2005). Multivariate analysis of trace metal levels in tannery effluents in relation to soil and water: a case study from Peshawar, Pakistan. J. Environ. Manage., 79: 20-29.
Tebens L, Veldkamp A, Kroonenberg SB (2001). The impact of climate change on the bulk and clay geochemistry of fluvial residual channel infillings: the Late Weichselian and Early Holocene River Meuse sediments (The Netherlands). J. Quaternary Sci., 13 : 345-356.
Vila JM (1980). La chaîne Alpine d’Algérie orientale et des confins Algéro-Tunisiens, Thesis of doctorate be-Sc. Nat. Paris VI, France. Walling DE (1980). Water in catchment ecosystems. In: Gower, A.M.
(Ed.), Geochemistry, Groundwater and Pollution. A. A. Balkema, Rotterdam.
Ward JH (1963). Hierarchical grouping to optimize an objective function. J. Am. Stat. Assoc., 69: 236-244.
WHO (World Health Organization) (1993). Guidelines for drinking water quality, vol.1, Recommendations (2nd edn.), Geneva, WHO, pp 130. Williams RE (1982). Statistical identification of hydraulic connections
between the surface of a mountain and internal mineralized sources. Groundwater., 20: 466-478.
Yidanaa SM, Ophoria D, Banoeng-Yakubob B (2008). A multivariate statistical analysis of surface water chemistry data-The Ankobra Basin, Ghana. J. Environ. Manage., 88: 697-707.
Zeng X, Rasmussen CD (2005). Multivariate statistical characterization of water quality in Lake Lanier, Georgia, USA. J. Environ. Qual. 34: 1980-1991.