Journal of Fundamental and Applied Sciences is licensed under aCreative Commons Attribution-NonCommercial 4.0 International License.Libraries Resource Directory. We are listed underResearch Associationscategory.
SEISMIC PERFORMANCE ASSESSMENT OF LATYAN CONCRETE BUTTRESS DAM SUBJECTED TO DIFFERENT RECORDS INCLUDING RESERVIOR EFFECTS
BY FINITE ELEMENT METHOD
N. Salman Movahedi and B. Aminnejad*
Department of Civil Engineering, Rudehen Branch, Islamic Azad University, Rudehen, Iran
Received: 23 February 2016 / Accepted: 27 April 2016 / Published online: 01 September 2016
ABSTRACT
In order to design earthquake resistant dams and evaluate the safety of existing dams that will be exposed to future earthquakes, it is essential to have accurate and reliable analysis procedures to predict the stresses and deformations in dams subjected to earthquake ground motion. For a dam-water-foundation system, the earthquake response is significantly influenced by the interaction of the dam with the impounded water and with the underlying foundation region, thus increasing the requirements for the analysis procedure to be used, and complicating what would otherwise have been considered a routine finite element analysis of a concrete cross-section. In this paper Latyan concrete buttress dam subjected to different records including reservoir effects by finite element method using ABAQUS.
Keywords: correct dam; seismic; interaction; FEM; ABAQUS.
Author Correspondence, e-mail:[email protected] doi:http://dx.doi.org/10.4314/jfas.v8i3.31
1. INTRODUCTION
In the study of fluid-structure interaction, one of the main problems is identifying the hydrodynamic pressure applied to the dam body during an earthquake.
A response history analysis (RHA) procedure, based on the substructure method, was presented in 1981 to determine the earthquake response of concrete gravity dams including the
ISSN 1112-9867
hydrodynamic effects of the impounded water and the effects of interaction between the dam and a flexible foundation [1]. In the 1970s, due to some damages occurred in a number of big dams, the dam interaction analysis was attracted in many researchers to work on the topic. One of the early methods is based upon fluid incompressibility assumption. Based on this assumption, Westergard solved the equation governing the hydrodynamic pressure in the dam reservoir domain (Helmholtz's equation) [2].
In this method for the analysis of concrete dams, fluid is treated as an added mass to the body of the dam. Then, the studies of Chopra [3-4] showed that the fluid incompressibility assumption does not predict correctly the applied hydrodynamic pressure on the dam body. Therefore, the earthquake engineering group in concrete dams has considered fluid compressibility in most concrete dams as an important factor in determining the earthquake response [5]. The evaluation of the important hydrodynamic forces that develop on the upstream face of a large dam during severe transient excitations has been the subject of numerous studies, starting with Westergaard's classical work in 1933. Westergaard explained the physical behavior of dam-reservoir interaction for 2D coupled system [6]. Water compressibility and dam flexibility effects have been investigated by Chopra and Chakrabarti [7-8]. Leger and Bhattacharjee [9] presented a methodology for the approximate representation of the dam-reservoir interaction. At the another study carried out by Lotfi [10], decoupled modal approach in time domain was proposed using the mode shapes obtained from symmetric part of sub matrices of eigen value equations of dam-reservoir system. The seismic safety of concrete dams has always been considered as a major factor in the design of new dams and dam safety assessment after earthquakes in the area are discussed. Generally two reasons for growing concern about dams in earthquake resistance can be cited [11].
1 - The risks of injury due to the increasing population in the area downstream the dam.
2 - Several earthquakes occur in different areas of the world previously thought was inadequate safety measures and the need for continuing research in this area is felt [11].
In the present study, the dynamic behavior of concrete dam under earthquake and the horizontal component of important parameters such as substrate material and fluid interaction on the dynamic response of concrete dam Latyan Dam and using software (Abaqus) and the modal method are studied.
2. CASE DESCRIPTION
Latyan Dam is a buttress dam on the Jajrood River, located less than 25 km from Tehran in the south of city of Lavasan (figure 1). It is one of the main sources of water for Tehran metropolitan region. It was constructed between 1963 and 1967. The first generator in the dam's 45 MW hydroelectric power station was commissioned on 17 March 1969, the second on 13 April 1987.
Dam’s height is 107 meter and the length of Latyan dam is 450 meter with 90 meter width. [12]
Fig.1. Latyan dam, picture taken from downstream
3. GOVERNING EQUATIONS
The Dam-reservoir interaction is represented by two coupled differential equations of the second order. The equations of the structure and the reservoir can be written in the form:
[ ]{ ̈ } + [ ]{ ̇ } + [ ]{ } = { } − [ ] ̈ − [ ] ̈ + [ ]{ ( )} (1)
[ ]{ } + [ ] ̇ [ ]{ } = { } − [ ] { ̈ } (2)
Where [M], [C] and [K] are mass, damping and stiffness matrices of the structure, and [G], [C’] and [K’] are matrices representing mass, damping and stiffness of the reservoir, respectively. [Q]
is the coupling matrices and {f1} is the vector of body force and hydrostatic force. {f2} is the component of the force due to acceleration at the boundaries of dam-reservoir and reservoir-foundation. {P} and {U} are the vector of pressure and displacement. {Üg} is the ground
The two-dimensional system considered consists of a concrete gravity dam monolith supported on a horizontal surface of underlying flexible foundation rock, idealized as a viscoelastic half-plane, and impounding a reservoir of water, possibly with alluvium and sediments at the bottom (Figure 2). A complete description of the dam-water-foundation system is presented in Ref. [14].
Fig.2. Dam-water-foundation system
4. DAM-RESERVOIR INTERACTION
Akkose et al. [15] provided a vast study on different references related to the problem of fluid-structure interaction in which the finite element method is used. According to this study, three methods are used in solving the fluid-structure interaction problem through the use of the finite element method. These methods are: Westergard, Euler- Lagrange and Lagrange-Lagrange. In the Westergard method; the effect of the reservoir is applied to the structure as an added mass. In this method, the effect of pseudo fluid stiffness matrix and the interaction between dam and reservoir is neglected during earthquake acting.
In the Lagrange-Lagrange method, the response of both structure and fluid is the displacement, and the governing equations of the dam and reservoir system are symmetric.
In the Euler-Lagrange method; displacement is assumed as the variable response of the structure, and the pressure or velocity potential function is assumed to be the variable response of the fluid. In this case, the coupled system equations are nonsymmetric.
In this study, the Euler-Lagrange method is used to analyze the dam-reservoir interaction problem.
In both Eulerian and Lagrangeian methods, the governing equation of fluid-structure system is determined using wave propagation through the fluid by assuming linear compressibility and inviscosity. The wave propagation equation through fluid is as follows [16]:
∇ = = (3)
where p is the pressure function and c is the acoustic wave speed. If the fluid would be assumed as incompressible, Eq. (3) would take the following form[16]:
∇ = 0 (4)
This equation has been solved and studied by many researchers through different analytical and numerical methods. However, in this study, Eq. (3) is used to solve the fluid-structure interaction.
5. NUMERICAL MODELING
The numerical analysis is made with the program ABAQUS using ABAQUS/Standard as the equation solver. ABAQUS/Standard is a general-purpose finite element analyzer, suitable for analysis of for example static and dynamic problems of both linear and nonlinear models. The model geometry as well as included forces and interaction properties are defined in ABAQUS/CAE (Complete Abaqus Environment).
5.1. Model of the dam
A numerical analysis with the finite element analysis software ABAQUS was performed in order to evaluate the stability of the dam and to support the analytical analysis. The numerical analysis is as well as the analytical analysis based on the geometry of the buttress dam Latyan, more precise its monolith 68. The dam body is modeled as a solid 3D deformable body (Figure3), which means that the body may change shape and/or volume when external loads are applied. The inherent parts are described below and the model of the dam is displayed in Figure 4.
Fig.3. Solid 4 nodal element
Fig.4. Modeling of Latyan dam in Abaqus
In ABAQUS/CAE, instances are created of the defined parts and are positioned relative to each other to form the assembly of the model. An instance can either be dependent or independent and that will determine how the mesh is defined. A dependent instance shares the geometry and the mesh of the original part [17]. The instances created in the analysis of Latyan dam are
“dependent”. Therefore the mesh is realized on the inherent parts and not on the associated
instances, which would be the case for an independent part instance. The defined mesh is described below for each part of the model and the meshed model as whole is displayed in Figure 5. A rectangular shaped massless foundation is used in this case while the reservoir length modeled is about five times of the dam height.
Fig.5. Illustration of how the model is meshed
The different parts that together form the dam body, i.e. front-plate, buttress and top part, are merged into one homogenous part allowing the dam body to act as one solid body with no slip between the individual parts. The foundation and the dam body are coupled through friction. The tangential frictional component is set to 0.75 what corresponds to the coefficient of friction set by RIDAS [18]. The normal behavior is described with the “penalty” function, which allows some
elastic slip even when the surfaces should be sticking. The penalty method approximates “hard”
pressure-overclosure behavior and the overall behavior resembles the one of a spring. Additionally, separation after contact is allowed for the interaction between dam body and foundation [17].
Modulus of elasticity of mass concrete in static and dynamic conditions is 40 GPa and 46 GPa,
respectively. Poisson’s ratio is 0.2 and 0.14 in static and dynamic conditions. Mass density of
concrete is 2400 kg/m3. Tensile and compressive strength of concrete are 3.4 MPa and 35.0 MPa, respectively. Thermal expansion coefficient of mass concrete is 6×10⁻⁶/°C. Deformation
modulus of foundation rock in saturated and unsaturated conditions is 13 GPa and 15 GPa, respectively. Poisson’s ratio of rock is 0.25 [19]. The reservoir water density is taken as 1000 kg/m3, the sound velocity is considered 1440 m/s in water and the wave reflection coefficient for the reservoir around boundaries is taken 0.8, conservatively.
5.2. Loads
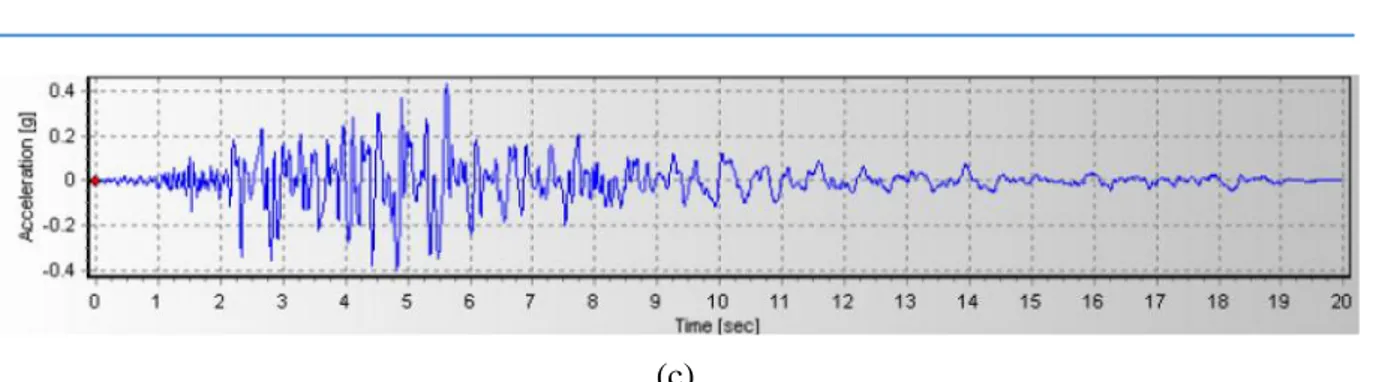
The applied loads are the dam body self-weight, hydrostatic pressure in summer condition (normal water level), thermal loads (summer temperature) and finally seismic loads based on seismic hazard analysis of the dam site. In each case, the load combination is shown with an abbreviation in which the first letter represents thermal/hydrostatic load condition, the other letters are the type of the seismic load and the final two numbers represents No. of earthquake ground motion. It is noteworthy that three ground motions were selected for seismic analyses based on source characteristics, source-to-site transmission path properties, and site conditions [20]. These ground motions are 1990 Rudbar (at Tabas station) as No.01, 2003 Bam as No.02 and 1978 Tabas as No.03. Time history of these ground motions are depicted in Fig. 6.
(a)
(c)
Fig.6. Time history of ground motions in stream: (a) Rudbar, (b) Bam and (c) Tabas
Different models were analyzed in order to involve usual cases encountered in practice. Their geometry and dimensions are as real and with no scale under different type of loading as illustrated in Table 1.
Table 1. Study models
Model Name Acceleretion Reservoir M1 Rudbar Full M2 Empty M3 Bam Full M4 Empty M5 Tabas Full M6 Empty
6. ANALYTICAL STABILITY ANALYSIS
In this section the results of the analysis is presented. These results represent the calculations specified in Section 4, which in turn is based on the theory introduced in Section 3.
6.1. Stress distribution
The numerical analysis yields display the stress distribution in the dam for a situation when all external loads have been applied to the structure. As opposed to the stress distribution derived in the analytical analysis (Figure 7), the results presented in Figure 7 imply that stress is more in downstream and in upstream and it is because of reservoir effect.
Fig.7. Stress distribution in the M1 model from the numerical analysis
The values can be considered reliable as long as there are no additional tensile stresses acting on the heel of the dam. For this purpose, it was considered important to have a stress analysis in order to analyze for any additional tensile stresses taking place at the heel. Figure 8 shows failure (concrete damage plasticity) in concrete in body of M1 model dam.
Fig.8. Concrete damage plasticity of M1 model 6.2. Displacement
After applying load on model the whole model has displacement in all body.but top of dam is a critical point that can be analyzed separately. In this study, the top displacement of models have
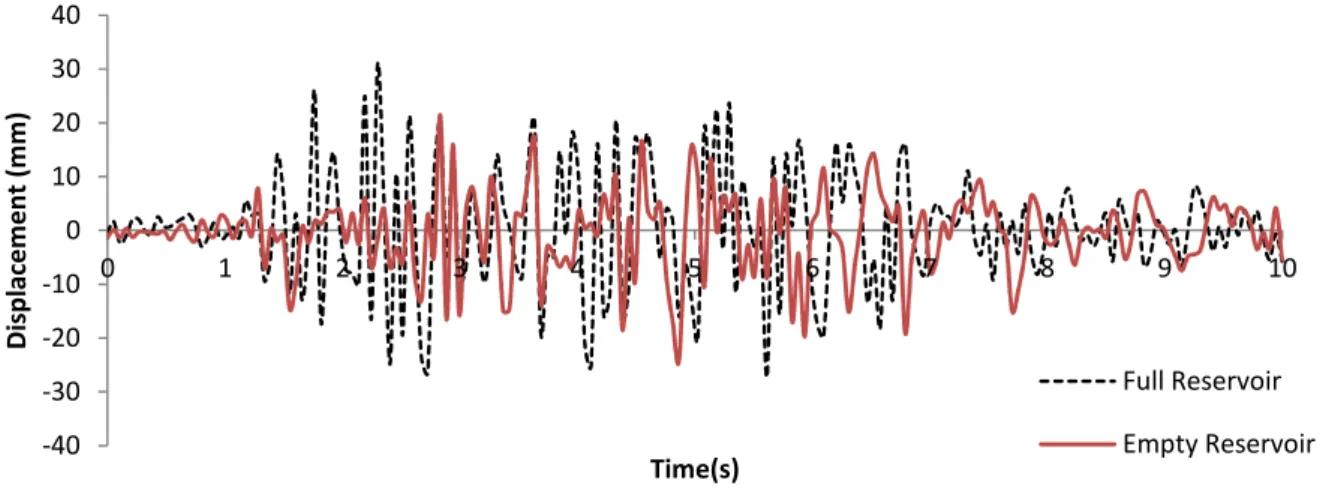
been studied too. For M1 and M2 models wit and without water in backfill reservoir top displacements has been illustrated in figure 9.
Fig.9. Horizontal displacement in Model M1 and M2
Figure 9 shows the interaction effect influence on displacements. As results show top displacements of these two models are different from each other, the interaction effect results in larger displacements in the entire earthquake period, however the maximum displacement remains unchanged. Results show that in full state model M1 because of hydrostatic pressure on dam, displacements are more than model M2 with empty reservoir. All results of models are presented in table2.
The precise relationship between the displacements at midpoint of an element to the displacements at the two nodes at its ends will vary with the excitation frequency. Outputs from the program include hydrostatic loads; nodal point displacements and element stresses due to seismic loads; natural vibration frequencies and mode shapes of the dam (if the foundation is assumed to be rigid) or of an associated dam-reservoir system (if dam reservoir interaction is included); complete response histories for stresses and displacements for each finite element; and the peak maximum and minimum principal stress in each finite element and the times at which they occur. -40 -30 -20 -10 0 10 20 30 40 0 1 2 3 4 5 6 7 8 9 10 Di sp lac em en t ( m m ) Time(s) Full Reservoir Empty Reservoir
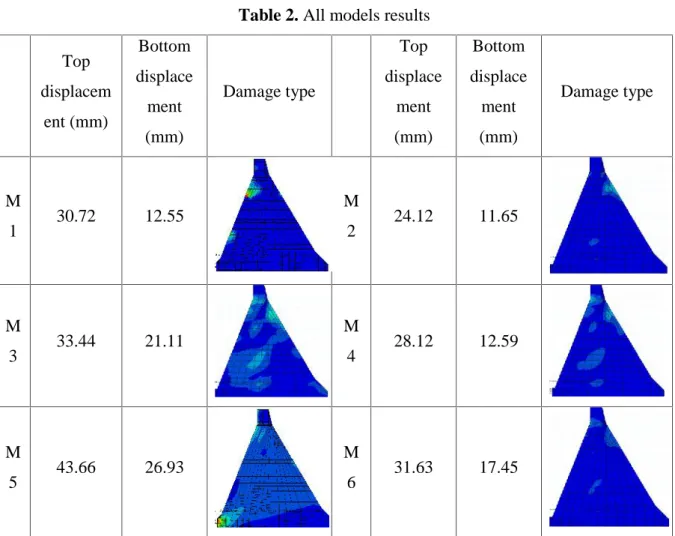
Table 2. All models results Top displacem ent (mm) Bottom displace ment (mm) Damage type Top displace ment (mm) Bottom displace ment (mm) Damage type M 1 30.72 12.55 M 2 24.12 11.65 M 3 33.44 21.11 M 4 28.12 12.59 M 5 43.66 26.93 M 6 31.63 17.45
Table 2 shows that because of defining concrete damage plasticity in concrete properties, damage counter are different in different models. But it is clear that in models with full reservoir the main damage criteria is in upstream of dam and in all three models with empty reservoir damages are almost near to center and downstream of dam. Using the translational displacement as an example, the field output would describe how the displacements vary over the modeled structure, i.e. it is possible to interpret at which part of the model that the displacements are largest. The correspondingly history output would instead focus on one specific point of the model and describe how the displacements varies with time for that specific point. Diagrams of Figure 10 and 11 illustrate the effects of reservoir on dam performance.
Fig.10. Bottom displacement of models Fig.11. Top displacement of models
M1, M3 and M5 corresponds to full reservoir dam model. It has been seen that reservoir modeling with dam causes to increase displacements, regarding to hydrostatic pressure increasing. Increasing of displacements due to seismic load modeling has been displayed in Figure 10 and figure 11.
7. RESULTS
Analysis procedures are available for earthquake analysis of concrete gravity dams including dam-water interaction is estimated directly from the earthquake design spectrum and response history analysis of a finite element idealization of the dam. The investigation presented in this article has led to the following conclusions:
Reservoir modeling with dam causes to increase displacements, regarding to hydrostatic pressure increasing. In models with full reservoir the main damage criteria is in upstream of dam and in all three models with empty reservoir damages are almost near to center and downstream of dam.
It’s important to note that the behavior of mass concrete especially in cracking is based on the
strain variation. Also the main performance of the concrete dams is their cantilever action because of releasing the tensile stresses due to vertical joints. Therefore, utilizing the strain-based criteria leads to more reliable interpretations and decision-making in the dam safety field and should be used for practical design of dams. Finally, the estimated overstrained regions are compared with the real crack profile from the nonlinear damage analysis of the dam. The results of the nonlinear analyses satisfy the estimated overstrained regions with acceptable accuracy.
0 5 10 15 20 25 30 35 40 45 M1 M2 M3 M4 M5 M6
Rudbar Bam Tabas
Bo tt om d isp lac em en t(m m ) 0 5 10 15 20 25 30 35 40 45 M1 M2 M3 M4 M5 M6
Rudbar Bam Tabas
To p di sp lac em en t(m m )
8. REFERENCES
[1] Chopra A. K and Chakrabarti P. Earthquake analysis of concrete gravity dams including dam-waterfoundation rock interaction. Earthquake Engineering and Structural Dynamics., 1981, 9(4), 363-383.
[2] Westergard H. M. Water pressure on dams during earthquakes. Transactions ASCE., 1933, 98, 418-472.
[3] Chopra A. K. Hydrodynamic pressure on dams during earthquakes. Journal of Engineering Mechanics, ASCE., 1967, 93, 205-223.
[4] Chopra A. K. Earthquake response analysis of concrete gravity dams. Journal of Engineering Mechanics, ASCE., 1967, 96(4), 443-454.
[5] National Research Council, EarthquakeEngineering for ConcreteDams:Design, Performance, and Research Needs, Washington, DC: The National Academies Press., 1990. [6] Westergaard H. Water pressure on dams during earthquakes. 1933 Trans. of ASCE.98. [7] Chakrabarti P &and ChopraA. Earthquake response of gravity dams including reservoir
interaction effects. Earthquake Eng. Research Center., 1972, Rep72-6, Berkley.
[8] Chopra A and Chakrabarti P. Dynamic of gravity dams. Significance of compressibility of water and 3D effects, Earthquake Engineering & Structure Dynamic., 1973, 2.
[9] Leger P, Bhattacharjee S. S. Reduced frequency independent models for seismic analysis of concrete gravity dam. International Journal of Comput & Struc., 1999, 6(44), 1381-1387. [10] Lotfi V. Seismic analysis of concrete gravity dams by decoupled modal approach in time
domain, EJSE., 2003, 3, 102-116.
[11] Shariatmadar H, Mirhaj A. Modal Response of Dam-Reservoir-Foundation Interaction, 8th International Congress on Civil Engineering., May 11-13, 2009, Shiraz University, Shiraz, Iran.
[12] https://en.wikipedia.org
[13] Ghaemian M and Ghobarah A. Nonlinear seismic response of concrete gravity dam with dam-reservoir interaction, International journal of Engineering Structure., 1999, 21, 306-315.
[14] Fenves G and Chopra A. K. Earthquake analysis of concrete gravity dams including reservoir bottom absorption and dam-water-foundation rock interaction. Earthquake Engineering and Structural Dynamics., 1984, 12(5), 663-680.
[15] Akkose M, Adanur S, Bayraktar A and Dumanoglu A. A. Elasto-plastic Earthquake response of arch dams including fluidstructure interaction by the lagrangian approach. Applied Mathematical Modelling., 2008, 32, 2396-2412.
[16] Zienkiewicz O. C and Taylor R. L. The Finite Element Method. Fifth Edition, Butterworth-Heinemann., 2000, 1, Oxford.
[17] Dessault Systémes. Abaqus 6.12 User’s manual. Dessault Systémes Simulia Corp, Providence, USA, 2012.
[18] RIDAS. RIDAS, Kraftföretagens riktlinjer för dammsäkerhet. Avsnitt 7.3 Betongdammar Tillämpningsvägledning (In Swedish). Svensk energi - Swedenergy AB, Stockholm, 2011. [19] Hariri-Ardebili M A and Mirzabozorg H. Investigation of endurance time method capability
in seismic performance evaluation of concrete arch dams. Dam Engineering., 2011, 22(1), 35-64.
[20] USACE: EM 1110-2-6051, Time-history dynamic analysis of concrete hydraulic structures, US Army Corps of Engineers., 2003, Washington, D.C.
How to cite this article:
Salman Movahedi N and Aminnejad B. Seismic performance assessment of Latyan concrete buttress dam subjected to different records including reservoir effects by finite element method. J. Fundam. Appl. Sci., 2016, 8(3),1206-1220.