HAL Id: hal-01701137
https://hal.umontpellier.fr/hal-01701137
Submitted on 27 Jan 2021HAL is a multi-disciplinary open access archive for the deposit and dissemination of sci-entific research documents, whether they are pub-lished or not. The documents may come from teaching and research institutions in France or abroad, or from public or private research centers.
L’archive ouverte pluridisciplinaire HAL, est destinée au dépôt et à la diffusion de documents scientifiques de niveau recherche, publiés ou non, émanant des établissements d’enseignement et de recherche français ou étrangers, des laboratoires publics ou privés.
and Hydrophobized Glass: Study by Normal Scanning
Confocal Fluorescence
Jean-Marc Janot, Michel Boissière, Thierry Thami, Emmanuel Tronel-Peyroz,
Nordine Helassa, Sylvie Noinville, Hervé Quiquampoix, Siobhán Staunton,
Philippe Dejardin
To cite this version:
Jean-Marc Janot, Michel Boissière, Thierry Thami, Emmanuel Tronel-Peyroz, Nordine Helassa, et al.. Adsorption of Alexa-Labeled Bt Toxin on Mica, Glass, and Hydrophobized Glass: Study by Normal Scanning Confocal Fluorescence. Biomacromolecules, American Chemical Society, 2010, 11 (6), pp.1661 - 1666. �10.1021/bm100313n�. �hal-01701137�
Adsorption of Alexa-labeled Bt toxin on Mica,
Glass and hydrophobized glass: Study by Normal
Scanning Confocal Fluorescence
Jean-Marc Janot1, Michel Boissière1a, Thierry Thami1, Emmanuel Tronel-Peyroz1, Nordine Helassa2b, Sylvie Noinville3, Hervé Quiquampoix2, Siobhán Staunton2 and Philippe
Déjardin1*
1 Institut Européen des Membranes, Université Montpellier 2, UMR5635 (ENSCM, CNRS, UM2), CC047, 34095 Montpellier Cedex 5, France
2 UMR 1222, Ecologie Fonctionnelle et Biogéochimie des Sols, INRA, Montpellier, France 3 Laboratoire de Dynamique, Interactions et Réactivité, UMR 7075, CNRS, Thiais, France
*corresponding author, philippe.dejardin@iemm;univ-montp2.fr
Title running head : Toxin adsorption on mica and glass
a Present address : ERRMECe, UFR Sciences et Techniques, Université de Cergy-Pontoise, 2
avenue Adolphe Chauvin - BP222, 95302 Pontoise Cedex, France
Abstract We studied the kinetics of adsorption of alexa-labeled Bt toxin Cry1Aa, in
monomer and oligomer states, on muscovite mica, acid-treated hydrophilic glass and
hydrophobized glass, in the configuration of laminar flow of solution in a slit. Using normal
confocal fluorescence through the liquid volume allows visualizing the concentration in
solution over the time of adsorption, in addition to the signal due to the adsorbed molecules at
the interface. The solution signal is used as calibration for estimation of interfacial
concentration. We found low adsorption of the monomer compared to oligomers on the three
types of surface. The kinetic adsorption barrier for oligomers increases in the order
hydrophobized glass, muscovite mica, acid-treated hydrophilic glass. This suggests enhanced
immobilization in soil if toxin is under oligomer state.
Introduction
A large proportion of commercial crops of genetically modified plants synthesize the
insecticidal protein known as Bt toxin originally produced by the soil bacteria Bacillus
thuringiensis. The risks associated with the liberation of such toxins in the soil must be evaluated1. Bt toxin can be introduced into soil via decomposition of plant biomass and root
exudation. The use of Bt crops can give markedly improved crop yields due to efficient
protection against pests, but their use raises the question of exposure of non-target organisms
and the acquisition of resistance by target insects. The mineral composition of soil is very
varied. Therefore, adsorption on model minerals such as goethite, kaolinite, montmorillonite,
rectorite and silicon dioxide is often examined 2-5. As for other proteins at interface we could
expect phenomena such as irreversible adsorption, conformational changes, exchange with
other solutes, and pH-dependence 6-9. Adsorption on soil may also increase the life time of the
protein by physical protection against enzymatic degradation10, 11 and it has been reported that
insecticidal activity is conserved12. The aim of the present work is to contribute to the
understanding of the fate of the toxin in the presence of hydrophilic minerals, such as
muscovite mica and glass, and hydrophobic surfaces via a surface-treated glass.
The state of the protein in solution is an important parameter in determining
adsorption properties. At large concentrations, high pH and high salt concentrations are
required to inhibit polymerisation of this protein13, 14. Among the methods of preparation of
the toxin reported in the literature, only a few verify that the monomer state was maintained in
solution. The protein dimerizes easily 15 and so the monomer is difficult to maintain in
solution. Although the tetramer is the entity responsible of the perforation of the insect midgut
wall16, this tetramer is formed on the bilayer from monomers in solution. We present a study
of the different adsorption behaviours of monomer and oligomers of Cry1Aa. The sensitivity
We used slit geometry, as in a previous work with radiolabeled proteins17-19, to create
controlled laminar flow. The solution signal is used as a calibration to evaluating the
interfacial concentration. In addition to the sensitivity obtained with a fluorescent label, the
technique is useful in studies involving a mica surface which is not suitable for other optical
techniques like total internal reflection fluorescence (TIRF), surface plasmon resonance
(SPR), ellipsometry or reflectometry.
Materials and Methods
Chemicals
The Cry1Aa solutions were prepared in 3-(Cyclohexylamino)-1-propanesulfonic acid
(CAPS, pKa 10.4) and 3-(N-Morpholino)-propanesulfonic acid (MOPS, pKa 7.2). Both
buffers were purchased from Sigma (France). Decyltrichlorosilane (Aldrich, France) and
reagent grade toluene (Sigma, France) were used as received. Labeling of Bt was performed
with Alexa-fluor-594 succinimidyl ester (InvitroGen, A30008).
Bt toxin and Alexa-labeled Bt
The procedure of preparation of Cry1Aa toxin has been published previously 4. The protein
(65 000 g/mol) contains 609 residues and is composed of three distinct domains. The domain
I contains eight helices bearing mainly negatively charged residues while the stacked domains
II and III are mainly composed of -sheeted structures bearing positively charged residues so that the external protein surface has an uneven distribution of charges 20, 21 . Its isoelectric
point pI is 6.5 22. Aliquots of concentrated solution were provided in CAPS pH 10.5. Diluted
samples in 10 mM CAPS, 350 mM NaCl, pH 9.6 were labelled with Alexa-594. Typically
800 µL of Bt solution were poured on dried fluorophore Alexa-594 in molar ratio 1:1 and
(Biospin P6) and centrifuged at 16,000 g for 1 min according to the supplier of the kit
(InvitroGen). Elution of the filtrate on a preparative size exclusion chromatography column
(BioRad P60; same elution buffer; pH 9.6) provided the pure monomer. It was verified that
labelled and unlabeled samples presented the same elution curve. The final average labeling
ratio [Alexa] / [protein monomer] was 0.5 - 0.7. Without centrifugation step, a substantial
amount of oligomers was obtained with labeling ratio ~ 0.1. Labeling ratio was determined
from the UV absorbances at 277 nm where both the label (277 –Alexa = 47793 M-1.cm-1) and
protein (277-protein = 82000 M-1.cm-1) absorb and at 587 nm where only the label (587 = 78000
M-1.cm-1) absorbs.
After column calibration with standard proteins the apparent molar masses was 44000
g/mol for monomer, lower than the reported value of 65 000 g/mol. This may be attributed to
an interaction with the column. Similar underestimation of the molar mass has been reported
with another type of column in size exclusion chromatography HPLC analysis13. Oligomers
were estimated to be an assembly of at least ten monomers. Tubes were stored at + 4°C. The
samples were diluted (0.1-1 % in vol) immediately before adsorption in 50 mM NaCl, 10 mM
CAPS buffer at the required pH obtained by addition of HCl or in 50 mM NaCl, 10 mM
MOPS buffer for experiments at both pH 6.3 and 7.2.
Substrates
Hydrophilic surfaces. Muscovite mica was purchased from Metafix SA (Montdidier, France) as 5 cm 2 cm sheets. It was freshly cleaved before each experiment. Glass surfaces were microscope slides (Menzel-Glaser 25 mm × 60mm) of thickness 140-150 µm. They
were made very hydrophilic with acid treatment (H2SO4 / H2O2 70/30 vol at 90°C for 30 min)
followed by extensive washing with ultrapure water. The sessile water drop contact angle was
near 0° with23-25 5 × 10¹⁴ silanols per cm2. The acid-treated cleaned glass will be called “hydrophilic” in what follows, to emphasize the contrast with hydrophobized glass.
Hydrophobized glass. Glass slides after the previous treatment were dried under nitrogen flow and heated at 110°C in an oven for 20 min. Then six slides, using a holder made in
Teflon, were put in decyltrichlorosilane 1 mM in toluene (250 mL) at 20°C for 1.5 h before
rinsing with toluene (thrice) and drying under nitrogen. The water contact angle was 103.0°
0.9° over the six slides. Eight measurements, over the entire surface, were performed on each
plate with narrow distribution ( 0.5°), showing very homogeneous treatment on the whole surface of each item.
Flow cell
The flow cell has been described previously26. A microscope slide, just cleaned or
hydrophobized, was positioned near the objective. The other wall was mica sheet with holes
punched at each extremity for entry and exit of flowing solution ( Fig. 1). The channel width
w and height b were 3 mm and 50-70 µm respectively. The parameter characterizing the convection is the wall shear rate deduced from the imposed flow rate Q according to the Poiseuille-like relation Q = (1/6) b2 w. Experiments were carried out at T=19°C and = 1000 s-1 for 30 min or more. Flow occurs in the x direction normal to the y scanning one. A
typical experiment consists first to flow the buffer to get the background signal and then the
protein solution. Adsorption can be measured on both walls of the slit and through the
Figure 1. Schematic illustration of the directions x of flow and y of translation of the
objective leading to the focus scanning through the thickness of the slit between the two walls
of glass (top) and mica (bottom).
For technical reasons, the experimental setup was limited to about 60 µm between the slit
walls. With such a distance between walls, the flow was laminar as the Reynolds number was
very small. Coupling between convection and diffusion leads to create a depletion layer
whose thickness depl can be estimated from the transport-limited Lévêque model 27, 28: depl
Dx/)1/3 =21 µm with Bt diffusion coefficient D = 7 10-7 cm2 s-1; x = 2 cm; = 1000 s
-1. For finite adsorption constant, such thickness remains of the same order of magnitude 29-31.
It can be inferred that depletion extends over about two to three times that distance. A
rigorous simple analysis of initial adsorption rate would require then such a ratio for
half-height of channel over Lévêque depletion layer thickness. The present conditions with the
ratio 1.5 could introduce coupling between the two faces. However we found this coupling to
be small as for instance the adsorption kinetics on mica are very similar in front of strongly
and mildly adsorbing wall. Axial diffusion in tubing before the cell and probably the type of
slit entrance into the slit led to not ideal hydrodynamic conditions for comparison with such
models. However, despite such drawback, as the conditions were very close from one
from one surface to another, which are discussed in the present work, remain valid. Current
work is in progress to improve especially the arrival of solution after buffer to approach the
almost step function obtained in a radioactivity cell32 as used for adsorption studies of -chymotrypsin on mica18.
Optical device
The optical device was previously described26. It is roughly similar to classical devices for
confocal fluorescence studies. With respect to the previous work, an easier scanning was
obtained as the step-by-step motor was changed to a piezoelectric device. A better separation
of excitation and emission wavelengths was also obtained (SemRock NF01-594-25). The
normal orientation of scanning with respect to the flow direction is sketched in Fig. 1. The
laser energy was 500 nW corresponding to a power density, when focusing at the interface, of
the order of 180 W / cm2 or less as this value does not take into account the energy loss
through the objective. Despite this relatively low energy, the x - position of the sample was
shifted a few micrometers (typically 5 µm) between each scan to avoid any possible
contribution of photobleaching, an effect sometimes observed at higher laser power without
lateral shift. This is justified by measurements at 2 cm far from the hole of entrance. Typically
200 scans correspond then to measurements between 2 and 2.1 cm. As for an ideal slit
geometry, the transport-controlled adsorption rate varies with the (1/3) power of distance x to
entrance, the correction is negligible.
Determination of interfacial concentration
Scanning normal to the walls of the slit through the solution along an axis y provides a
data set F(y,t), corresponding to the counting of photons over some time t at successive positions y, with a dependence t(y). The positions y are not regularly spaced as large signal variations near the interface require a greater density of points than in the centre of the slit.
One scanning process does not lead to an instantaneous profile. All the results presented
correspond to linear interpolations between the data of the scans to obtain equally time-spaced
instantaneous fluorescence signal profiles. Fig. 2 provides as an example such interpolated
profiles F(y,t) without and with adsorption at the interfaces. The interfacial concentration is
estimated via calibration given by the fluorescence signal Fsol of solution of known
concentration Cb. Fsol is the final steady-state value of the solution signal in the cell (see Fig.
2a as an example). The concentration in liquid phase is then equal to the concentration of the
incoming solution. The solution signal is always taken at mid-distance between the walls for,
near the interfaces, the adsorption intense signal masks the true contribution of solution. Fsol is
relative to an effective volume V containing solution at concentration Cb while the signal Fsurf
from surface concerns interfacial concentration over area A. As a first approximation, we will assume that the fluorophore is randomly oriented at interface as in solution. Then we
have time (t) dependent interfacial signal Fsurf (t) ~ (t) A and calibration solution signal Fsol
~ Cb V with the same proportionality constant. Therefore (t) = (V/A) (Fsurf (t) / Fsol) Cb.
Based on focus radius of 300 nm (objective numerical aperture 1.2; = 594 nm) and volume V ≈ 1 µm3, V/A = 3.5 µm. The convolution of the solution profile (step function at
both interfaces) with the beam shape leads to a sigmoid at the interfaces with half the bulk
solution signal at the interface (Fig. 2b). We used then as surface signal Fsurf the raw signal
minus half the solution signal. This correction is negligible when a strong adsorption occurs at
Figure 2 (a) Example of fluorescence concentration profile between two walls of hydrophilic
glass (y=9 µm) and mica (y = 67 µm) as a function of time when no adsorption is occurring
(flowing of Alexa-labeled Bt solution at 2.0 µg/mL in 10 mM CAPS pH 10.5, 350 mM NaCl).
(b) Illustration of sigmoid curve shape of solution signal at the interfaces; from bottom to top t
= 10; 20; 22.7; 25; 28.3 min. (c) Example when adsorption is occurring (flowing of oligomers
Compared to adsorption kinetics studies by means of -radiolabeled protein where the calibration is provided by the solution signal jump33, the use of confocal fluorescence may
introduce difficulties. The -emission indeed is not dependent on the position of the protein, in solution or at the interface, and moreover not dependent also on its conformation and
orientation. Conversely, the fluorescence properties may present such dependences. The
orientation of the protein in solution is isotrope but surface may induce a preferred orientation
of the adsorbed protein. Orientation changes can appear depending on surface coverage
during the adsorption process34-36. Such considerations are relevant for a fluorophore firmly
attached to the molecule26. In the present study the labeling was performed via a loose arm to
allow fluorophore freedom of rotation with respect to protein in solution. We assumed that
such freedom or random orientation existed at the interface.
Results and Discussion
Influence of pH on Bt adsorption (2.0 µg/mL) in CAPS
No adsorption occurred onto either interface (Fig. 2a) when 2 µg/mL Bt solution in
350 mM NaCl, 10 mM CAPS buffer (pH 10.5) was flowing through the slit between mica and
hydrophilic glass. Lower salt concentration (50 mM) at pH 8 and 7.3 (by addition of
concentrated HCl) led to the same observation. Only at pH 6.3 a small amount was adsorbed
at both interfaces. Conversely, on hydrophobized glass, we could observe a small
fluorescence signal at pH 10.5 and a much larger one at pH 6.3. From these series of
experiments, it was inferred that significant adsorption occurred only close to the isoelectric
point of the protein. Experiments at pH 6.3 and 7.2 were then performed with MOPS instead
we focused on the difference of behavior between monomer and oligomers at interfaces.
These buffers were preferred to phosphate as the dianions in this pH range may introduce
specific effects 9.
Monomer Adsorption kinetics
We studied adsorption from solutions at pH 6.3 using as buffer 50 mM NaCl, 10 mM
MOPS (Fig. 3). In such conditions, the Debye screening length (1.3 nm) is smaller than the
protein size (8 nm). Therefore the electrostatic interactions protein / surface should be of
relatively short range and involve only a part of the molecule. On mica a plateau was
observed at 20 µg/mL after 30 min, while a steady-state value was not attained at lower
concentrations within 50 min. The adsorption kinetics could be represented quite well by a
single increasing exponential function of time, at least over the time range of this study. On
the contrary, the adsorption behavior of Bt on hydrophilic glass showed an initial rapid step
followed by a much slower one: the two hydrophilic surfaces can be considered as two
Figure 3 (a) Adsorption kinetics at pH 6.3 of monomer Bt on mica at wall shear rate 1000 s-1
in a cell of height 60 µm. From bottom to top: Cb = 3.3 (); 5.3 (■); 20 µg/mL(▼). (b) idem
on hydrophilic glass
Over the time range of 1h, adsorption is almost the same on mica and hydrophilic glass,
0.015-0.020 µg cm-2 for 5.3-20 µg/mL solution. The same level is reached on hydrophobized
glass with the lower concentration of 2.0 µg/mL (Fig. 4) but a higher initial kinetic constant
(3.5 ± 0.5) × 10-6 cm s-1 vs 2.4 × 10⁻⁶ cm s-1 on mica. Those results suggest a slightly lower
adsorption barrier of Bt monomer in the presence of hydrophobized surfaces compared to
hydrophilic ones. Besides we observed on hydrophobic substrate the interfacial concentration
as a quite sharp decreasing function of pH above the isoelectric point of the protein (Fig. 4)
Figure 4 Adsorption kinetics from 2.0 µg/mL solution of monomer Bt on hydrophobized
Oligomers adsorption kinetics
Two series of experiments were carried out. One at pH 6.3 with Bt concentration of
13.2 µg/mL, the other at pH 7.2 with twice less concentration of 6.6 µg/mL. Each series
includes two experiments with mica facing either hydrophilic glass or C10-glass. Adsorption
kinetics are presented in Fig. 5. We can see the small effect of the facing wall on adsorption
on mica, as kinetic curves are very close to each other. This is an illustration of the small
coupling between the two faces in the adsorption process.
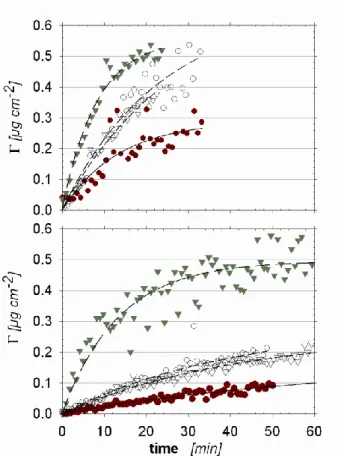
Figure 5 Adsorption kinetics of the oligomers on mica (o) in front of hydrophilic glass () and mica () in front of C10-glass (▼) from 13.2 µg/mL solutions at pH 6.3 (upper graph)
and from 6.6 µg/mL solutions at pH 7.2 (lower graph).
Whatever the pH value, adsorption onto mica was always intermediate between that on the
two types of glasses. At pH 6.3 however, the differences between the surfaces tended to
for hydrophobic glass suggest the same limit of interfacial concentration probably close to the
saturated surface. Given the size of the monomer (7-8 nm), a compact coverage of the surface
would correspond to 0.26 - 0.20 µg/cm2 and according to the random sequential adsorption
model 37, 38 to 0.16 - 0.12 µg/cm2. In addition, there is the question of the extent of spreading
of the oligomers on the surface. For a spherical oligomer of n monomers, the interfacial
concentration varies with n1/3. Whatever the exact value, it remains close to the order of
magnitude of a monolayer of monomer or oligomers. To make visible the pH effect from
experiments carried out at concentrations differing by a factor two, we gathered in Fig. 6 the
Fig. 5 fit curves, for sake of clarity, with the time scale axes for the two series differing by the
same factor.
Figure 6 (Bottom time scale, full lines from bottom to top: hydrophilic glass, mica,
hydrophobized glass) Interfacial concentration of oligomers as a function of time at pH 7.2,
Cb = 6.6 µg/mL; (Top time scale, dashed lines: same order) pH 6.3, Cb = 13.2 µg/mL
We observed that the pH has no effect on the initial adsorption kinetics on hydrophobic
glass while adsorption rate is a decreasing function of pH on mica and hydrophilic glass. The
electrostatic interactions between protein and hydrophobic surface are not predominant in this
negative surfaces of mica and glass contribute as a repulsive component for adsorption.
Another way to illustrate the pH effect is to compare the initial value of the kinetic constants
(1/Cb) (d/dt)t=0 (Fig. 7): the constant in the presence of hydrophobized glass does not vary
much between pH 6.3 and pH 7.2 while it is a decreasing function of pH for mica and
hydrophilic glass. All these values are underestimated because of the smooth transition from
buffer to solution, but the real ones should be positioned in the same order as hydrodynamic
conditions were similar for all experiments.
Figure 7 Initial kinetic constant for oligomers adsorption on hydrophilic glass, mica and
C10-glass at pH 6.3 and 7.2.
Comparison between monomer and oligomers adsorption behavior
From the previous results it is clear that the behaviors of monomer and oligomers are
very different: much faster adsorption occurred for the oligomers than for the monomer over
the three types of surface. Although most measurements were not continued until a plateau
value was attained, it is very likely that the plateau values for monomer would not attain the
corresponding values for oligomers, unless surface-induced conformational changes occur
over larger time scales. In the period 30 min to 50 min, there is a ratio of at least one order of
kinetics on hydrophobized glass was independent of pH (Fig. 6) in the studied range while the
monomer adsorption kinetics was not (Fig. 4).
Conclusion
Scanning Confocal Fluorescence measurements have been used to investigate the
adsorption behaviour of the Bt insecticidal protein, Cry1Aa, on macroscopic flat surfaces of
mica and glass. This protein (pI 6.5) has a strong tendency to oligomerize and the adsorption
properties of monomer and oligomers have been compared: they are very different.
In contrast with the often reported behavior of globular proteins near their isoelectric
point, the adsorption of monomer Cry1Aa toxin was slow on both types of hydrophilic
surfaces, mica and glass, and on the hydrophobic C10-treated glass. It should be pointed out
however that the nature of the buffer, independently of pH, may play a non negligible role.
The influence of low molecular-weight organic acid ligands on toxin adsorption was
previously studied3 and conclusion was drawn that the binding of the toxin on the minerals
was looser in the presence of such ions. Inorganic salts can influence also the adsorption
behavior2.
Adsorption of the oligomeric state was greater and decreased in the order hydrophobized
glass > mica > hydrophilic glass. The high adsorption of oligomers on hydrophobic surface
may result from neutralizing electric patches in the association that exposes hydrophobic
residues in patches facing the hydrophobic surface. On such kind of surfaces we observed a
strong dependence on pH for monomer contrary to oligomers. The kinetic curve shapes for
the monomer on hydrophilic glass differ notably from those for the oligomers. They may be
related to conformational changes induced at the interfaces, while similar modifications could
already have occurred in the oligomerization process. Whatever the type of mechanism, the
present study suggests that Bt toxin is more easily adsorbed in the oligomer state over various
This result, obtained with fluorescently-tagged protein, suggests quicker and larger
retention of the toxin in any soil if aggregation had occurred.
About the technique of fluorescence applied here to adsorption studies, it represents a first
step towards determining the profile of concentration in solution near the interface
concomitantly to the interfacial concentration as a function of time. Deconvolution of surface
and solution signals is presently under investigation. It should bring a direct new way towards
determination of kinetic parameters which are dependent on surface availability and
adsorption history39, 40. Still the present semi-quantitative study can become more quantitative
with determination of the ratio V/A and improving the sharpness of transition between the
flows of buffer and solution.
Acknowledgments. The authors are grateful for the financial support of Agence Nationale
de la Recherche under contract ANR-05-POGM-002-03. The authors thank R. Frutos for
valuable discussion, M. Royer for providing the Bt strain and the cultivation-extraction
protocol, F.X. Sauvage for protein analysis, INRA Narbonne for providing the fermentor, and
INRA proteomic platform for the mass spectroscopy analyses.
References
1. Fu, Q. L.; Deng, Y. L.; Li, H. S.; Liu, J.; Hu, H. Q.; Chen, S. W.; Sa, T. M., Applied Surface Science 2009, 255, 4551-4557.
2. Fu, Q. L.; Wang, W. Q.; Hu, H. Q.; Chen, S. W., European Journal of Soil Science
2008, 59, 216-221.
3. Fu, Q. L.; Dong, Y. J.; Hu, H. Q.; Huang, Q. Y., Applied Clay Science 2007, 37, 201-206.
4. Helassa, N.; Quiquampoix, H.; Noinville, S.; Szponarski, W.; Staunton, S., Soil Biology and Biochemistry 2009, 41, 498-504.
5. Zhou, X. Y.; Huang, Q. Y.; Cai, P.; Yu, Z. N., Pedosphere 2007, 17, 513-521.
6. Norde, W.; MacRitchie, F.; Nowicka, G.; Lyklema, J., Journal of Colloid and Interface Science 1986, 112, 447-456.
7. Norde, W.; Anusiem, A. C. I., Colloids Surf. 1992, 66, 73-80. 8. Le, M. T.; Dejardin, P., Langmuir 1998, 14, 3356-3364.
9. Etheve, J.; Dejardin, P.; Boissiere, M., Colloids and Surfaces B: Biointerfaces 2003, 28, 285-293.
11. Saxena, D.; Flores, S.; Stotzky, G., Soil Biology & Biochemistry 2002, 34, 133-137. 12. Tapp, H.; Stotzky, G., Applied and Environmental Microbiology 1995, 61, 1786-1790. 13. Guereca, L.; Bravo, A., Biochimica Et Biophysica Acta-Protein Structure and Molecular Enzymology 1999, 1429, 342-350.
14. Masson, L.; Mazza, A.; Sangadala, S.; Adang, M. J.; Brousseau, R., Biochimica Et Biophysica Acta-Protein Structure and Molecular Enzymology 2002, 1594, 266-275.
15. Walters, F. S.; Kulesza, C. A.; Phillips, A. T.; English, L. H., Insect Biochemistry and Molecular Biology 1994, 24, 963-968.
16. Vie, V.; Van Mau, N.; Pomarede, P.; Dance, C.; Schwartz, J. L.; Laprade, R.; Frutos, R.; Rang, C.; Masson, L.; Heitz, F.; Le Grimellec, C., Journal of Membrane Biology 2001, 180, 195-203.
17. Vasina, E. N.; Dejardin, P., Biomacromolecules 2003, 4, 304-313. 18. Vasina, E. N.; Dejardin, P., Langmuir 2004, 20, 8699-8706.
19. Vasina, E. N.; Dejardin, P.; Rezaei, H.; Grosclaude, J.; Quiquampoix, H., Biomacromolecules 2005, 6, 3425-3432.
20. Borisova, S.; Grochulski, P.; van Faassen, H.; Pusztai-Carey, M.; Masson, L.; Cygler, M., Journal of Molecular Biology 1994, 243, 530-532.
21. Grochulski, P.; Masson, L.; Borisova, S.; Pusztaicarey, M.; Schwartz, J. L.; Brousseau, R.; Cygler, M., Journal of Molecular Biology 1995, 254, 447-464.
22. Chevallier, T.; Muchaonyerwa, P.; Chenu, C., Soil Biology & Biochemistry 2003, 35, 1211-1218.
23. Perrot, H.; Jaffrezic-Renault, N.; Clechet, P., Journal of the Electrochemical Society
1990, 137, 598-602.
24. Zhuravlev, L. T., Langmuir 1987, 3, 316-318.
25. Legrand, A. P., The surface properties of silicas. In Wiley: Chichester, 1998; p 367. 26. Balme, S.; Janot, J.-M.; Dejardin, P.; Vasina, E. N.; Seta, P., Journal of Membrane Science 2006, 284, 198-204.
27. Lévêque, M., Les lois de transmission de la chaleur par convection. Faculté des Sciences: Paris, 1928.
28. Levich, V. G., Physical hydrodynamics. Prentice-hall, Inc., Englewood Cliffs, N.J.: 1962.
29. Dejardin, P.; Le, M. T.; Wittmer, J.; Johner, A., Langmuir 1994, 10, 3898-3901. 30. Dejardin, P.; Vasina, E. N., Colloids and Surfaces B: Biointerfaces 2004, 33, 121-127. 31. Déjardin, P.; Vasina, E. N., Initial adsorption kinetics in a rectangular thin channel and coverage-dependent structural transition observed by streaming potential. In Proteins at Solid-Liquid Interfaces, Déjardin, P., Ed. Springer: Berlin, 2006; pp 51-73.
32. Yan, F.; Dejardin, P.; Mulvihill, J. N.; Cazenave, J. P.; Crost, T.; Thomas, M.; Pusineri, C., Journal of Biomaterials Science-Polymer Edition 1992, 3, 389-402.
33. Boumaza, F.; Dejardin, P.; Yan, F.; Bauduin, F.; Holl, Y., Biophysical Chemistry
1992, 42, 87-92.
34. Robeson, J. L.; Tilton, R. D., Langmuir 1996, 12, 6104-6113.
35. Daly, S. M.; Przybycien, T. M.; Tilton, R. D., Langmuir 2003, 19, 3848-3857.
36. Daly, S. M.; Przybycien, T. M.; Tilton, R. D., Colloids and Surfaces B-Biointerfaces
2007, 57, 81-88.
37. Schaaf, P.; Talbot, J., Journal of Chemical Physics 1989, 91, 4401-4409.
38. Schaaf, P.; Voegel, J. C.; Senger, B., Journal of Physical Chemistry B 2000, 104, 2204-2214.
39. Calonder, C.; Tie, Y.; Van Tassel, P. R., Proceedings of the National Academy of Sciences of the United States of America 2001, 98, 10664-10669.
40. Tie, Y.; Calonder, C.; Van Tassel, P. R., Journal of Colloid and Interface Science
2003, 268, 1-11.