HAL Id: hal-01198714
https://hal.sorbonne-universite.fr/hal-01198714
Submitted on 14 Sep 2015
HAL is a multi-disciplinary open access
archive for the deposit and dissemination of
sci-entific research documents, whether they are
pub-lished or not. The documents may come from
teaching and research institutions in France or
abroad, or from public or private research centers.
L’archive ouverte pluridisciplinaire HAL, est
destinée au dépôt et à la diffusion de documents
scientifiques de niveau recherche, publiés ou non,
émanant des établissements d’enseignement et de
recherche français ou étrangers, des laboratoires
publics ou privés.
Influence of Defects on Sub-Å Optical Linewidths in
Eu3+: Y2O3 Particles
Karmel de Oliveira Lima, Rogéria Rocha Gonçalves, Domitille Giaume, Alban
Ferrier, Philippe Goldner
To cite this version:
Karmel de Oliveira Lima, Rogéria Rocha Gonçalves, Domitille Giaume, Alban Ferrier, Philippe
Gold-ner. Influence of Defects on Sub-Å Optical Linewidths in Eu3+: Y2O3 Particles. Journal of
Lumi-nescence, Elsevier, 2015, 168, pp.276-282. �10.1016/j.jlumin.2015.08.012�. �hal-01198714�
Influence of Defects on Sub-Å Optical Linewidths in Eu
3+
:Y
2
O
3
Particles
Karmel de Oliveira Lima,
‡Rogéria Rocha Gonçalves
§, Domitille Giaume,
‡Alban Ferrier
‡,†,*
and Philippe Goldner,
‡*
‡ PSL Research University, Chimie ParisTech - CNRS, Institut de Recherche de Chimie Paris, 75005, Paris, France
†
Sorbonne Universités, UPMC Univ Paris 06, 75005, Paris, France
§ Departamento de Química, Faculdade de Filosofia Ciências e Letras de Ribeirão Preto, Universidade de São Paulo, Avenida
Bandeirantes, 3900, CEP 14040-901, Ribeirão Preto, SP, Brazil
Corresponding Authors * E-mail: [email protected] Tel: +33 1 53 73 79 35 Fax: +33 1 46 34 74 89 * E-mail: [email protected] Tel: +33 1 53 73 79 30 Fax: +33 1 46 34 74 89
ABSTRACT: Rare earth doped nanocrystals have been recently suggested as useful materials for applications in quantum
information processing. To reach optical properties closer to bulk crystals ones, it is still necessary to reduce the defects that can arise in nanoscale structures. Here, we probe the defects level by monitoring the inhomogeneous broadening of the 7F0
5
D0
transition in particles of 0.3% Eu3+:Y2O3. We find that lines as narrow as 14 GHz (0.015 nm), a value comparable to single crystals,
can be obtained in 150 nm particles calcinated at 1200°C. The additional broadening observed for particles calcinated at lower temperature is attributed to defects inside crystallites and not to surface effects. A linear correlation is also observed between optical and Raman linewidths, suggesting that both processes are sensitive to the same defects. 5D0 excited state lifetimes are well
described by a model based on an effective refractive index and we conclude that the defects causing the inhomogeneous broadening have no effect on the excited state population.
1. INTRODUCTION
Rare earth (RE) doped particles are actively investigated as efficient light emitters for various applications in biology, imaging, lighting or display [1-6]. Recently it was shown that RE nanocrystals could also be useful in quantum information processing (QIP) [7-9] and extend the promising results already obtained in bulk single crystals [10], especially in the field of quantum memories [11-15]. QIP relies on superposition states with long lifetime, corresponding to the so-called coherence lifetime (T2). In Eu3+:Y2O3 nanocrystals, photon echo
measurements showed that T2 can be as long as 3.7 µs at 1.3 K [7] suggesting that these materials could offer new
materials still need to be significantly improved, as T2 in RE particles is still several orders of magnitude lower than
in the best bulk crystals [7, 8].In particular, defects that may arise at the nanoscale should be reduced. This has been widely studied in fluoride and oxide particles for luminescence based applications [1]. Especially significant improvements in emission and excitation efficiencies have been obtained in RE doped Y2O3 particles e.g. by
post-synthesis treatments, core-shell structures, co-doping or varying particle and crystallite sizes [17-20].
Superposition states are much more sensitive to perturbations, and their lifetime T2 can strongly change in
materials with similar excited state lifetimes (T1) [21]. Low temperature and high resolution optical spectroscopy is
a convenient technique to probe defects at low concentrations, as they cause optical lines to broaden through the variation in the local electric field felt by the optical centers [22]. These defects include impurities, dopants, and vacancies (point defects) as well as various types of dislocations (extended defects). Because of the random nature of defects, each optical center sits in a different environment, resulting in differing optical frequencies. The consequence is the so-called inhomogeneous broadening (Γinh) of the transition.
In this paper, we report on the inhomogeneous linewidths of the 7F0-5D0 transition of sub-micron Eu3+:Y2O3
particles in the 10-40 GHz range (0.01-0.04 nm). By independently varying particle and crystallite sizes, we show that defects contributing to Γinh can be partially removed at high calcination temperatures. These defects are also
likely to cause Raman line broadening, as a nearly linear correlation between Raman and optical linewidths is observed. Finally, the variation of 5D0 excited state lifetimes as a function of particle size is well described by local
field and photon density of states effects. This suggests that the defects have no influence on the relaxation dynamics of the excited state.
2. EXPERIMENTAL SECTION
2.1. Synthesis of Eu3+:Y2O3 particles
We have used Y(NO3)3 • 6H2O (99.9% pure, Alfa Aesar) and Eu(NO3)3 • 6H2O (99.99% pure, Reacton) as yttrium and
europium sources. The Eu3+ concentration used for all samples was 0.3 at. %. In a typical synthesis [23,24], an appropriate amount of urea (CO(NH2)2 > 99% pure, Sigma) was dissolved in a mixed Eu/Y aqueous nitrate solution to make a total
solution volume of 800 mL. The concentrations varied as 0.3, 0.5, 2.0 and 3.0 mol.L-1 for urea and 7.5 mmol.L-1 for metals (Eu3+ and Y3+). The mixed solutions were heated at 85°C for 24 h in a Teflon reactor. The final suspensions were then cooled to ambient conditions and the colloidal particles collected via centrifugation. The wet precipitates were washed with distilled water once to remove the byproducts, then rinsed twice with absolute ethanol, and dried at 80°C for 24 h to yield a white powder. The synthesis yield was 78 % in weight. The 0.3 at. % Eu3+:Y2O3 samples were obtained by calcination of these
original powders[Eu3+: Y(OH)CO3 . n H2O] under air during 6 h at temperatures ranging from 900 to 1200°C, which were
reached using a heating rate of 3 °C min-1. The cooling rate was 5 °C min-1. 2.2 Characterization Techniques
The morphology, size and dispersion of the original and calcinated particles were visualized by transmission electron microscopy (TEM) using a JEOL – JEM-100CXII apparatus at an accelerating voltage of 100 kV. For TEM measurements, a small amount of powder was dispersed into anhydrous ethanol, and a drop placed over a carbon coated microscope copper grid. TEM images were used to measure the particle size distributions of each sample, using about 300 particles. The crystalline phase of the annealed systems was determined by x-ray diffraction (XRD) analysis with a PANALYTICAL X`PERT PRO diffractometer using monochromatic CuKα1 radiation (wavelength at 154.060 pm) in the 2θ range between 12 and 150˚, with a 0.006˚ step size at room temperature. The crystallite sizes were determined by Rietveld refinement [25]
using FullProf software [26]. The integral breadth of all diffractogram peaks between 12 and 150˚ were taken into account. Micro-Raman spectra were recorded in the range 100-800 cm-1 using a Renishaw In-via Raman spectrometer with a He-Ne laser excitation (wavelength: 633 nm). For optical spectroscopy, the particles, in the form of a powder, were packed into a 2 mm diameter hole in a 0.5 mm thick copper plate and held in place by two glass windows. The assembly was put into a closed-cycle cryostat (Janis CTI-Cryogenics Model CCS-150) with the temperature monitored by a LakeShore model 330 controller. The inhomogeneous linewidths were probed by monitoring fluorescence intensity as a function of the frequency of a single mode dye laser (Coherent 899-21, 1 MHz linewidth). A low laser intensity (25 µW/cm2) was used to avoid saturation of the transition and spectral hole burning. Fluorescence was collected by a 75 mm diameter lens and focused on a photomultiplier tube after suitable filtering to eliminate scattered laser light. Decay measurements were recorded using a tunable optical parametric oscillator pumped by a Nd:YAG Q-switched laser (Ekspla NT342B-SH) with 6 ns pulse length, a Jobin-Yvon HR250 monochromator and a photomultiplier tube. The detection time constant was 20 µs and data were recorded on a digital oscilloscope.
3. RESULTS AND DISCUSSION
3.1 Structure
Monodispersed spherical particles with a chemical composition of Eu3+ doped yttrium basic carbonate[Eu3+: Y(OH)CO3 • n
H2O] were synthesized by homogeneous precipitation [23,24]. In this reaction RE cations precipitate with anions such as
CO32- and OH- produced by the dissolution of urea and form an amorphous Y(OH)CO3 • n H2O compound [27]. In order to
change the size of these particles the concentration of urea was systematically varied from 0.3 to 3.0 M. Fig. 1 shows a series of histograms and TEM micrographs that illustrate the effect of urea concentration on particle size of Eu3+: Y(OH)CO3. All
systems exhibit spherical, well-dispersed particles with smooth surfaces. An increase in urea concentration decreases the average particle size from 729 ([urea]= 0.3 M), 633 ([urea]= 0.5 M), 289 ([urea]= 2.0 M) to 198 nm ([urea]= 3.0 M), with standard deviations of particle sizes around ± 73, ± 67, ± 39 and ± 38 nm, respectively, according to a log normal fit. The inverse relationship between urea concentration and the average particle size is due to the balance between nucleation and growth processes [27, 28]. At high urea concentration, the elevated amount of CO32- and OH- groups promotes a higher
degree of super-saturation before the beginning of precipitation. Thus, the larger nucleation density decreases the average particle sizes.
Fig. 1. TEM images and histograms with log normal fit (red line) of 0.3 at. % Eu3+: Y(OH)CO3 products obtained using urea
concentrations from 0.3 to 3.0 M. The scale bars (1 µm) are identical in all images.
The yttrium basic carbonate can be decomposed into Y2O3 at temperatures higher than 600°C [23, 27], and in order to obtain
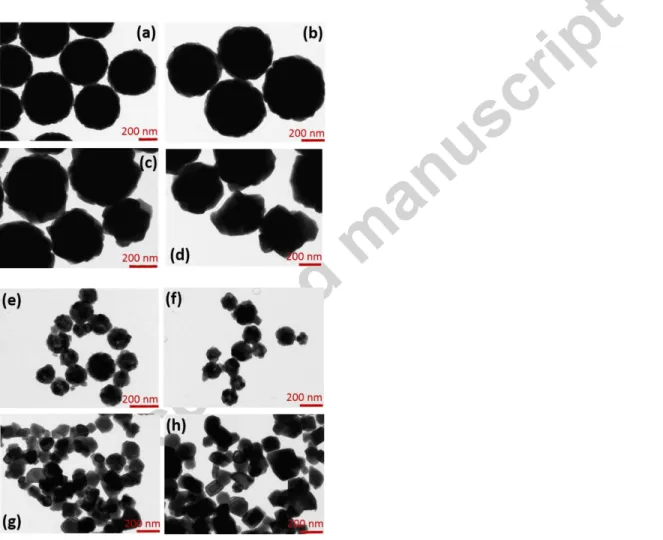
yttrium oxide particles, all synthesized systems with different particle sizes were calcinated at 900, 1000, 1100 and 1200°C during 6 h. The TEM images of systems prepared by using 0.3 and 3.0 M of urea, and calcinated at 900, 1000, 1100 and 1200°C over 6 h are presented in Fig. 2. The calcination process changes the morphology of the particles as evidenced by the appearance of crystalline planes on the particle surfaces (Fig. 2d and 2h). Micrographs also show that Y2O3 particles are
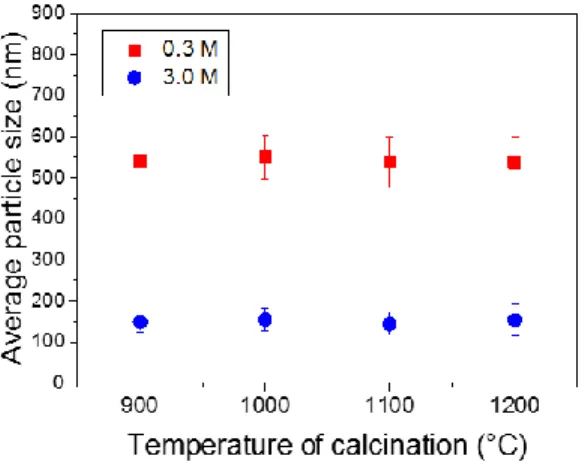
generally formed by several crystallites that grow when the temperature of calcination is increased. However, single crystalline particles were observed after treatment at 1200°C (Fig. 2h) when using 3.0 M of urea. Average particle size as a function of calcination temperature for samples prepared using 0.3 and 3.0 M of urea are shown in Fig. 3.
Fig. 2. TEM images of 0.3 at. % Eu3+: Y2O3 particles obtained using 0.3 M of urea and calcinated at (a) 900, (b) 1000, (c)
Fig. 3. Average particle size as a function of calcination temperature for 0.3 at. % Eu3+: Y2O3 particles obtained by using 0.3
and 3.0 M of urea. The error bars are based on the standard deviation of size distributions.
In agreement with previous work [23, 28], the Eu3+:Y2O3 particles possessed diameters around 25 % smaller compared to the
Eu3+: Y(OH)CO3 particles.However, no significant variation in particle size was observed by increasing the temperature of
annealing. Eu3+: Y2O3 particles show 540, 450, 215 and 150 nm average diameter sizes and ± 58, ± 48, ± 34 and ± 30 nm
standard deviations for syntheses using 0.3, 0.5, 2.0 and 3.0 M of urea, respectively. Fig. 4 presents the XRD patterns of 0.3 at. % Eu3+:Y2O3 particles after calcination at 900, 1000, 1100 and 1200 °C for 6 h, and obtained using 0.5 M of urea. All
other samples exhibited the same patterns. They are characteristic of the yttrium europium oxidebody-centered cubic (bcc) Y2O3 structure(Ia3 space group). No additional peaks that could correspond to parasitic phases were found.
Fig. 4. XRD patterns of 0.3 at. % Eu3+: Y2O3 particles calcinated at 900, 1000, 1100 and 1200°C and synthesized using 0.5
M of urea.
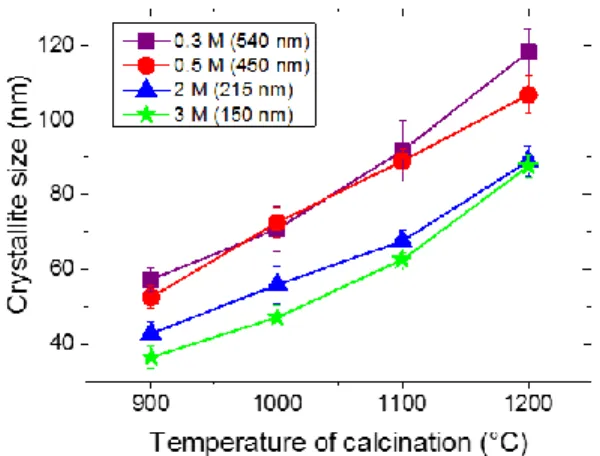
Average crystallite sizes as a function of calcination temperatures are presented in Fig. 5. A nearly linear enlargement of crystallites with the annealing temperature is found for all systems, in agreement with TEM pictures. Fig. 5 also shows that systems calcinated at the same temperature but with different particle sizes can show different crystallite sizes.
Fig. 5. Crystallite size as a function of temperature of calcination for 0.3 at. % Eu3+: Y2O3 particles synthesized with varying
urea concentrations. Average particle sizes are indicated in the legend.
3.2 Optical Inhomogeneous Linewidths Measurements were performed on Eu3+7F0
5
D0 transition at low temperatures (12 K) to reduce homogeneous broadening
to negligible values [29]. Eu3+ ions substitute for Y3+ ones, which occupy two sites in the Y2O3 cubic structure. We probed
Eu3+ ions in the C2 symmetry site, as the absorption corresponding to the other site, of C3i symmetry, is very weak because of
inversion symmetry. Linewidths were recorded by monitoring the intensity of the strong 5D0 -7
F2 emission at 611 nm, while
scanning a single-mode laser centered at 580.88 nm (vacuum) through the 7F05D0 absorption.
Fig. 6 shows the 7F0 5D0 lineshapes obtained for particles using 0.3 and 3.0 M of urea and calcinated at varying
temperatures. As in all particles, the lines were centered at a wavelength of 580.88 +/- 0.01 nm (vacuum), identical to that found in single crystals and transparent ceramics [30-32]. For both urea concentrations, the inhomogeneous linewidths inh
decrease from 35 GHz (0.04 nm) to about 12 GHz (0.013 nm) with increasing calcination temperature. At 1200 °C, inh = 12
GHz for the 0.3 M particles of average size 540 nm, a value similar to the one found in a 0.3 % Eu3+:Y2O3 single crystal fiber
(11 GHz) [30]. Results obtained for other particles are gathered in Fig. 7 and are comparable to values reported for 0.05-0.5 % Eu3+:Y2O3 bulk crystals (5-23 GHz) [30,31], 0.1 % Eu3+ doped Y2O3 ceramics (7.8 GHz) [32], and 0.86 at. % Eu3+ doped
Fig. 6. 7F0 5
D0 transition lineshapes obtained by monitoring 5 D0 -7 F2 emission at 12 K in 0.3 at. % Eu 3+ : Y2O3. Particles
synthesized with (a) 0.3 and (b) 3.0 M of urea, and calcinated at temperatures from 900 to 1200°C. Maxima of all spectra are set at 0 frequency. Inset: Lorentzian fit (dashed line) of the spectrum of the 3.0 M particles calcinated at 1200 °C.
Inhomogeneous linewidths of this magnitude in rare earth doped crystals are generally due to strains produced by defects. Lineshape analysis can differentiate between point and extended defects. In all particles, a Lorentzian lineshape was found, indicating that inh is due to point defects with a low concentration (Fig. 6, inset) [7,22]. A first contribution to point defects
comes from Eu3+ ions themselves, partly because of the difference between their ionic radius compared to Y3+ (IR (Eu3+, ) 0. 50 A, IR (Y3+, ) 0. 2 A [33]). We estimate this contribution to be about 6 GHz by comparing
inh for single
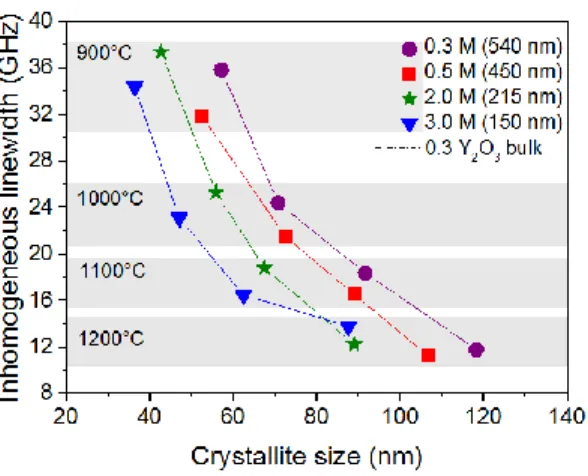
crystals at 0.3 and 0.004 % Eu3+ doping [30]. Fig. 7 shows that in all systems an additional broadening, due to other defects, is observed. This broadening clearly decreases with increasing calcination temperature, but show limited correlation with particle or crystallite size (Fig. 7). For example, 32 to 37 GHz linewidths are found for all particles calcinated at 900 °C, whereas particle and crystallite size vary by a factor 3.6 and 1.5 respectively. With the same size variations, inh stays
between 16 and 19 GHz for particles calcinated at 1100 °C. Moreover, for a fixed crystallite size of 60 nm, inh can vary
from 36 to 16 GHz. This suggests that the nature of the crystallites' surface and surface/volume ratio has little influence on the inhomogeneous broadening. In particular, for all particles calcinated at 1200 °C, linewidths comparable to those found in single crystal fibers can be obtained [30]. It should also be noted that no strong satellite lines were observed, meaning that most Eu3+ sites are only slightly distorted compared to bulk samples. We therefore conclude that the major contribution to
inh besides Eu3+ doping originates from low concentration defects internal to the crystallites. Oxygen vacancies could be one
of theses defects. Indeed, they have been suggested as responsible for abnormal temperature variations of the homogeneous linewidths in Eu3+:Y2O3 single crystals [30]. The same behavior was found in Eu3+:Y2O3 nanocrystals and was also attributed
Fig. 7. Inhomogeneous linewidth inh of the 7
F0 5
D0 transition as a function of crystallite size for Eu 3+
: Y2O3 particles
synthesized with varying urea concentrations. Dashed line: inh in a 0.3% Eu3+:Y2O3 single crystal fiber [30]. Average
particle sizes are indicated in the legend.
We also performed Raman spectroscopy as vibrational lines are also sensitive to strain, disorder and crystallite size [34, 35]. Fig. 8 shows the Raman spectra of Eu3+:Y2O3 particles synthesized using 3.0 M of urea and calcinated at different
temperatures. As a reference, the spectrum obtained on a 0.5% Eu3+:Y2O3 transparent ceramic (50 µm of crystallite size) is
also presented. All lines could be assigned according to the cubic Y2O3 space group, in agreement with previous reports [36,
37].Additional bands were assigned to Eu3+ fluorescence [17] and are marked by asterisks in Figure 8. To compare different particles, we focused on the main line at 377 cm-1. Although it showed no significant frequency shift, a clear decrease of its linewidth with increasing calcination temperature could be observed for particles of different sizes (Fig. 9). As the linewidth shows little correlation with crystallite size, we attribute it to the lattice defects [38], as in the case of the 7F0
5
D0
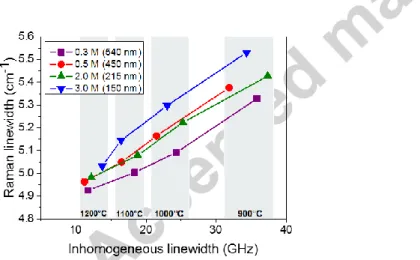
linewidth. Fig. 10 shows that the correlation between the Raman and optical linewidths is nearly linear, except for the smallest particle calcinated at high temperature. This suggests that the same defects, e.g. oxygen vacancies [38], are broadening both Raman and optical lines.
Fig. 8. Raman spectra of 0.3 at. % Eu3+: Y2O3 particles prepared using 3.0 M of urea and calcinated under different
Fig. 9. Linewidth of the main Raman line at 377 nm as a function of calcination temperature of 0.3 at. % Eu3+: Y2O3 particles
synthesized using different urea concentrations. Dashed line: linewidth in a 0.5% Eu3+:Y2O3 transparent ceramic. Average
particle sizes are indicated in the legend.
3.3 Excited State Lifetime
The defects that broaden the 7F0 5
D0 transition may also have dynamical effects by inducing non-radiative relaxations or
changing radiative emission probabilities because of site distortion. To investigate this, we recorded the 5D07F2 emission
decay at 611 nm after excitation of the 7F0 5
D0 transition, at 12 K and room temperature. In the latter case, particles were
in air in the form of a powder or dispersed in water.
Fig. 10. Linewidth of the main Raman line as a function of the 7F0 5D0 inhomogeneous linewidth in 0.3% Eu3+: Y2O3
synthesized using varying urea concentrations and calcinated at different temperatures. Average particle sizes are indicated in the legend.
All decays could be well fitted by single exponentials and showed no evidence of energy transfers. This was expected as the
5D
0 level is separated by 12000 cm-1 from the 7F6 one, making it largely insensitive to relaxations by radicals (e.g. OH-) that
can be present at the particles surface. Moreover, the low doping concentration prevented strong resonant energy transfer between Eu3+ ions. For all particles, room and low temperature decays were identical, which also suggests that the
non-radiative relaxations from the 5D0 level are negligible. However, the lifetimes significantly varied as a function of particle
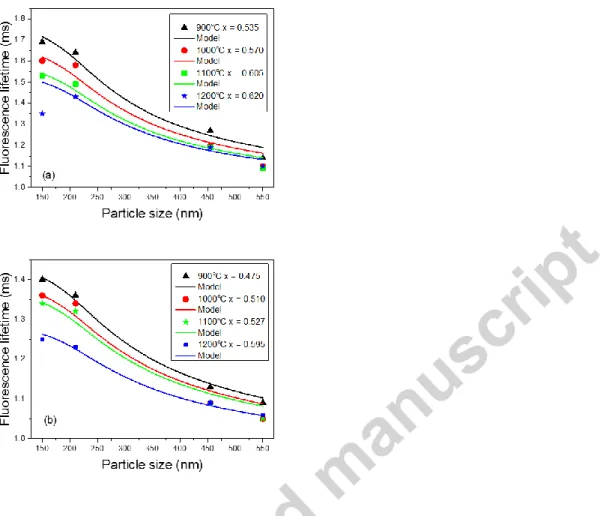
size and temperature of calcination, as shown in Fig. 11.
Fig. 11. Lifetimes of the 5D0 level measured in air (a) and water (b) as a function of particle size in 0.3% Eu3+: Y2O3
synthesized using varying urea concentrations and calcinated at different temperatures. Solid lines: fit using an effective index based model; x: filling factor (see text).
5D
0 lifetimes measured in air varied from 1.08 ms in the largest particles (540 nm) calcinated at 1200 °C, to 1.7 ms in the
smallest ones (150 nm) treated at 900 °C. This effect could be solely due to changes in the photon density of states and local electric field in the particles. This has been reported in many rare earth doped systems [39-42].When the particles are much smaller than the wavelength of light, radiative transitions probabilities are expressed as a function of an effective index, which is a weighted average between the surrounding medium and bulk crystal indices [39]. In our case, the largest particles have a size comparable to the emission wavelength (λ =611 nm), while the recorded lifetimes are still longer (1.08 ms) than those of a ceramic with 50 µm crystallites (934 µs). On the other hand, the smallest particles have a size of 150 nm which is about λ /4 and thus not negligibly small. Hence, models applying to size << λ [39, 43-45] do not apply directly and were indeed unable to reproduce our results. To explain our observations, we first make the assumption that each particle is spherical (radius R) and surrounded by the medium (air or water) and other identical particles. This is described by the so-called filling factor x, equal to the volume ratio between the particles and the medium [39]. We take x as independent of the particle size for a given calcination temperature. When calcination temperature increases, agglomeration, and therefore x, may increase. A particle is therefore surrounded by a medium of index nM = x nB+(1-x) n, where nB=1.91 is the Y2O3 bulk
refractive index and n=1 for air and 1.33 for water. In a given particle, each Eu3+ ion is placed at the center of a sphere of influence (radius Ri) in which an average index na is calculated by solving the equation [46,47]:
where is the dielectric permittivity corresponding to the refractive index ni. fM and fB =1-fM are the fractions (in
volume) of the sphere of influence occupied by the surrounding medium (index nM) and the particle (index nB). They depend
on Ri, R and the distance of the ion from the center of the particle. For particles of diameter larger than Ri, ions closer to the
surface of the particle are therefore in regions of lower index than those at the center of the particle. This average index na is
then used to compute the lifetime τ of the emitter using the empty cavity model [43]
( )
where τ0 is the emitter lifetime in vacuum. Finally lifetimes for all emitters in the particle are averaged to give a single value
that can be compared to the experimental decay times. First, they were fitted by leaving Ri and x free and we found that Ri
was nearly constant for all data. It was then fixed to Ri = 203 nm and only x was adjustable to generate the curves shown in
Figure 11 (each curve corresponds to a single value of x). A reasonable agreement is observed, both with absolute values and general shape of the experimental data variations. Only the lifetime measured in air for the 150 nm particles calcinated at 1200 °C does not follow the general trend. This could be due to an increased agglomeration. The value of Ri is close to the
one given in Ref. 46 (Ri=150 nm) and x ranges from 0.47 to 0.62, corresponding to moderate packing. As expected, x
increases with calcination temperature and in air compared to water. This analysis shows that a simple model based on an effective refractive index can reproduce the experimental lifetime variations. Together with the single exponential fluorescence decays and their lack of temperature dependence, we conclude that the defects causing additional inhomogeneous broadening of the 7F0 5D0 transition in some particles have a negligible effect on the 5D0 level excited
state dynamics.
4. CONCLUSIONS
Monodispersed particles of 0.3% Eu3+:Y2O3 have been synthesized with sizes between 150 and 540 nm. Varying the
calcination temperature of the amorphous precursor from 900 to 1200 °C allowed us to independently vary the crystallite size from 40-60 nm to 90-120 nm. The inhomogeneous linewidths of Eu3+7F0 5D0 transition were measured by high-resolution
laser spectroscopy and vary between 38 and 12 GHz, in the range of single crystals and transparent ceramics at the same Eu3+ concentration. Whereas the particles calcinated at 1200 °C show an inhomogeneous broadening close to single crystals even for size as low as 150 nm, other particles exhibit an additional broadening independent on particle or crystallite size. We attribute it to point defects, like oxygen vacancies, the concentration of which is reduced by increasing calcination temperature. A nearly linear correlation was also observed in the particles between optical and Raman linewidths, suggesting a common origin. Finally, the influence of these defects on the 5D0 excited state lifetime was investigated. Although we
observed a strong dependence of lifetimes as a function of particle size, experimental data could be reproduced by a model based on an effective refractive index. We conclude that these defects have a negligible effect on dynamical properties of 5Do
population. Further studies, based on photon echoes and time resolved spectra hole burning, are in progress to evaluate their effects on coherence lifetimes of the 7F0 5D0transition.
ACKNOWLEDGMENT
We thank Dr. John Bartholomew and Dr. Nathalie Kunkel for useful comments. The research leading to these results has received funding from the European Union’s Seventh Framework Programme FP7/2007-2013/ under REA grant agreements No. 287252 (CIPRIS, People Programme-Marie Curie Actions) and ANR project RAMACO (12-BS08-0015-01).
REFERENCES
[1] S. Gai, C. Li, P. Yang, J. Lin, Chem. Rev. 114 (2014) 2343-2389. [2] H. A. Höppe, Angew., Chem. Int. Ed. 48 (2009) 3572-3582. [3] G. K. Das, T. T. Y. Tan, J. Phys. Chem. C 112 (2008) 11211-11217.
[4] Q. Dai, M. E. Foley, C. J. Breshike, A. Lita, G. F. Strouse, J. Am. Chem. Soc. 133 (2011) 15475-15486. [5] J. Silver, R. Withnall, A. Lipman, T. G. Ireland, G. R. Fern, J. Lumin. 122-123 (2007) 562-566.
[6] A. Benayas, B. del Rosa, A. Perez-Delgado, K. Santacruz-Gomez, D. Jaque, G. A. Hirata, F. Vetrone, Adv. Optical
Mater. 3 (2015) 687-694.
[7] A. Perrot, P. Goldner,D. Giaume, M. Lovrić, C. Andriamiadamanana; R. R. Goncalves, A. Ferrier, Phys. Rev. Lett. 111 (2013) 203601.
[8] T. Utikal, E. Eichhammer, L. Petersen, A. Renn, S. Götzinger, V. Sandoghdar, Nat. Commun. 5 (2014) 3627.
[9] R. Kolesov, K. Xia, R. Reuter, R. Stöhr, A. Zappe, J. Meijer, P. R. Hemmer, J. Wrachtrup, Nat. Commun. 3 (2012) 1029.
[10] P. Goldner, A. Ferrier, O. Guillot-Noël, In Handbook on the Physics and Chemistry of Rare Earths Volume 46; J.-C. G. Bünzli,; V. K.Pecharsky (Eds.), Elsevier, Amsterdam, 2015, pp. 1-78.
[11] F. Bussières, C. Clausen, A. Tiranov, B. Korzh, V. B. Verma, S. W. Nam, F. Marsili, A. Ferrier, P. Goldner, H. Herrmann, C. Silberhorn, W. Sohler, M. Afzelius, N. Gisin, Nat. Photonics 8 (2014) 775-778.
[12] M. P. Hedges, J. J. Longdell, Y. Li, M. J. Sellars, Nature 465 (2010) 1052-1056. [13] G. Heinze, C. Hubrich, T. Halfmann, Phys. Rev. Lett. 111 (2013) 033601. [14] M. Lovrić, D. Suter, A. Ferrier, P. Goldner, Phys. Rev. Lett. 111 (2013) 020503.
[15] G. Wolfowicz, H. Maier-Flaig, R. Marino, A. Ferrier, H. Vezin, J. J. L. Morton, P. Goldner, Phys. Rev. Lett. 114 (2015) 170503.
[16] P. Siyushev, K. Xia, R. Reuter, M. Jamali, N. Zhao, N. Yang, C. Duan, N. Kukharchyk, A. D. Wieck, R. Kolesov, J. Wrachtrup, Nat. Commun. 5 (2014) 3895.
[17] W. Wang, W. Widiyastuti, T. Ogi, I. W. Lenggoro, K. Okuyama, Chem. Mater. 19 (2007) 1723-1730. [18] J. Li, X. Li, X. Sun, T. Ishigaki, J. Phys. Chem. C 112 (2008) 11707-11716.
[19] J. A. Dorman, J. H. Choi, G. Kuzmanich, J. P. Chang, J. Phys. Chem. C 116 (2012) 10333-10340.
[20] R. H. Krishna, B. M. Nagabhushana, H. Nagabhushana, N. S. Murthy, S. C. Sharma, C. Shivakumara, R. P. S. Chakradhar, J. Phys. Chem. C. 117 (2013) 1915-1924.
[21] G. P. Flinn, K. W. Jang, J. Ganem, M. L. Jones, R. S. Meltzer, Phys. Rev. B 49 (1994) 5821-5827. [22] A. M. Stoneham, Rev. Mod. Phys. 41 (1969) 82.
[23] B. Aiken, W. P. Hsu, E. Matijević, J. Am. Ceram. Soc. 71 (1988) 845-853. [24] D. Sordelet, M. Akinc, J. Colloid Interf. Sci. 122 (1988) 47-59.
[25] H. M. Rietveld, J. Appl. Cryst. 2 (1969) 65-71.
[26] J. Rodriguez-Carvajal , T. Roisnel, Mater. Sci. Forum 443 (2004) 123-126. [27] H. Giesche, E. Matijević, J. Mater. Res. 9 (1994) 436-450.
[28] S. Sohn, Y. Kwon, Y. Kim, D. Kim, Powder Technol. 142 (2004) 136-153.
[29] H. S. Yang, K. S. Hong, S. P. Feofilov, B. M. Tissue, R. S. Meltzer, W. M. Dennis, J. Lumin. 83-84 (1999) 139-145. [30] G. P. Flinn, K. W. Jang, J. Ganem, M. L. Jones, R. S. Meltzer, Phys. Rev. B 49 (1994) 5821-5827.
[31] M. J. Sellars, R. S. Meltzer, P. T. H. Fisk, N. B. Manson, J. Opt. Soc. Am. B 11 (1994) 1468-1473.
[32] A. Ferrier, C. W. Thiel, B. Tumino, M. O. Ramirez, L. E. Bausá, R. L. Cone, A. Ikessue and Ph. Goldner, Phys. Rev. B
87 (2013) 041102.
[33] R. D. Shannon, C. T. Prewitt, Acta Crystallogr B 25 (1969) 925-946. [34] P. Parayanthal, F. H. Pollak, Phys. Rev. Lett. 52 (1984) 1822-1825.
[35] J. E. Spanier, R. D. Robinson, F. Zhang, S.-W. Chan, I. P. Herman, Phys. Rev. B 64 (2001) 245407. [36] Y. Repelin, C. Proust, E. Husson, J. M. Beny, J. Solid State Chem. 118 (1995) 163-169.
[37] V. V. Osipov, V. I. Solomonov, A. V. Spirina, E. G. Vovkotrub, V. N. Strekalovskii, Opt. Spectrosc. 116 (2014) 946-955.
[38] I. Kosacki, T. Suzuki, H. U. Anderson, P. Colomban, Solid State Ionics 149 (2002) 99-105. [39] R. S. Meltzer, S. P. Feofilov, B. M. Tissue, H. B. Yuan, Phys. Rev. B. 60 (1999) R14012-14015. [40] H. Christensen, D. Gabbe, H. Jenssen, Phys. Rev. B 25 (1982) 1467-1473.
[41] H. Schniepp, V. Sandoghdar, Phys. Rev. Lett. 89 (2002) 257403.
[42] J. C. Boyer, F. Vetrone, J. A. Capobianco, A. Speghini, M. Bettinelli, J. Phys. Chem. B 108 (2004) 20137-20143. [43] C.-K. Duan, M. F. Reid, Z. Wang, Phys. Lett. A 343 (2005) 474-480.
[44] P. de Vries A. Lagendijk, Phys. Rev. Lett. 81 (1998) 1381-1384.
[45] K. K. Pukhov, T. T. Basiev, Yu. V. Orlovskii, JETP Lett. 88 (2008) 12-18.
[46] V. LeBihan, A. Pillonnet, D. Amans, G. Ledoux, O. Marty, C. Dujardin, Phys. Rev. B 78 (2008) 113405. [47] D. E. Aspnes, Am. J. Phys. 50 (1982) 704–709.
FIGURE CAPTIONS
Fig. 1. TEM images and histograms with log normal fit (red line) of 0.3 at. % Eu3+: Y(OH)CO3 products obtained using urea
concentrations from 0.3 to 3.0 M. The scale bars (1 µm) are identical in all images.
Fig. 2. TEM images of 0.3 at. % Eu3+: Y2O3 particles obtained using 0.3 M of urea and calcinated at (a) 900, (b) 1000, (c)
1100, (d) 1200 °C, and using 3.0 M of urea and calcinated at (e) 900, (f) 1000, (g) 1100, (h) 1200°C during 6 h.
Fig. 3. Average particle size as a function of calcination temperature for 0.3 at. % Eu3+: Y2O3 particles obtained by using 0.3
and 3.0 M of urea. The error bars are based on the standard deviation of size distributions.
Fig. 4. XRD patterns of 0.3 at. % Eu3+: Y2O3 particles calcinated at 900, 1000, 1100 and 1200°C and synthesized using 0.5
M of urea.
Fig. 5. Crystallite size as a function of temperature of calcination for 0.3 at. % Eu3+: Y2O3 particles synthesized with varying
urea concentrations. Average particle sizes are indicated in the legend.
Fig. 6. 7F05D0 transition lineshapes obtained by monitoring 5D0-7F2 emission at 12 K in 0.3 at. % Eu3+: Y2O3. Particles
synthesized with (a) 0.3 and (b) 3.0 M of urea, and calcinated at temperatures from 900 to 1200°C. Maxima of all spectra are set at 0 frequency. Inset: Lorentzian fit (dashed line) of the spectrum of the 3.0 M particles calcinated at 1200 °C.
Fig. 7. Inhomogeneous linewidth inh of the 7F05D0 transition as a function of crystallite size for Eu3+: Y2O3 particles
synthesized with varying urea concentrations. Dashed line: inh in a 0.3% Eu3+:Y2O3 single crystal fiber [30].
Fig. 8. Raman spectra of 0.3 at. % Eu3+: Y2O3 particles prepared using 3.0 M of urea and calcinated under different
temperatures, and of a 0.5% Eu3+:Y2O3 transparent ceramic. Asterisks: Eu3+ fluorescence.
Fig. 9. Linewidth of the main Raman line at 377 nm as a function of calcination temperature of 0.3 at. % Eu3+: Y2O3 particles
Fig. 10. Linewidth of the main Raman line as a function of the 7F0 5D0 inhomogeneous linewidth in 0.3% Eu3+: Y2O3
synthesized using varying urea concentrations and calcinated at different temperatures.
Fig. 11. Lifetimes of the 5D0 level measured in air (a) and water (b) as a function of particle size in 0.3% Eu3+: Y2O3
synthesized using varying urea concentrations and calcinated at different temperatures. Solid lines: fit using an effective index based model; x: filling factor (see text)