HAL Id: hal-01784069
https://hal.archives-ouvertes.fr/hal-01784069
Submitted on 23 Jun 2018
HAL is a multi-disciplinary open access
archive for the deposit and dissemination of
sci-entific research documents, whether they are
pub-lished or not. The documents may come from
teaching and research institutions in France or
abroad, or from public or private research centers.
L’archive ouverte pluridisciplinaire HAL, est
destinée au dépôt et à la diffusion de documents
scientifiques de niveau recherche, publiés ou non,
émanant des établissements d’enseignement et de
recherche français ou étrangers, des laboratoires
publics ou privés.
tic wave velocity evolution of shales deformed under uppermost crustal conditions.
Journal of
Geophysical Research : Solid Earth, American Geophysical Union, 2017, 122 (1), pp.130 - 141.
�10.1002/2016JB013540�. �hal-01784069�
Elastic wave velocity evolution of shales deformed under
uppermost crustal conditions
Audrey Bonnelye1,2 , Alexandre Schubnel2, Christian David1 , Pierre Henry3 ,
Yves Guglielmi3 , Claude Gout4, Anne-Laure Fauchille5, and Pierre Dick6
1Département Géosciences et Environnement, Université de Cergy-Pontoise, Cergy-Pontoise, France,2Laboratoire de Géologie, Ecole Normale Supérieure de Paris, Paris, France,3Aix-Marseille University, CEREGE, CNRS, UMR 7330, Marseille, France,4Total, Jean Feger Scientific and Technical Center, Pau, France,5Université de Poitiers, CNRS UMR 7285 IC2MP, ENSIP, Poitiers, France,6Institut de Radioprotection et de Sûreté Nucléaire, Fontenay-aux-Roses, France
Abstract
Conventional triaxial tests were performed on a series of samples of Tournemire shale along different orientations relative to bedding (0∘, 90∘). Experiments were carried out up to failure at increasing confining pressures ranging from 2.5 to 80 MPa, and at strain rates ranging between 3 × 10⁻⁷s−1and3 × 10−5s−1. During each experiment, P and S wave elastic velocities were continuously measured along
many raypaths with different orientations with respect to bedding and maximum compressive stress. This extensive velocity measurement setup allowed us to highlight the presence of plastic mechanisms such as mineral reorientation during deformation. The evolution of elastic anisotropy was quantified using Thomsen’s parameters which were directly inverted from measurement of elastic wave velocity. Brittle failure was preceded by a change in P wave anisotropy, due to both crack growth and mineral reorientation. Anisotropy variations were largest for samples deformed perpendicular to bedding, at the onset of rupture. Anisotropy reversal was observed at the highest confining pressures. For samples deformed parallel to bedding, the P wave anisotropy change is weaker.
1. Introduction
Shales constitute a large portion of rocks in sedimentary basins [Hornby et al., 1994] and are of widespread interest from a fundamental perspective as well as for their practical industrial applications. This is the lithology of most cap rock in the frame of petroleum industry [Gale et al., 2014]. Most of European countries are carrying out extensive research on this material for long-term nuclear waste disposal. Finally, recent fault drilling programs such as the San Andreas Fault Observatory at Depth (SAFOD) [Solum et al., 2006], the Taiwan Chelungpu fault drilling [Hirono et al., 2014], the Wenchuan earthquake fault drilling [Li et al., 2013], or the Nantroseize [Yamaguchi et al., 2011] and J-Fast drilling programs [Chester et al., 2013] showed the important amount of shales in major faults.
Moreover, shales exhibit strong anisotropy due to their complex structure [Horne, 2013; Bandyopadhyay, 2009]: they are sedimentary rocks, which are constituted of a stack of thin layers, of a tight-porosity consti-tuted of nanometric to micrometric cracks and nonspherical pores located between those layers and finally the platelet shape of clay minerals [Ulm and Abousleiman, 2006]. This structure results in anisotropy of elastic parameters at the scale of field observation [Alkhalifah and Rampton, 2001; Le Gonidec et al., 2012] and laboratory scale [Masri et al., 2014; Ikari et al., 2015].
Anisotropy in strength, fluid transport, and elastic properties play a crucial role on fault hydromechanical behavior [Rice, 1992; Faulkner et al., 2006; Healy, 2008]. For all these reasons it is very important to measure, in the laboratory, the evolutions of both the physical and mechanical properties anisotropy under natural pressure and temperature conditions.
In this regard, deforming rocks along several orientations of principal stress with respect to the bedding, while investigating deformation, failure criterion, and elastic wave velocities that are known to be sensitive to crack formation and damage in rocks, may help to understand the micromechanisms involved in shale deformation. Niandou et al. [1997], Dewhurst et al. [2015], and others investigated experimentally anisotropic failure crite-rions on different shales. These data sets have been used to develop numerical models of failure critecrite-rions [Cazacu and Cristescu, 1999; Tien and Kuo, 2001]. On the other hand, Thomsen [1986] gave a theoretical
RESEARCH ARTICLE
10.1002/2016JB013540
This article is a companion to Bonnelye
et al. [2016] doi:10.1002/2016JB013040. Key Points:
• Triaxial tests performed on Tournemire shale
• Evidences of plasticity mechanisms with P wave velocities
• Evidences of anisotropy reversal
Correspondence to:
A. Bonnelye,
bonnelye@geologie.ens.fr
Citation:
Bonnelye, A., A. Schubnel, C. David, P. Henry, Y. Guglielmi, C. Gout, A.-L. Fauchille, and P. Dick (2017), Elastic wave velocity evolution of shales deformed under upper-most crustal conditions, J. Geophys.
Res. Solid Earth, 122, 130–141,
doi:10.1002/2016JB013540.
Received 12 SEP 2016 Accepted 6 NOV 2016
Accepted article online 22 NOV 2016 Published online 7 JAN 2017
©2016. American Geophysical Union. All Rights Reserved.
Figure 1. Convention of angles for both orientations𝜙=0∘, 90∘, S denotes the source and R the receiver, (a)𝜃is the angle between the normal to the bedding⃗nand the raypath, (b)𝜓refers to the angle between the radial stress𝜎3and the raypath in the bedding plane for orientation𝜙=0∘, and (c) example of a prepared sample.
description of elastic properties of shales, which was broadly used to quantify the anisotropy of shales [Cholach and Schmitt, 2006; David et al., 2007]. Zinszner et al. [2002] described the elastic properties of Tourne-mire shale, but those measurements were all made under ambient conditions of pressure. Sarout et al. [2007], Delle Piane et al. [2015], and Kuila et al. [2011] measured the elastic wave velocities evolution under pres-sure with solely one loading orientation investigated. All these studies have outlined a transversely isotropic symmetry in the elastic properties, with the symmetry axis perpendicular to the bedding plane.
The first part of this study, presented in Bonnelye et al. [2017], aims at describing the strength anisotropy of Tournemire shales. In this study, the failure criterion of Tournemire shales was investigated. It shows the influence of bedding orientation on strength and the impact of strain rate and confining pressure increase. The failure always remained brittle, but the mechanical results highlight the importance of plastic mecha-nisms during deformation. Here we present the elastic wave velocity measurements taken during the failure experiment. This part of the study brings some additional insights into the behavior of Tournemire shales under stress and supports most of the previous conclusions as it is known that elastic wave velocity evolution helps to identify and understand the micromechanisms of deformation.
2. Experimental Conditions
2.1. Tournemire Shale Description and Sample Preparation
Tournemire shale comes from the experimental underground laboratory of the Institut de Radioprotection et Sureté Nucléaire (IRSN) located in Tournemire (southern France). The tunnel is located within a Toarcian layer, deposited during marine transgression in a north-south Permian-Mesozoic basin. A detailed description of the geological context can be found in Constantin et al. [2004].
Two boreholes were drilled with the selected orientations, in one of the galleries of the underground laboratory, in a relatively nonfractured selected zone. In the following, the sets of sample will be referred to by their orientation:𝜙 = 0∘, 90∘, where 𝜙 is defined as the angle between the core sample axis and the bedding plane (Figure 1).
The average mineralogical composition of Tournemire shale is detailed in Table 1 [Tremosa et al., 2012]. We note the presence of an important amount of swelling clay minerals such as illite and smectite. Due to their sedimentary nature, the mineralogy percentages can exhibit a wide range of values. The two boreholes used for sampling were close to one another to avoid as much mineralogic disparity as possible.
Tournemire shales present a low porosity, ranging between 6% and 10%, an average density of 2.7 g cm−3,
and a permeability in the range of 10−21m2[Matray et al., 2007]. More details on the sample’s preparation can
be found in Bonnelye et al. [2017].
2.2. Experimental Setup for Velocity Measurements and Methods 2.2.1. Velocity Recording System
Acoustic wave velocities were measured for different polarizations and along several raypaths through a network of 16 ultrasonic transducers (12 P waves, 2 Svwave sensors, and 2 Shwave sensors). The raypaths
Table 1. Range of Mineral Composition of Tournemire Shale [From Tremosa et al., 2012]
Mineral Range Quartz (%) 10 to 20 Calcite (%) 10 to 20 Illite (%) 15 to 25 Kaolinite (%) 15 to 25 Illite/smectite (%) 15 to 20
the raypath, and 𝜓 refers to the angle between the radial stress𝜎3and the raypath in the bedding plane
for experiments performed with the axial stress paral-lel to the bedding plane. Each transducer consists of a piezoelectric lead zirconate titanate ceramic (PI ceramic, PI255, 0.5–1 MHz central frequency) encased into a brass holder. Ceramics are 1 mm thick disk shaped (compres-sional waves) or 1 mm thick square shaped (transverse waves). Acoustic data are sampled at 10 MHz. During the experiment, 200 V pulses of 1 μs rise time are regu-larly sent on each sensor, which then emits an ultrasonic wave recorded by the rest of the network. For each measurement, a stack of 10 signals is performed to increase signal-to-noise ratio. This procedure is performed in cascade, so that each sensor is used once as a source dur-ing what is referenced to as a velocity survey. Travel times are then measured to infer elastic wave velocities, on selected raypaths. The criterions used to select these raypaths are, first, that they have to cross the symmetry axis and, then, that the sensors used have the same polarization. Given the large amount of data to compute, a cross-correlation method was used to measure travel times. It consists in the determination of a reference waveform (chosen among the measurements) which is compared to all of the signals corresponding to the same raypath, in a time window, defined by the minimum and maximum velocities expected in our material. Absolute error bars are estimated of the order of a few percent (5%) for both P and S waves, mainly due to sensor location accuracy, while error between two consecutive measures is below 1%. Velocity surveys were performed with time interval ranging from 5 to 15 min. As most of our experiments were done at a very low strain rate (∼10−7s−1) and experiments and lasted from 1 to 3 days, the evolution of elastic wave velocities
can be considered as measured continuously.
In order to present the P wave velocities, we assumed that the material was homogeneous and transversely isotropic so all the raypaths that have the same angle regarding the bedding are stacked. This assumption will be discussed in the last section.
The system was also able to record acoustic emissions (AE); few—if any—AE were detected during our experiments to be of interest in the scope of this study.
2.2.2. Methods
For the case of weakly anisotropic materials Thomsen [1986] defined five parameters, i.e., simplified formula-tions of wave speeds as a function of elastic moduli in transversely isotropic medium, in order to quantify, at first order, the anisotropy of our samples. However, these formulations have been widely used for anisotropies greater than 20% [David et al., 2007]. These parameters can be directly inverted from velocity measurements according to the equations:
Vp(𝜃) = 𝛼
(
1 +𝛿 sin2(𝜃) cos2(𝜃) + 𝜖 sin4(𝜃)) (1)
Vsv(𝜃) = 𝛽 ( 1 + 𝛼2 𝛽2(𝜖 − 𝛿) sin 2(𝜃) cos2(𝜃) ) (2) Vsh(𝜃) = 𝛽(1 +𝛾 sin2(𝜃)) (3)
where𝛼 denotes the velocity of P waves propagating perpendicular to bedding (i.e., the isotropic plane), 𝛽 the velocity of S wave propagating perpendicular to bedding,𝛿 the anellipticity of the wavefront, and 𝜖 and 𝛾 quantify the anisotropy of P waves and S waves, respectively. For each experiment, these parameters were inverted using a simple least squares method.
For Thomsen’s parameters calculation, the phase velocity with phase angle should be taken into account. Here we measured phase velocities, while𝜃 and 𝜓 correspond to group angle. However, it has been shown by Dewhurst and Siggins [2006] and Johnston and Christensen [1995] that the maximum difference between phase and group velocity should be expected for𝜃 = 45∘ and would imply an error smaller than 5%.
Figure 2.Pwave velocities (m/s) (blue curves, blue axis),Swave velocities (black curves, black axis), and volumetric strain (%) (red curve, red axis) during the hydrostatic loading up to 80 MPa confining pressure. Different blue colors denote the angle𝜃of raypath propagation direction relative to bedding (from light blue for small angles to dark blue for high angles of raypaths).ShandSvraypaths that are both measured for𝜃 =90∘. Measurements are shown for (a) samples cored perpendicular to bedding (𝜙=90∘) and (b) samples cored parallel to bedding (𝜙=0∘).
3. Experimental Results
3.1. Anisotropy Dependence With Confining Pressure
Elastic wave velocities and volumetric strain evolution are shown for two distinct orientations (𝜙 = 90∘ eq perpendicular to bedding and𝜙=0∘ eq parallel to bedding) during a hydrostatic compression up to 80 MPa in Figures 2a and 2b, respectively. Shales being composed of thin layers, samples undergo an anisotropic mechanical compaction under increasing hydrostatic stress, in particular, because of disturbances due to drilling.
For the orientation𝜙=90∘, the unconfined P wave velocities values range from 2700 m s−1to 3700 m s−1for
waves propagating along raypaths with an angle ranging from𝜃 = 90∘ to 𝜃 = 35∘ relative to bedding. All velocities sharply increase with increasing confining pressure, up to a range from 3600 m s−1to 4000 m s−1at
80 MPa. Similar observation can be made for the Svwave velocity propagating along bedding, which increases
slightly from 2050 m s−1at ambient pressure to 2150 m s−1at 80 MPa confining pressure.
For the orientation𝜙 = 0∘, the unconfined P wave velocities values range from 2500 m s−1to 3400 m s−1for
waves propagating along raypaths with an angle ranging from𝜃 = 90∘ to 𝜃 = 0∘ relative to bedding. Again, Pwave velocities increase along all directions, up to 3400 m s−1to 4000 m s−1. S
vwave and Shwave velocities
propagating along bedding show an increase from 1800 m s−1at ambient pressure to 2050 m s−1at 80 MPa
confining pressure.
At first glance, there is a relative good agreement between the two orientations in terms of velocities, which means our Tournemire shale samples are relatively homogeneous in terms of elastic properties. The slight dif-ference between the two orientations at low mean stresses can be explained by an experimental bias. Indeed, at low confining pressures, our system is such that the axial stress has to be maintained 1 or 2 MPa higher than the confining stress in order to avoid potential leaks. This has a strong impact on orientation𝜙 = 90∘, which compacts more when maximum stress is applied perpendicular to bedding. Indeed, volumetric strain is greater for𝜙 = 0∘ (up to 1.6%), meaning these samples compact more. This might be due to a greater sen-sitivity to vibrations during drilling and/or greater water desaturation for this orientation. It has been shown that anisotropic rocks cored along different orientations can exhibit different irreversible deformations even under deviatoric loading [Allirot et al., 1977]. In any case, compaction is correlated with an increase of elastic wave velocities. At low pressure, the increase is sharp, but with increasing pressure, velocities reach a threshold value beyond the pressure of crack closure. At the same time, a decrease of around 50% of the difference between high and low value of P wave velocity is observed. The P wave anisotropy thus decreases with increasing pressure up to a minimum value, probably corresponding to that of the intrinsic anisotropy of the mineral fabric.
Figure 3.Pwave velocities (m/s) (left axis),Swave velocities (right axis), and deviatoric stress (𝜎1− −𝜎3, MPa) (red curve, second left axis) as a function of axial strain (%) for (a–c)𝜙=90∘and (d–f )𝜙=0∘, and for confining pressures of
𝜎3= 5, 20, and 80 MPa. Color scale correspond to the angle𝜃of raypath propagation relative to bedding (from light blue for small angles to dark blue for large angles ofPwave raypaths). For the orientation𝜙 = 0∘, the green color scale denotes raypaths taken horizontally. The black curves are forShandSvraypaths propagating within bedding.
3.2. Velocities During Deviatoric Loading
Elastic wave velocities evolution during deviatoric loading may give insights on the micromechanics of deformation. Elastic wave velocities were measured for all the experiments during deformation, but here, and for the sake of simplicity, we show results for samples deformed at constant confining pressures of 5 and 80 MPa only (Figure 3).
For the samples deformed perpendicular to bedding (𝜙 = 90∘, Figures 3a–3c), elastic wave velocities were measured as a function of their propagation direction relative to bedding. Note that, for this case, the angle𝜃 corresponds to the angle between𝜎1, the maximum compressive stress, and the raypath.
Figure 4. Evolution ofPwave velocity along two different angles𝜃 =90∘(cold colors) and𝜃 =35∘(hot colors) taken for two different pairs of sensors (light and dark blue and red and orange) as a function of time for a sample with𝜙=0∘ and deformed at slow strain rate at a confining pressure of 80 MPa. The black curve denotes the evolution of deviatoric stress (right axis) as a function of time.
At low confining pressure (Pc= 5 MPa, Figure 3a), elastic wave velocities increase with increasing axial strain.
The increase is particularly important for propagation directions with a large angle relative to bedding (from 3300 m s−1to 3700 m s−1for𝜃 =35∘ and 𝜃 =45∘), whereas raypaths with smaller angle relative to bedding are
less impacted by the increasing deviatoric stress (from 3950 m s−1to 4000 m s−1for𝜃 =90∘ and 𝜃 =72∘). Again,
this is due to the compaction—and closure—of the bedding planes. This was confirmed by the mechanical measurements as this orientation is the one that exhibits the largest axial deformation [Bonnelye et al., 2017]. The rate of increase in wave velocities decreases with increasing axial strain, and a sharp wave velocity drop is observed at failure, for all the raypaths.
At intermediate confining pressure (Pc=20 MPa, Figure 3b), the same trend is observed. Velocities measured
along raypaths with a large angle relative to bedding exhibit a larger increase in wave velocities with increas-ing axial strain, due to beddincreas-ing compaction. However, velocities measured along raypaths with a small angle to bedding increase during the first part of the experiment only, and then decrease, probably because cracks start to develop parallel to the maximum compressive stress.
At the highest confining pressure (Pc= 80 MPa, Figure 3c), the previous trend is enhanced: wave velocities
measured along raypaths with a small angle relative to bedding decrease, while those measured along ray-paths with a large angle relative to bedding increase, so that we observed anisotropy reversal before failure which illustrates fully the increasing role of plastic deformation processes with increasing confinement. This was also confirmed by the shape of the axial strain-deviatoric stress curves presented in [Bonnelye et al., 2017]. When looking closer before and after failure (Figures 4a and 4b), we see that the drop of elastic wave velocities occurs along certain raypath only several hours after failure. This effect could not just be explained by the displacement of our sensor array due to fault slip. We also see that up to the time of failure, it seems that the assumption of transverse isotropy in the sample is correct, as the separation between raypaths occurs tardily after stress drop. After failure, depending on the failure localization, raypaths are not all affected the same way: some raypaths decrease strongly (𝜃 = 90∘ path 1 and 𝜃 = 35∘ path 1), whereas the others remain almost constant. In all cases, the drop only occurs several hours after the stress drop (up to 8 h).
For the samples deformed parallel to bedding (𝜙=0∘, Figures 3d–3f), elastic wave velocities were again mea-sured as a function of their propagation direction relative to bedding. Here are displayed measures realized in a vertical plane, perpendicular to bedding plane. Interestingly, elastic wave velocities are not affected in the same way by deformation as for the previous case. it is possible to split the velocity measurements into two groups: the velocities taken in a horizontal plane (in green) and the others (in blue). The trend for the first group is a slight decrease during the whole deformation, whereas for the second group, a slight increase is observed. But for both groups, only a slight decrease occurs at failure, and no dramatic drop. In contrast with what was observed for the orientation𝜙 = 90∘, the initial P wave anisotropy due to bedding is not canceled
Figure 5.Pwave velocities evolution (m/s) for𝜙=0∘andPc=10 MPa, as function of (a) confining pressure, up to 10 MPa, and (b) axial strain (%). The blue color scale corresponds to raypaths propagating within bedding (𝜃 =90∘, as a function their angle𝜓relative to𝜎3(horizontal). Deviatoric stress (𝜎1-𝜎3, MPa) versus axial strain is also displayed (red curve).
or reversed but remains relatively constant. One possible interpretation is that cracks develop preferably in bedding, thus remaining “invisible” to P waves, while the bedding also slightly opens up with increasing strain. This interpretation is supported by elastic wave velocity measurements performed during deformation but this time looking at wave propagating within the bedding plane at𝜃= 90∘ (Figure 5). First, one should note that during hydrostatic loading (Figure 5a), samples exhibit P wave anisotropy, even within the bedding plane, although the latter is assumed to be isotropic. This is probably an artifact due to the combined effects of the compressive shadows and friction due to the upper and bottom pistons, in addition to the fact that we always impose a deviatoric load of a couple MPa on our sample to prevent from leaks.
Second, during deviatoric loading (Figure 5b), the P wave anisotropy in the bedding plane increases, as the velocity of waves propagating along directions close to the minimum compressive stress decreases, while
Figure 6. NormalizedPwave velocities as a function of axial strain for two different strain rates orders: slow (10−7s−1, blue) and fast (10−5s−1, red), for two𝜃angles (90∘in dark colors, 35∘in light colors). Experiments were performed at 80 MPa confining pressure.
the velocity of waves propagating along directions close to the maximum com-pressive stress exhibit variations. As this anisotropy increase is slight and pro-gressive, it could be interpreted as min-eral reorientation. Indeed, it has been shown in Bonnelye et al. [2017] that the radial deformation perpendicular to the bedding plane is larger than the radial deformation in the bedding plane. Yet waves propagating perpendicular to bedding do not exhibit dramatic de-crease, which implies that the “available space” left by bedding opening must be filled, maybe by mineral flow realigning with maximum shear stress. This could help create a weakening plane along which the sample eventually breaks. In any case, for this orientation, the as-sumption of transverse isotropy is clearly invalid.
In order to investigate the influence of strain rate on deformation, additional experiments were performed at an in-creased strain rate of 10−5s−1. In Figure 6
Figure 7. Scanning electron micrographs of the failure plane on sample: (a) deformed perpendicular to bedding (𝜙=90∘) at 20 MPa confining pressure, (b) deformed parallel to bedding (𝜙=0∘) and 80 MPa confining pressure at a strain rate of3 × 10−7s−1, and (c) fault of a sample deformed perpendicular to the bedding at 40 MPa confining pressure.
are presented the comparison of normalized velocities for two angles during the experiment with a confining pressure of 80 MPa, for the orientation𝜙=90∘. We can note that at high confining pressure and fast strain rate, the velocities exhibit an important decrease during the deviatoric loading for the two angles considered (almost 20%). On the contrary, we note that no decrease in velocity is observed for𝜃 =35∘, and less than 10% for𝜃= 90∘ during the slow experiment. In other words, for a given axial strain, the deformation has a larger impact on wave velocities at high strain rate than at low strain rate. This highlights that there must be at least two different mechanisms of deformation with different kinetics. For the slow one, probably plastic mineral reorientation dominates, while during the fast one crack propagation dominates.
3.3. Microstructures
Scanning electron microscope images were taken on deformed samples (Figure 7), in order to gain further insights on the microstructure close to the fracture plane for different orientations. Figure 7a was taken close to the fracture wall of a sample deformed perpendicular to bedding (𝜙=90∘), at 20 MPa confinement. One can see that close to the fracture, the mineral alignment has rotated relative to the initial bedding, to realign along the fracture plane. This process might be in part responsible for the anisotropy reversal observed at the highest confining pressures for this orientation.
The fracture walls of samples deformed parallel to bedding (𝜙=0∘), at 80 MPa confinement, are imaged on Figures 7b, and it is again possible to see a reorientation of clay minerals along the fault.
Finally, we can also note that the structure of the faults are complex and look anastamosed, as in Figure 7c for a𝜙=0∘ sample tested at a confining pressure of 40 MPa.
4. Discussion
As we saw previously, the elastic wave velocities are in the case of𝜙 = 90∘ orientation highly sensitive to the deformation. On the other hand, for the orientation𝜙=0∘ the evolution of damage is not clearly illustrated by velocity evolution. In order to highlight the differences between the two orientations, Thomsen’s parameters were inverted from the velocities presented in the previous section.
Figure 8. Evolution of thePwave velocity during an experiment (orientation𝜙=90∘). (a) Hydrostatic part up to 80 MPa and (b) deviatoric part up to failure. The solid lines correspond to the shape of thePwave velocity evolution calculated from the inverted Thomsen’s parameters using the measured values plotted with symbols. Color scales are related to confining pressure (Figure 8a) and axial strain (Figure 8b).
First, Figure 8a displays the hydrostatic part up to confining pressure 80 MPa and Figure 8b the deviatoric part up to failure. Using the inversion results for parameters𝛼, 𝛿, and 𝜖, we can predict velocities along propagation directions that were not measured experimentally. For instance, we observe during the hydrostatic loading (Figure 8a) the increase of velocity from around 2100 m s−1to 3500 m s−1for waves propagating perpendicular
to bedding, a propagation direction that was not measured for this sample orientation. Our inversion high-lights the general decrease of anisotropy with increasing confining pressure, as well as the evolution of the Pwave velocity pattern as a function of propagation direction. This representation also highlights the rever-sal of anisotropy (Figure 8b) discussed in section 3.2. Note the complex evolution of the P wave anisotropy with propagation direction, in particular, changes in anellipticity𝛿, which induce that the reversal direction, i.e., the propagation direction along which the P wave anisotropy reverses, slowly migrates toward smaller angles with increasing strain.
Second, using both P and S wave velocities, all of the five Thomsen’s parameters were inverted for the hydro-static loading (Figure 9). In contrast with Figure 8, here we mixed data from two different orientations, samples cored parallel (𝜙=0∘) and perpendicular 𝜙=90∘) to bedding (the data used are the ones shown in Figure 2). The advantage of using data from both experiments is that the results shown also take into account, to a certain degree, of possible elastic heterogeneities of the medium. Our parameters measured at the in situ pressure are in good agreement with those calculated by Zinszner et al. [2002], with minimum P and S wave
Figure 9. Evolution of Thomsen’s parameters under hydrostatic loading up to 80 MPa.𝛼,𝛽,𝛿,𝜖, and𝛾were inverted from averagePandSwave velocities values mixing data from both orientations𝜙=90∘and𝜙=0∘.
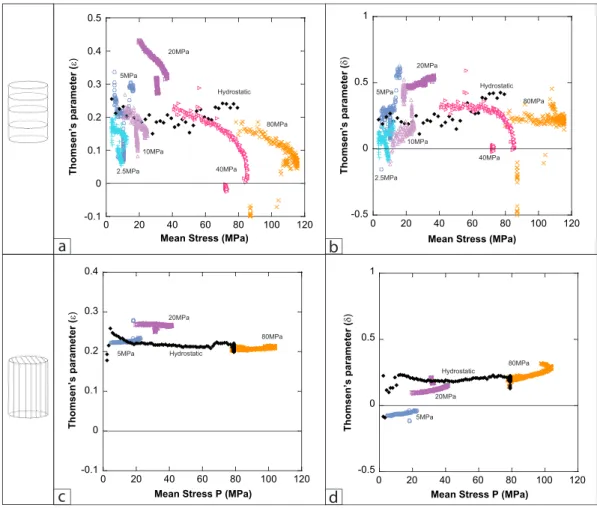
Figure 10. Evolution of Thomsen’sPwave anisotropy parameters (𝛿and𝜖) as a function of mean stress ((𝜎1+2𝜎1)/3) during deformation.𝛿and𝜖were inverted for both hydrostatic compression up to 80 MPa, and deviatoric loadings up to failure, (a and b) for samples deformed perpendicular to bedding (𝜙=90∘) and (d and c) for samples deformed parallel to bedding (𝜙=0∘).
velocities of 3100 m s−1and 2000 m s−1, respectively, and P and S wave anisotropies𝜖 and 𝛾 around 20% and
−5%. Our results demonstrate that, in fact, both anisotropy parameters𝜖 and 𝛾 vary only slightly with con-fining pressure, meaning that they first decrease to the reach a threshold that can be seen as the residual anisotropy. This threshold, which is referred to as the intrinsic anisotropy, corresponds to the limit when cracks are closed, and when the layering and the mineral orientation control the elastic parameters. In fact, one can see that during hydrostatic compression, the evolution of the wave velocity can in fact be well explained by solely increasing the minimum velocities𝛼 and 𝛽.
Finally, P wave-related parameters were inverted during the deviatoric part of loading (Figure 10), for both ori-entations𝜙=0∘ and 𝜙=90∘, in order to quantify the evolution of anisotropy with increasing shear stress and axial strain, for various initial confining pressures. Note that here, in the hydrostatic loading part, the Thomsen’s parameters were calculated separately for each orientation. Figures 10a and 10b combine the results of our inversion of𝜖 and 𝛿, for samples deformed perpendicular to bedding (𝜙=90∘), during the deviatoric loading for all confining pressures and the hydrostatic loading up to 80 MPa (black symbols), as a function of mean stress, i.e., (𝜎1+ 2𝜎3)/3.
At the start of each compression, both the P wave anisotropy (𝜖, Figure 10a) and the anellipticicity (𝛿, Figure 10b) roughly follow the hydrostatic trend; that is, 𝜖 and 𝛿 continuously decrease with increasing confinement, up to plateau values of 0.2 and 0.3, respectively, which can be considered as the intrinsic anisotropy. During triaxial loading, however,𝜖 and 𝛿 decrease below these plateau values, so that deforma-tion of samples perpendicular to bedding generally result in a reducdeforma-tion of both the P wave anisotropy and the anellipticity. In fact, a new anisotropy develops, partly coming from cracks propagating perpendicular
to bedding, which counterbalance the intrinsic anisotropy. However, this effect cannot be solely explained by crack propagation, as above 40 MPa confinement,𝜖 and 𝛿 both decrease to become negative; that is, the anisotropy reverses completely. First thing is to note that only a few percent axial strain are needed for anisotropy reversal. The immediate implication is that the elastic properties of fault cores can be very different from that of the country rocks, even before a fault becomes mature [Faulkner et al., 2010]. Second, the velocity of P waves propagating perpendicular to bedding increases beyond the level of velocities in the bedding plane at the beginning of the experiment (Figure 8b), which implies a certain level of plastic deformation, of mineral rearrangement and plastic flow, and cannot be explained solely by cracks propagating perpendicular to bedding.
Keeping in mind that in the case of samples deformed parallel to bedding (𝜙=0∘), the transverse isotropy is broken (Figures 3 and 5),𝜖 and 𝛿 were nevertheless inverted. In order to make a comparison between the two sets of data. It is interesting to note that the same parameters𝜖 and 𝛿, which previously showed con-tinuous decrease in the case of compression perpendicular to bedding, now show a moderate increase with deformation. This time, anisotropy and anellipticity both increase with increasing shear stress and axial strain. Again, such increase in anisotropy is hard to conceive without some amount of mineral flow realigning with maximum shear stress (see section 3.2). Combining that observation with the one above, the immediate con-sequence is that once the anisotropy has reversed in the core of a fault zone, it will increase, and broaden, as the fault core broadens [Mitchell and Faulkner, 2009].
5. Conclusions
This article highlights the sensitivity of elastic wave velocity to deformation in anisotropic material. We also evidenced the strong time dependence of failure in shales: for fast strain rate, the mechanism of failure seems to be purely fragile with important decrease of elastic wave velocity before and after failure. For slow strain rate the mechanism seem to be more ductile with plastic mechanisms such as mineral reorientation and delayed fracture localization. All these mechanisms are also supporting the conclusions made in Bonnelye et al. [2017]. In terms of anisotropy, we experimentally showed that a rotation of the anisotropy within the fault core is possible. Only a few percent axial strain were needed for anisotropy reversal. The immediate implication is that the elastic properties of fault cores can be very different from the country rock, even before fault becomes mature [Faulkner et al., 2010]. Moreover, this change in anisotropy has an impact on the tensor of elastic properties. It has been shown that a decrease of Young’s modulus and an increase of Poisson ratio with dis-tance to the fault core could have an important impact on the stress orientation in the fault core [Faulkner et al., 2006]. Elastic anisotropy certainly also plays an important role in stress rotations [Healy, 2008], but the possible mechanical role played by anisotropy rotation yet still needs to be modeled. In parallel, shear wave splitting is a common method to determine principal stress directions [Zatsepin and Crampin, 1997; Boness and Zoback, 2006]. However, our results show that anisotropy directions can vary extremely fast between the fault core and the country rock, so that one could questions the reliability of these methods in mapping the stress field close to fault zones.
References
Alkhalifah, T., and D. Rampton (2001), Seismic anisotropy in Trinidad: A new tool for lithology prediction, Leading Edge, 20(4), 420–424. Allirot, D., J. Boehler, and A. Sawczuk (1977), Irreversible deformations of an anisotropic rock under hydrostatic pressure, Int. J. Rock Mech.
Min. Sci. Geomech. Abstr., 14, 77–83, Elsevier.
Bandyopadhyay, K. (2009), Seismic anisotropy: Geological causes and its implications to reservoir geophysics, PhD thesis, Stanford Univ., Stanford, Calif.
Boness, N. L., and M. D. Zoback (2006), Mapping stress and structurally controlled crustal shear velocity anisotropy in California, Geology,
34(10), 825–828.
Bonnelye, A., A. Schubnel, C. David, P. Henry, Y. Guglielmi, C. Gout, A.-L. Fauchille, and P. Dick (2017), Strength anisotropy of shales deformed under uppermost-crustal conditions, J. Geophys. Res. Solid Earth, 122, 110–129, doi:10.1002/2016JB013040.
Cazacu, O., and N. D. Cristescu (1999), A paraboloid failure surface for transversely isotropic materials, Mech. Mater., 31(6), 381–393. Chester, F. M., et al. (2013), Structure and composition of the plate-boundary slip zone for the 2011 Tohoku-Oki earthquake, Science,
342(6163), 1208–1211.
Cholach, P. Y., and D. R. Schmitt (2006), Intrinsic elasticity of a textured transversely isotropic muscovite aggregate: Comparisons to the seismic anisotropy of schists and shales, J. Geophys. Res., 111, B09410, doi:10.1029/2005JB004158.
Constantin, J., J. Peyaud, P. Vergély, M. Pagel, and J. Cabrera (2004), Evolution of the structural fault permeability in argillaceous rocks in a polyphased tectonic context, Phys. Chem. Earth, Parts A/B/C, 29(1), 25–41, doi:10.1016/j.pce.2003.11.001.
David, C., P. Robion, and B. Menendez (2007), Anisotropy of elastic, magnetic and microstructural properties of the Callovo-Oxfordian argillite, Phys. Chem. Earth, Parts A/B/C, 32(1–7), 145–153, doi:10.1016/j.pce.2005.11.003.
Acknowledgments
This research was funded by TOTAL in the frame of the Fluids and Faults project. We are grateful for Damien Deldicque for technical support at ENS, and for all the technical help we received from IRSN and CEREGE during drilling operations. The data produced during our experiments are available from the authors upon request.
doi:10.1029/2008JB005655.
Hirono, T., J. Kameda, H. Kanda, W. Tanikawa, and T. Ishikawa (2014), Mineral assemblage anomalies in the slip zone of the 1999 Taiwan Chi-Chi earthquake: Ultrafine particles preserved only in the latest slip zone: Mineral assemblage anomaly in slip zone, Geophys. Res.
Lett., 41, 3052–3059, doi:10.1002/2014GL059805.
Hornby, B. E., L. M. Schwartz, and J. A. Hudson (1994), Anisotropic effective-medium modeling of the elastic properties of shales, Geophysics,
59(10), 1570–1583.
Horne, S. (2013), A statistical review of mudrock elastic anisotropy: A statistical review of mudrock elastic anisotropy, Geophys. Prospect.,
61(4), 817–826, doi:10.1111/1365-2478.12036.
Ikari, M. J., A. R. Niemeijer, and C. Marone (2015), Experimental investigation of incipient shear failure in foliated rock, J. Struct. Geol., 77, 82–91, doi:10.1016/j.jsg.2015.05.012.
Johnston, J. E., and N. I. Christensen (1995), Seismic anisotropy of shales, J. Geophys. Res., 100, 5991–5991.
Kuila, U., D. Dewhurst, A. Siggins, and M. Raven (2011), Stress anisotropy and velocity anisotropy in low porosity shale, Tectonophysics,
503(1–2), 34–44, doi:10.1016/j.tecto.2010.09.023.
Le Gonidec, Y., A. Schubnel, J. Wassermann, D. Gibert, C. Nussbaum, B. Kergosien, J. Sarout, A. Maineult, and Y. Guéguen (2012), Field-scale acoustic investigation of a damaged anisotropic shale during a gallery excavation, Int. J. Rock Mech. Min. Sci., 51, 136–148, doi:10.1016/j.ijrmms.2012.01.018.
Li, H., et al. (2013), Characteristics of the fault-related rocks, fault zones and the principal slip zone in the Wenchuan Earthquake Fault Scientific Drilling Project Hole-1 (WFSD-1), Tectonophysics, 584, 23–42, doi:10.1016/j.tecto.2012.08.021.
Masri, M., M. Sibai, J. Shao, and M. Mainguy (2014), Experimental investigation of the effect of temperature on the mechanical behavior of Tournemire shale, Int. J. Rock Mech. Min. Sci., 70, 185–191, doi:10.1016/j.ijrmms.2014.05.007.
Matray, J. M., S. Savoye, and J. Cabrera (2007), Desaturation and structure relationships around drifts excavated in the well-compacted Tournemire’s argillite (Aveyron, France), Eng. Geol., 90(1), 1–16.
Mitchell, T., and D. Faulkner (2009), The nature and origin of off-fault damage surrounding strike-slip fault zones with a wide range of displacements: A field study from the Atacama fault system, northern Chile, J. Struct. Geol., 31(8), 802–816, doi:10.1016/j.jsg.2009.05.002. Niandou, H., J. Shao, J. Henry, and D. Fourmaintraux (1997), Laboratory investigation of the mechanical behaviour of Tournemire shale, Int.
J. Rock Mech. Min. Sci., 34(1), 3–16.
Rice, J. R. (1992), Fault Stress States, Pore Pressure Distributions, and the Weakness of the San Andreas Fault, pp. 475–503, Acad. Press, San Diego, Calif., Harvard University, Dept. of Earth and Planet. Sci., Cambridge, Mass.
Sarout, J., L. Molez, Y. Guéguen, and N. Hoteit (2007), Shale dynamic properties and anisotropy under triaxial loading: Experimental and theoretical investigations, Phys. Chem. Chem. Parts A/B/C, 32(8–14), 896–906, doi:10.1016/j.pce.2006.01.007.
Solum, J. G., S. H. Hickman, D. A. Lockner, D. E. Moore, B. A. van der Pluijm, A. M. Schleicher, and J. P. Evans (2006), Mineralogical characterization of protolith and fault rocks from the SAFOD Main Hole, Geophys. Res. Lett., 33, L21314, doi:10.1029/2006GL027285. Thomsen, L. (1986), Weak elastic anisotropy, Geophysics, 51(10), 1954–1966, doi:10.1190/1.1442051.
Tien, Y. M., and M. C. Kuo (2001), A failure criterion for transversely isotropic rocks, Int. J. Rock Mech. Min. Sci., 38(3), 399–412.
Tremosa, J., D. Arcos, J. Matray, F. Bensenouci, E. Gaucher, C. Tournassat, and J. Hadi (2012), Geochemical characterization and modelling of the Toarcian/Domerian porewater at the Tournemire underground research laboratory, Appl. Chim., 27(7), 1417–1431, doi:10.1016/j.apgeochem.2012.01.005.
Ulm, F.-J., and Y. Abousleiman (2006), The nanogranular nature of shale, Acta Geotech., 1(2), 77–88, doi:10.1007/s11440-006-0009-5. Yamaguchi, A., et al. (2011), Progressive illitization in fault gouge caused by seismic slip propagation along a megasplay fault in the Nankai
Trough, Geology, 39(11), 995–998.
Zatsepin, S. V., and S. Crampin (1997), Modelling the compliance of crustal rock: I. Response of shear-wave splitting to differential stress,
Geophys. J. Int., 129(3), 477–494.
Zinszner, B., P. Meynier, J. Cabrera, and P. Volant (2002), Vitesse des ondes ultrasonores, soniques et sismiques dans les argilites du tunnel de Tournemire. Effet de l’anisotropie et de la fracturation naturelle, Oil Gas Sci. Technol., 57(4), 341–353.

![Table 1. Range of Mineral Composition of Tournemire Shale [From Tremosa et al., 2012]](https://thumb-eu.123doks.com/thumbv2/123doknet/13617983.425326/4.918.259.539.190.299/table-range-mineral-composition-tournemire-shale-tremosa-et.webp)