Publisher’s version / Version de l'éditeur:
Vous avez des questions? Nous pouvons vous aider. Pour communiquer directement avec un auteur, consultez la première page de la revue dans laquelle son article a été publié afin de trouver ses coordonnées. Si vous n’arrivez pas à les repérer, communiquez avec nous à PublicationsArchive-ArchivesPublications@nrc-cnrc.gc.ca.
Questions? Contact the NRC Publications Archive team at
PublicationsArchive-ArchivesPublications@nrc-cnrc.gc.ca. If you wish to email the authors directly, please see the first page of the publication for their contact information.
https://publications-cnrc.canada.ca/fra/droits
L’accès à ce site Web et l’utilisation de son contenu sont assujettis aux conditions présentées dans le site LISEZ CES CONDITIONS ATTENTIVEMENT AVANT D’UTILISER CE SITE WEB.
Report (National Research Council of Canada. Division of Building Research), 1954-06-01
READ THESE TERMS AND CONDITIONS CAREFULLY BEFORE USING THIS WEBSITE.
https://nrc-publications.canada.ca/eng/copyright
NRC Publications Archive Record / Notice des Archives des publications du CNRC :
https://nrc-publications.canada.ca/eng/view/object/?id=c6ca0781-3439-4867-8817-65f34c989f06 https://publications-cnrc.canada.ca/fra/voir/objet/?id=c6ca0781-3439-4867-8817-65f34c989f06
Archives des publications du CNRC
For the publisher’s version, please access the DOI link below./ Pour consulter la version de l’éditeur, utilisez le lien DOI ci-dessous.
https://doi.org/10.4224/20337905
Access and use of this website and the material on it are subject to the Terms and Conditions set forth at
Local Climate in the Ottawa Region: 1953 Boyd, D. W.
MMBBセBMBMMMNLLM
-NATIONAL RESEARCH COllliCIL CANADA
LOCAL CLIMATE IN THE OTTAWA REGION: 1953
(A SEQUEL TO OTTAWA MICROCLIMATE: 1952)
by
ANAL YZED
Donald Wo Boyd
Report No0 46
of the
Division of Building Research
ottawa
by D.W. Boyd
INTRODUCTION
Throughout 1953 there were four weather stations in the City of Ottawa that sent reports to the Meteorological
Division of the Department of Transport. Most of this study
as in the study of the records for 1952 reported in DBR Report S 36 by M.K. Thomas is based on their observations but some data are also tabulated from stations which started reporting
late in the year.
These four stations are (1) N.R.C., (2) Rockcliffe,
(3) the Airport, and (4) the Experimental Farm. Notes on their
location and the names used in Meteorological Division publi-cations are given in Appendix A.
During 1953 the Climate Services of the Meteorolo-gical Division computed the average temperatures and
precipi-tations for the 30-year perlod p 1921 to 1950 inclusive, for
all the Canadian stations that were reporting throughout this
period. These 30-year averages are called normals. The only
station in ottawa with normals for this standard period is the Experimental Farm and hence the 1953 observations from the Farm are used in this report to show how 1953 differed from normal0
PART ONE: TEMPERATURE
The four stations mentioned above all read and reset their maximum and minimum thermometers at least twice a day. The recommended times are 0730 and 1930 E.S.T. but deviations
from these times are unavoidable. The minimum temperature
reported for the day is the lower of the two (or the lowest of
the four) readings taken on that calendar day. In other words
it is the lowest temperature in the 24-hour period ending at
the time of the evening observation. The maximum temperature
reported for the day is the higher of the readings taken in the evening and the next morning (or the highest of the four readings
ending with the one at 0730 E.S.T.). Thus it is the highest
temperature in the 24-hour period which does not end until the time of the observation the following morning.
Temperature reports from all the stations at Ottawa (including some which are now closed but whose observations go back as far as 1872) have been searched, and the highest and lowest temperatures ever reported in each month have been
selected. These long-term extremes are tabulated in the first
and last lines of Table I.
The rest of Table I is based entirely on the daily
maximum and minimum temperatures observed in 1953. Five
different values are tabulated for each station and for each
month. The first and last groups, the monthly maximum and
the monthly minimum are, respectively, the highest of the
daily maximum temperatures and the lowest of the daily minimum
temperatures in each month. The second and fourth groups, the
mean daily maximum and the mean daily minimum, are the averages for the month of the daily maximum and minimum temperatures
respectively. The middle group, the mean temperature, is the
average for the month of all the daily maximum and minimum temperatures together.
It will be noticed that no new long-term maximum or
minimum records were established at Ottawa in 1953. This is
to be expected. Since there are 24 such records, and the
reports cover a total of 82 years, we should only expect to establish a new record once in 41 months on the average or
once every three or four years. In February, however, the
previous maximum record was equalled, and in June, July, August, and December the highest maximum temperatures were
only from three to five degrees below the records. Also in
June and July the lowest minimum temperatures were only four or five degrees above the record minimum temperatures.
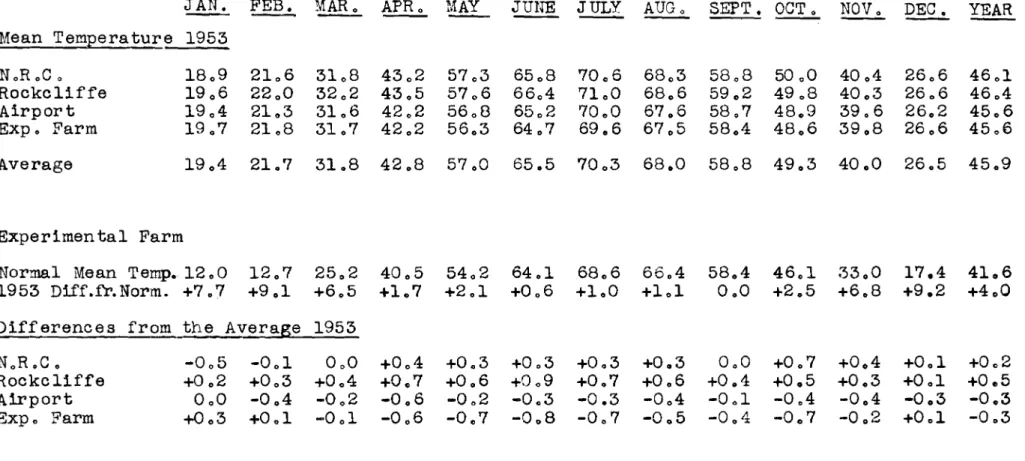
The mean temperatures in 1953 are repeated in Table
II. The normal mean temperatures (based on the standard
and the differences for the Experimental Farm between the mean
temperatures in 1953 and the normal mean temperatures. It will
be noticed that the mean temperature for September was normalo In all the other months the mean temperature was above normal
and in the winter months it was much above normalo February
and December were over 9 degrees above normalo The mean
temperature for the whole year was 400 degrees above normalo
In the 1952 study Mro Thomas referred to that year as being
"very warm"; 1953 was even warmerセ by about a degree and a
halfo
The averages of the mean temperatures for the four stations were found and subtracted from the individual values to show which stations were warmer or colder than the average
for the citYo The Airport and the Experimental Farm were
colder than the average in most months as they had been in
1952, and NoRoCo and Rockcliffe were warmero However, the
differences from the average were all less than 100 degree.
For the year as a whole the differences from the average were only half a degree or less.
In last year's report a detailed study was made of the daily maximum and minimum temperatures at N.RoC. compared
to those at Rockcliffe. On the basis of 1952 temperatures
there seemed to be a strong correlation between the エ・ュー・イ。セウ
at Rockcliffe and the difference in temperature between
Rockcliffe and N.R.C. Adjustments to the Rockcliffe maximum
and minimum temperatures were tabulated which would yield temperatures agreeing very well with the N.RoC. maxima and minima0
Unfortunately the necessary adjustments seem to be different this year, as will be seen from the graphs in Figo
10 Each point plotted in the Figo lA represents the mean
value of about fifteen readings of the maximum temperature
at Rockcliffe in QYUSセ and the mean value of the
correspon-ding differences between the maxima at Rockcliffe and N.R.e.
The horizontal lines at 1, -1 and -2 are the adjustments
obtained from similar data for 19520 Figo lB is a similar
graph for minimum temperatureso
The 1953 data obviously do not fit the 1952
adjust-ments. For 1953 the only adjustment that would appreciably
improve the differences would be -1 for all maximum
tempera-tures at Rockcliffe of 55° or over o The only conclusion we
can draw is that temperatures for several years would have to be compared before satisfactory adjustments could be calculated.
3
-PART TWO: PRECIPITATION
Measurements of rainfall and snowfall were also made
at the same four stations throughout 1953. The precipitation
day is the same as the maximum temperature day. That is, it
begins immediately after the observation taken about 7.30 a.m. and includes all precipitation occurring up to the time of the
observation on the morning following the day for which it is repor ted.
The total precipitations (i.e. the depth of newly
fallen snow divided by tenp plus the actual rainfall) by months
for each of the four stations are shown in Table III.
The normal total precipitations (based on the standard
period 1921 to 1950) for the Experimental Farm are エ。「オャ。エ・、セ
and the 、ゥヲヲ・イ・ョ」・ウセ for the Experimental Farm9 between the
precipitation in 1953 and the normal precipitation. It will be
noticed that the total precipitation in January was very nearly normal and that only three months (March, September, and December)
were above normal. The other months were below normal, three of
them by over an inch and a half. The year as a whole was five
inches below normal. In the previous year (1952) the total
precipitation was above normal due to heavy rains in May, July, and August.
The averages of the total precipitations for the four stations were found and subtracted from the individual values to show which stations were wetter or drier than the average
for the city. N.R.C. was below the average in all months except
August. For the year, N.R.C. was more than two and a half
inches below the average and the other three stations were above. As was noted last year, the precipitation is usually more variable
in the summer than it is in the winter. This was true again in
1953. In August, Rockcliffe had almost an inch more rain than
ottawa Airport. In the winter the differences were mostly less
than half an inch in any month but in January Rockcliffe reported 0072 inches more precipitation than Ottawa Airport.
Table IV lists the rainfall, snowfall, and total pre-cipitation for November and December, 1953, for all the stations
in ottawa and the immediate vicinity that reported precipitation
in these months. Most of these stations started taking
PART THREE: SNOWFALL
Several precipitation stations started reporting in
October 1953 and hence the total snowfall for one winter (but
not for one calendar year) is now available for ten stations
in or near ottawa. These snowfalls are tabulated by months in
Table V.
The normal annual snowfall at the Experimental Farm
based on the standard thirty-year period is 8005 incheso This
winter's total of 720 8 at the Farm was, therefore, 7.7 inches
below normal.
Five of the ten stations had totals very close to
the average of 7305 incheso Rockcliffe, which is very close
to the ottawa rゥカ・イセ and Lemieux Island, which is in the middle
of the River» each had about ten inches more o City View and
Manotick which are several miles back from the ottawa River
each had less than 60 incheso These nine stations seem to fit
into a very simple pattern but it may be just chanceo ottawa
Airport with 99 inches does not fit the pattern at allo
PART FOUR: WIND
Only three of the Ottawa stations reported wind
speeds and directions in 19530 The data in Tables VI and VII
are all based on readings of recording cup anemometers which give the number of miles of wind in each hour and the prevailing direction for the hour.
Table VI shows the percentage of hours and miles and the mean speeds of the winds from each of the eight directions
for N.RoC. and the two airportso Winds from the west and from
the northeast are unexpectedly frequent at NoRoC. as shown by
both the hours and miles of windo This might be due to local
topography but it is not at all obviouso The very infrequent
south winds at Rockcliffe are easily explained by the much
higher ground south of the anemometero At ottawa Airport the
anemometer has an excellent exposure which results in stronger winds and much less variation in wind speed with directiono
Mean wind speeds, their averages, and the differences
from average for each month in 1953 are given in Table VII.
The expected pattern of strong winds in winter and early spring and lighter winds in summer and in autumn followed at each
stationo perhaps the most remarkable point in this table is
the consistency from month to month of the differences from
the averageo N.RoC. is always between 007 and 10 6 below
5
-the Airport from 100 to 2e3 above average. In every month the
Airport wind is at least 11 per cent stronger than either of
the other stations, and except for May, N.R.C. 1s always the
lightest. The same thing was true in 1952. In each of the
ten months for which the data are complete, the Airport had the strongest winds and N.R.C. the lightest.
TABLE I
TEMPERATURES
JAN 0 FEB 0 MAR 0 APR 0 セ JUNE JULY AUG. SEPT .OCT. NOV. セ YEAR Long term Maximum 54 54 80 87 95 98 101 100 102 87 75 61 102 Monthly Maximum 1953 NoR.C 0 47 54 60 61 87 92 95 96 93 79 63 57 96 Rockcl1ffe 47 54 61 63 88 93 96 96 95 80 63 51 96 Airport 45 53 60 63 88 93 94 97 95 78 64 53 97 Expo Farm 47 54 59 62 87 91 94 96 95 79 64 53 96 Mean Daily Maximum 1953
NoRoCo 2603 2807 3905 50 09 68 02 76 03 8001 7807 68 05 59 02 46,,4 32 09 Rockcliffe 28 02 29 00 39 08 51.6 69 04 77 07 8009 79 05 69 04 59 07 46 05 33 02 Airport 27 06 2805 3904 50 03 6800 7604 80 02 78 09 69 02 59 00 46 04 3300 Expo Farm 27 07 2808 39 02 50 01 67 05 7507 79 09 7807 68 09 59 02 46 01 32 08 Mean Temperature 1953
n.n.c ,
18 09 21 06 31 08 43 02 5703 65 08 70 06 68 03 58 08 50.0 4004 2606 46 01 Rockcliffe 19 06 22 00 32 02 4305 57 06 66 04 71 00 68 06 59 02 49 08 40 03 260 6 4604 Airport 1904 2103 31 06 42 02 56 08 6502 70 00 67 06 58 07 48 09 3906 2602 45 06 Expo Farm 19 07 2108 31 07 42 02 56 03 64 07 69 06 67 05 58 04 48 06 39 08 26 06 4506Mean DailX Minimum 1953
NoRoCo 11 05 14 05 2402 3505 46 04 55 02 6100 58 00 4901 4008 34 05 20 03 Rockcliffe 1101 14 09 2406 35 04 45 09 55 00 61 02 57 07 49 00 39 08 3401 2001 Airport 11 02 1401 23 09 3400 4506 5401 5907 56 02 48 02 38 08 32 09 19.5 Expo Farm 11 07 1407 24 02 3404 4500 5307 5904 5603 47 09 37 09 3305 20 04 Monthly Minimum 1953 NoR oC 0 -9 -10 -3 26 34 40 48 47 32 26 22 -8 -10 Rockcliffe -11 -9 -2 25 34 40 47 46 32 27 21 -11 -11 Airport -10 -10 -2 23 33 38 47 42 31 25 17 -9 =10 Expo Farm -20 =10 0 25 33 42 42 42 30 24 17 -8 -20 Long-term Minimum -34 -35 -34 -5 21 33 38 34 24 9 -23 -38 -38
TABLE II MEAN TEMPERATURES
JAN. FEB.
-
MAR
0 APR 0 MAY JUNE- -
JULY AUG 0 SEPT. OCT 0 NOV 0 セ YEARMean t・セー・イ。エオイ・ 1953 NoR oC 0 18 09 21 06 31 08 43 02 5703 6508 70 06 680 3 58 08 50 00 40 04 2606 4601 Rockc1iffe 19 06 22 00 32 02 43 05 57 06 6604 7100 68 06 59 02 49 08 4003 2606 4604 Airport 19 04 21 03 31 06 42 02 56 08 6502 7000 67 06 58 07 48 09 39.6 26 02 4506 Exp. Farm 19 07 21.8 3107 42 02 5603 6407 69.6 67 05 5804 48 06 39 08 26 06 4506 Average 19 04 2107 31.8 42 08 57.0 6505 7003 68.0 58.8 49 03 4000 2605 4509 Experimental Farm
Normal Mean Temp. 1200 12 07 25 02 40 05 54 02 6401 6806 66.4 58 04 46 01 330 0 17.4 410 6 1953 D1ff.fr.Norm. +7 07 +9 01 +6 05 +1.7 +2 01 +006 +100 +101 0.0 +2.5 +6.8 +9.2 +400
Differences from エセ・ Average 1953
NoR.C. -005 -001 000 +0 04 +003 +003 +003 +003 0 00 +007 +0 04 +001 +002 Rockc1iffe +002 +0 03 +004 +0.7 +0 06 +009 +007 +0.6 +004 +0.5 +0.3 +001 +0.5 Airport 000 -0.4 -0 02 -0.6 -002 -003 -0.3 -004 -0,,1 -0.4 -0.4 -003 -0 03 Expo Farm +003 +001 -0 01 -0 06 -0 07 -0,,8 -007 -005 -0 04 -00 7 -002 +001 -003
TOTAL PRECIPITATION
JAN. FEB.
- -
MAR. APRo MAY JUNE JULY AUG. SEPT. OCT. NOV. DEC. YEAR Total Precipitation 1953 NoR.C. 2 071 0 087 3 095 1 09 9 1053 2027 1.25 2.94 3 082 0097 0 089 3.41 26 060 Rockc1iffe 3015 1008 4055 2028 1077 2.60 2 002 3049 4 018 1.10 1025 3 069 31016 Airport 2 043 0 092 4019. 2 063 2 003 2 060 1 095 2 051 4.12 1 021 10 2 9 3 050 29 0 3 8 Expo Farm 2 070 0 063 4011 2 031 2001 2070 1092 2075 4036 1038 1019 3085 29 091 Average 2 075 0 088 4 020 2030 1080 2 054 1078 2 092 4.12 1.17 1016 3 061 29 026 Experimental Farm Normal pcpno 2 067 2 020 2081 2062 2084 3043 3053 2 097 3012 2 070 2 097 3003 340 8 9 1953 Diff 0 fr 0 +0003 セQPUW +1030 -0031 -0083 -0073 -1 0 6 1 -0022 +1 024 -1032 -1078 +0.82 -4 098 NormalDifferences from the aカ・イ。セ 1953
x.n,c ,
-004 -001 -025 -031 -030 -027 -.53 +002 -030 -020 -027 -020 -2066Rockc1iffe +040 +020 +035 -002 -006 +006 +024 +057 +.06 -007 +009 +008 +1 090
Airport -032 +004 -001 +033 +020 +006 +017 -041 000 +004 +013 -011 +0 012
Expo Farm -.05 -025 -009 +001 +018 +016 +014 -017 +024 +021 +003 +024 +0065
TABLE IV 9 -PRECIPITATION
November December
Rain Snow Total Rain Snow Total
N.R.C. 0.79 1.0 0 089 1 093 14.8 3041 Rockcliffe 0095 3 00 1 025 2.37 1302 3 069 Airport 1.05 2 04 1029 2 042 10 08 3050 Expo Farm 1007 102 1019 2 060 12 05 3085 Lemieux Island 0093 0 05 0098 1089 7 08 2.67 Hog's Back 0.99 1 02 loll 1089 703 2.62 Woodroffe 0088 0.8 0096 2.66 905 3 061 Billings Bridge 1.10 007 1.17 2 000 7.0 2070 Keyworth 1.02 100 1.12 2 003 1001 3004 City View 1001 0 09 1010 2 019 12 00 3039 Manotick 0091 0 03 0 094 1 091 7 09 2070 Gatineau 2 058 120 3 3081 orleans 2034 1105 3049 Average 0097 1 02 1.09 2022 1005 3027 TABLE V SNOW 1953 1954
Nov. Dec. Jan.
-
Feb. Mar. Apro Winter Total NoR oC 0 1.0 14.8 19.5 1801 15 00 0 07 6901 Rockc1iffe 3 00 13.2 23.9 2503 1609 0.6 82 09 Airport 204 10.8 25 04 31 00 250 3 308 98 07 Expo Farm 1 02 12 05 2304 22 02 13 03 002 72 08 HogI s Back 10 2 7 03 21 09 220 6 2000 T 730 0 Lemieux Island 0 05 708 26.5 25 03 17 02 6 00 83 03 City View 009 12 00 1703 19 00 805 005 58 02 Gatineau *1 02 12 03 1908 22.8 1305 003 69.9 Manotick 0 03 7 09 14 09 2101 9 03 1 00 54 05 Orleans iH02 11 05 3405 19 04 601 002 72 09 Average 103 1100 2207 2207 1405 103 73 05-Il- Gatineau and Orleans were not open in November and hence
WIND DIRECTIONS
N NE E SE S SW W NW Calm
Percentage of Hours of Wind from each Direction in 1953
N.RoC • 10 12 10 5 12 10 26 15
*
Rockcliffe 11 9 16 5 8 18 20 11 2
Airport 8 7 14 5 15 16 21 13 1
Average 10 10 13 5 12 14 22 13 1
Percentage of Miles of Wind from each Direction in 1953
NoR oC0 7 11 8 3 10 11 31 19
Rockc1iffe 12 7 12 4 6 20 24 15
Airport 7 6 16 4 15 17 21 14
Average 8 8 12 4 11 16 25 16
Mean Wind Speed from each Direction in 1953
NoRoCo 4 09 6 05 507 5,,2 6 01 807 805 9 07 Rockc1iffe 80 6 5 07 6,,4 5 07 5.8 8 08 906 1104 Airport 80 0 8 01 1103 9 04 9,,7 1008 1001 10 03 Average 70 2 6 08 708 6 08 7 02 9 04 9 04 1005
'*
Less thant
TABLE VII WIND SPEEDSJano Febo Mar 0 Apr. May June July Augo Sept. Oct. Novo Dec. Year Mean Wind Speed 1953
NoR oC 0 7 06 80 9 800 900 7 00 70 3 6 07 6 02 607 5 06 7.0 8.2 7 03
Rockc1iffe 70 7 90 6 808 9 06 6 08 8 02 7 03 7 00 7 01 6 03 7 05 9 05 800 Airport 1101 1105 10 06 10 08 9.3 9 03 9 01 803 905 8 00 10 01 11 06 9 09 Average 808 1000 9 01 9 08 7 07 803 707 7 02 708 6 06 8 02 9 08 804
Differences from the aカ・イセァ・ 1953
NoR oC • -1 02 -101 -101 -008 -0.7 -loa -10 0 -10 0 -101 -10 0 -1 02 -10 6 -101
Rockc11ffe -1 01 -0 04 -003 -0.2 -0 .. 9 -0.1 -004 -002 -0,,7 -003 -0 .. 7 -003 -004 Airport 2 03 1 ..5 105' 1o0 1 06 1 00 1.4 1 01 1 07 104 1.9 1.8 1 05
'}o
70 30 40 50 60 70 80
MAXIMUM TE..MPE...RATURL AT ROCKC.LIFFE.. IN of
I
-I
I
1 -I 0 01
-
--I
0 0 0 0I
°1
0 0--
o
0 I) 0 IS' 0I
0 0 -0 0o
f t -II
I
-
-
t
--I
I
) t ' \-0·.5
1·0-1'5
- 2·0
-'2'5
10- I-a
NRC MINUS 0 ReK.- 0·5
r
·00·5
NRC MINUS 0ReK
- 0·.5
- t·O- 1'.5
- '2·0I
0I
0 --I - I 0I
r
-0 II
1
- L-01 0 0-0
-I
I
0 1 0 0 0 II
-I
{ -0I
0 0 0 I -I -0 Ib
0 0--1-1
セ I-1
-1
I
f--- - I-I
-L
I
I
-II
1
---+--+--I I I -I I-l
-10o
10 '20 30 40 .50 MINIMUM TE..MPE-RATURf?.... AT rockcセiffeNN 1N of''0
7°
APPENDIX A
Weather stations within the limits of a city are
generaLly given the name of the city, followed by some other
name, in brackets, to indicate the section of the city in
which the station 1s located 0 In this report the name "ottawa"
and the brackets have been dropped, but the full names are used in the following Ldst , The name "Airport" is abbreviated to "A" in Meteorological Division publications.
ottawa (NoR.Co) is at the Montreal Road Laboratories of the
National Research Council, at an elevation of 332 feet. The
observations are taken twice a day by personnel of the Division of Building Research.
Rockcliffe (Airport) is not far from the N.RoCo station but it
is more tfian 100 feet lower. The elevation is only 204 feeta
Weather observations are taken every hour by personnel of the RoC.AoFo
ottawa (Airport) is at イセャ。ョ、ウ at an elevation of 357 feet.
Weather observations are taken every hour by personnel of the Meteorological Division of the Department of Transport.
ottawa (Experimental Farm) is at the Central Experimental Farm
at an elevation of 260 feet. The observations are taken twice
a day by personnel of the Department of Agriculture.
ottawa (Billings Bridge) is at the home of Mr o B. Cornwall on the Metcalfe Road.
ottawa (Hog's Back) is at the home of Dr o AoRoG. Emslie near Riverside Drive.
ottawa (Keyworth) is at the home of Mr. J.K. Fraser near Island Park Drive.
ottawa (Lemieux Island) is at the ottawa Water purification and
Pumping Station. The observations are taken by personnel of
the City Water Works Department.
ottawa (Woodroffe) is at the home of Mro FoW. Baker near Carling Avenu e.
-City View is at Borden's Ottawa Dairy Farm on the Merivale Roado Gatineau is at the mills of the Canadian International Paper Company at Gatineau, Quebeco
Manotick is at the home of Dr. N.L. Nicholson on Long Island. Orleans (Veho Prvg. Gnd.) is at the Proving Ground of the Vehicle Development Branch of the Department of National Defence near the Montreal Roado
OTT A\V
ARE.
GION PRE.' I
PIT
AT ION
sr
AT
ION
S
• PRE.CtPITATION
ONLY
• P Re.cI pIT AT ION
f
T E.MPE.RATU
R,E-I-NRc.. '2 - ROCKCL! HE.-.3 - THE. AI セport 4 - E.Xp. FARM .5 - 51L.LINH 8RllibE. " - HOC.S BACK 7 • KE.YWORT H 8 - LE.MIE.UX 15. セ . \vOODR.°FFE.-IO·CITY'III:..\v' 11 • "'ATINE.AU 1'2 - MANOT1CK 13 •ORL.E.AN 5