HAL Id: hal-00298309
https://hal.archives-ouvertes.fr/hal-00298309
Submitted on 20 Mar 2007HAL is a multi-disciplinary open access
archive for the deposit and dissemination of sci-entific research documents, whether they are pub-lished or not. The documents may come from teaching and research institutions in France or abroad, or from public or private research centers.
L’archive ouverte pluridisciplinaire HAL, est destinée au dépôt et à la diffusion de documents scientifiques de niveau recherche, publiés ou non, émanant des établissements d’enseignement et de recherche français ou étrangers, des laboratoires publics ou privés.
Repeated temperature logs from the sites of the Czech,
Slovenian and Portuguese borehole climate stations
J. Safanda, D. Rajver, A. Correia, P. D?de?ek
To cite this version:
J. Safanda, D. Rajver, A. Correia, P. D?de?ek. Repeated temperature logs from the sites of the Czech, Slovenian and Portuguese borehole climate stations. Climate of the Past Discussions, European Geosciences Union (EGU), 2007, 3 (2), pp.631-653. �hal-00298309�
CPD
3, 631–653, 2007 Repeated temperature logs from Czechia, Slovenia and Portugal J. ˇSafanda et al. Title Page Abstract Introduction Conclusions References Tables Figures ◭ ◮ ◭ ◮ Back CloseFull Screen / Esc
Printer-friendly Version Interactive Discussion
Clim. Past Discuss., 3, 631–653, 2007 www.clim-past-discuss.net/3/631/2007/ © Author(s) 2007. This work is licensed under a Creative Commons License.
Climate of the Past Discussions
Climate of the Past Discussions is the access reviewed discussion forum of Climate of the Past
Repeated temperature logs from the sites
of the Czech, Slovenian and Portuguese
borehole climate stations
J. ˇSafanda1, D. Rajver2, A. Correia3, and P. D ˇede ˇcek1
1
Geophysical Institute Prague, Boˇcn´ı II/1401, 141 31 Praha, Czech Republic
2
Geological Survey of Slovenia, Dimiˇceva 14, Ljubljana, Slovenia
3
Department of Physics, University of Evora, 7000 Evora, Portugal
Received: 5 March 2007 – Accepted: 6 March 2007 – Published: 20 March 2007 Correspondence to: J. ˇSafanda (jsa@ig.cas.cz)
CPD
3, 631–653, 2007 Repeated temperature logs from Czechia, Slovenia and Portugal J. ˇSafanda et al. Title Page Abstract Introduction Conclusions References Tables Figures ◭ ◮ ◭ ◮ Back CloseFull Screen / Esc
Printer-friendly Version Interactive Discussion
Abstract
Two borehole climate stations were established in Slovenia and Portugal within a joint Czech-Slovenian-Portuguese project in the years 2003–2005. They completed the older Czech station, which has been operating since the year 1994. We report here on the repeated temperature logs carried out within 6 boreholes at the sites of the stations
5
and their surroundings within a time span of 8–20 years (1985–2005). The repeated logs revealed subsurface warming in all the boreholes amounting to 0.2–0.6◦C below the depth of the annual run at 20 m. The depth of the Czech borehole (140 m) and the Portuguese borehole (180 m) was sufficient enough for a reconstruction of the ground surface temperature (GST) history of the last 150–200 years and their comparison with
10
the surface air temperature (SAT) series measured in Prague (since 1771) and Lisbon (1856), respectively. The reconstructed histories reproduce reasonably well the ampli-tude of the recent warming, 1–1.5◦C above the long-term mean. The depth of all four Slovenian boreholes, 100 m, did not allow the inversion, but it was possible to apply it to a deep borehole 5 km apart from the Slovenian station. The obtained GST history
15
was compared with SAT series from Ljubljana (since 1851). Alternatively, a compat-ibility of the observed temporal changes of subsurface temperature with surface air temperature series measured in Prague, Ljubljana and Lisbon was checked by com-paring differences of the repeated logs with the synthetic ones. These were calculated by using the SAT series as a forcing function at a surface of transient geothermal
mod-20
els of the borehole sites. A degree of agreement varies from very well to rather poor, probably depending on unaccounted site specific factors, which are to be specified by a long-term temperature monitoring at the established stations.
1 Introduction
The method of a reconstruction of the ground surface temperature (GST) histories from
25
CPD
3, 631–653, 2007 Repeated temperature logs from Czechia, Slovenia and Portugal J. ˇSafanda et al. Title Page Abstract Introduction Conclusions References Tables Figures ◭ ◮ ◭ ◮ Back CloseFull Screen / Esc
Printer-friendly Version Interactive Discussion
as one of the independent and well physically justified ways how to obtain information about the past climate on the scale of hundreds to thousands of years (Shen and Beck, 1991; Huang et al., 2000; Harris and Chapman, 2001; Pollack and Smerdon, 2004; Ma-jorowicz et al. 2004). The climatic interpretation of the GST histories obtained by the method in terms of the surface air temperature (SAT) history is based on the
assump-5
tion that the GST variations track the SAT ones on the decadal to centennial and longer scales. One of the ways how to testify a validity of this assumption, are empirical stud-ies at site-specific locations monitoring air, ground and possibly bedrock temperature time series combined with other meteorological variables observed either at the loca-tion or at a near-by meteorological staloca-tion over multiyear time intervals (for a review
10
see Smerdon et al., 2004, 2006). Such observatories are sometimes referred to as geothermal climate change observatories (Putnam and Chapman, 1996) or borehole climate stations (this paper).
The Czech borehole climate station has been monitoring air, soil and bedrock tem-peratures to the depth of 38 m since the year 1994 (Smerdon et al., 2004, 2006). A
15
part of the station is a 150 m deep borehole drilled in 1992 ( ˇSafanda, 1994; ˇStulc, 1995), where the temperature has been logged repeatedly since the year 1993. Sim-ilar stations have been established within a joint Czech-Slovenian-Portuguese project in Slovenia (in the year 2003) and Portugal (2005). Similarly to the Czech station, the two stations monitor also the bedrock temperature to the depth of 40 m in the
bore-20
holes, which are 180 m (Portugal) and 100 m (Slovenia) deep and have been repeat-edly logged.
We focus in the paper on an alternative checking the assumption about the ground – air temperature tracking by comparing differences observed by repeated temperature logging with differences simulated by the SAT series from the nearby meteorological
25
stations. This method cannot substitute the temperature monitoring at the borehole climate stations, but can provide data on the ground-air coupling and downward propa-gation of the surface temperature changes, which encompass larger area and greater depth and time intervals. Beside three boreholes mentioned above, we explored
an-CPD
3, 631–653, 2007 Repeated temperature logs from Czechia, Slovenia and Portugal J. ˇSafanda et al. Title Page Abstract Introduction Conclusions References Tables Figures ◭ ◮ ◭ ◮ Back CloseFull Screen / Esc
Printer-friendly Version Interactive Discussion
other three repeatedly logged boreholes in a broader vicinity of the Slovenian station.
2 Data
2.1 Description of the boreholes used for establishing the borehole climate stations The Czech station is located in a park part of the campus of the Geophysical Institute in Prague (50◦02.5′N, 14◦28.7′E, 275 m a.s.l.) on a flat elevation in an undulated
land-5
scape with elevation variations of tens of metres. It consists of two boreholes, less than 2 m apart, drilled to 40 m and 150 m, respectively, in October 1992, specially for long-term borehole climate studies ( ˇCerm ´ak et al., 2000). The deeper well, referred to as GFU-1, has a diameter of 152 mm and was equipped by a 50 mm casing to minimize water convection and to facilitate repeated temperature logging, which is done
annu-10
ally since 1993. The shallower well was equipped by a series of termistors from 1 m depth down to 38.3 m and is used for a permanent temperature monitoring. The area represents the most stable part of the Bohemian Massif, which belongs to the Variscan Branch of the Hercynian system. The deeper well, completely cored, penetrated con-solidated sediments of Ordovician age, mostly micaceous, silty to clayey shales. The
15
bedding inclination varied between 0◦–90◦ as a result of folding. Thermal conductiv-ity, both along the bedding and perpendicular to it was measured on core samples from 124 depths ( ˇSafanda, 1994). The mean conductivity values, 3.2 W m−1K−1along the bedding and 2.2 W m−1K−1 perpendicular to it, indicate a strong anisotropy fac-tor of 1.45. No reliable diffusivity measurements were carried out, but for a typical
20
density of 2.6–2.7×10³kg m−3 and specific heat of 0.8–0.9 kJ kg−1K−1 ( ˇCerm ´ak and Rybach, 1982), its value can be estimated at 1.3–1.5×10⁻⁶m2s−1 along the bedding and 0.9–1.0×10⁻⁶m2s−1 perpendicular to it. Effective vertical values of conductivity and diffusivity corresponding to the mean bedding inclination of 50◦ from a horizontal are 2.8 W m−1K−1 and 1.1–1.3×10⁻⁶m2
s−1, respectively. 25
CPD
3, 631–653, 2007 Repeated temperature logs from Czechia, Slovenia and Portugal J. ˇSafanda et al. Title Page Abstract Introduction Conclusions References Tables Figures ◭ ◮ ◭ ◮ Back CloseFull Screen / Esc
Printer-friendly Version Interactive Discussion
filled with Tertiary and Quaternary sediments of the Pannonian basin. The basin itself is encompassed by the Internal Dinarides. The station was established in November 2003 in borehole V-8/86 (45◦52.1′N, 15◦24.5′E, 152 m a.s.l.), located in the alluvial plain of the Krka river in a rural area on a rim of the meadow. It was drilled in Octo-ber 1986 with diameter 90–120 mm through 16 m of Quaternary clay, sand and gravel,
5
and down to the bottom at 100 m through Miocene marl which is probably more silty or sandy in its upper part. The borehole was cased with plastic tube 4 cm in diam-eter. Thermal conductivity was measured in two depths only, 1.7 W m−1K−1 in 0.7 m and 1.45 W m−1K−1 in 99 m. Thermal diffusivity estimate based on typical density and specific heat values yields 0.6–0.8×10⁻⁶m2s−1. The diffusivity can be even lower due
10
to a high specific heat of the pore water, e.g. for 30% porosity it could be as low as 0.4×10⁻⁶m2s−1. The borehole was logged in 1987, one year after the drilling, and then in 2003 when a string of platinum sensors for permanent temperature monitoring was installed in the depth range 1–40 m.
The Portuguese station is located about 5 km northwest of the town of Evora, in
15
southern Portugal. The string of platinum sensors has been monitoring temperature in the depth range 1–40 m of the 200 m deep borehole TGQC-1 (38◦36.0′N,7◦54.6′W,
330 m a.s.l.) since May 2005. The borehole was drilled for water supply, but it turned out to be non-productive, with negligible inflow during pumping tests. It was cased with a plastic tube of 6.3 cm diameter, which was grouted at the bottom and filled with water.
20
The borehole is located in an old cork tree forest, the typical vegetation of the region. The vegetation has not changed in the last hundred years and probably more. The topography is subdued, with small elevation variations of tens of metres in the nearest few km. The outcropping rock type is Hercynian porphyric granite. Its thermophysical properties were measured on 4 samples collected in a quarry about 1.5 km east of the
25
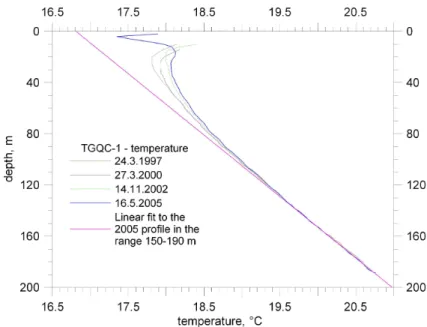
borehole and located in the same granite body. The mean conductivity and diffusivity values are 2.8 Wm−1K−1 and 1.3×10⁻⁶m2s−1. The first temperature log was carried out in 1997, several months after drilling and 2 months after casing installation. The repeated logs were done in years 2000, 2002, 2003, 2004 and 2005.
CPD
3, 631–653, 2007 Repeated temperature logs from Czechia, Slovenia and Portugal J. ˇSafanda et al. Title Page Abstract Introduction Conclusions References Tables Figures ◭ ◮ ◭ ◮ Back CloseFull Screen / Esc
Printer-friendly Version Interactive Discussion
Another three boreholes with no evident non-climatic influence on the subsurface temperatures, were repeatedly logged in Slovenia. They belong to the same category as borehole V-8/86 in Malence, about 100 m deep and 90–120 mm in diameter.
The ˇST-1/85 borehole at ˇStatenberg, 100 m deep, is situated in the slightly hilly area of the Pannonian basin’s south-west border region, about 55 km NNE from the
Ma-5
lence borehole climate station. It was drilled in June 1985, through the upper 4 m of Quaternary sand, silt and gravel, then down to 60 m depth through marl and to the bottom through siltstone of Upper and Middle Miocene, respectively. Conductivity of 2.01 Wm−1K−1 was determined on a siltstone sample from the depth of 98 m. It was logged in November 1985, 5 months after the drilling, and then in 2005.
10
The BR-1/86 borehole at Brdo near Kranj, 98 m deep, is located in the Ljubljana basin, about 90 km NW from Malence station, and filled with sediments of the Pannon-ian basin within the Southern Alps. It was drilled in October 1986, through the upper 7.8 m of Quaternary gravel, sand and clay, and down to the bottom through Oligocene clay. One conductivity value of clay from the depth of 60 m, 1.43 Wm−1K−1is available.
15
The well was logged in January 1987, 3 months after the drilling, and then in 2005. The V-7/85 borehole at Topliˇcnik near Kostanjevica, 100 m deep, is located in the alluvial plain of the Krka river in the same geological setting as the Malence station, and 1.7 km SE from it. It was drilled in 1985 through 9 m of Quaternary sand and gravel, and through Upper Miocene marl to the bottom. Conductivity was measured on
20
two samples of marl from 52 m and 100 m depth, 1.55 W m−1K−1and 1.23 W m−1K−1, respectively. It was logged in January 1986, several months after the drilling, and then in 2005.
Five kilometers ESE of the Malence station, borehole PDt-1 Brod-Podboˇcje was drilled in the same geological setting in January–March 2003 to the depth of 900 m.
25
It went through 14 m of Quaternary clay, sand and gravel, underlain down to 480 m by Upper Miocene sediments, predominantly sand and marl above 240 m and carbon-ate sandstone and sandy marl to marl below. The well was logged for the equilibrium temperature only once, in October 2006, but contrary to other Slovenian boreholes
CPD
3, 631–653, 2007 Repeated temperature logs from Czechia, Slovenia and Portugal J. ˇSafanda et al. Title Page Abstract Introduction Conclusions References Tables Figures ◭ ◮ ◭ ◮ Back CloseFull Screen / Esc
Printer-friendly Version Interactive Discussion
mentioned above, its greater depth allowed to invert the temperature log (Fig. 4) in terms of the ground surface temperature history like the profiles from the Czech and Portuguese stations.
2.2 Temperature logs
All logs discussed here are equilibrium logs done sufficiently long after the borehole
5
drilling for disturbances of temperature induced by the drilling to fade out. Most of the logs were done by the logging tool of the Geophysical Institute Prague, the resolution of which is several mK and absolute accuracy of the order of 0.01 K. The Portuguese log in 1997 and the Slovenian logs in the 80’s were done by tools of the Geological Survey of Portugal and Slovenia, respectively. Resolution of these tools was of the order of
10
0.01 K and the absolute accuracy of the order of 0.1 K. In comparing the repeated logs it was assumed that small differences between their lowermost linear sections (80– 100 m and below) are due to imperfect calibration. The repeated logs are shown in Figs. 1–3. All of the six repeatedly logged boreholes display a warming.
3 Results
15
3.1 Ground surface temperature history obtained by inversion of profiles from the climate station sites
Before examining the temporal changes observed by the repeated logging, we applied the functional space inversion method (FSI) (Shen and Beck, 1991) to the tempera-ture versus depth profiles from the Czech and Portuguese stations, which are 140 m
20
and 188 m deep, respectively, and to the Slovenian, 260 m deep profile from borehole Brod-Podboˇcje. As mentioned above, this Slovenian borehole lies only 5 km from the Malence station in the same geological setting. The other profiles are only 100 m deep and their inversion could not reproduce the whole amplitude of the recent warming
CPD
3, 631–653, 2007 Repeated temperature logs from Czechia, Slovenia and Portugal J. ˇSafanda et al. Title Page Abstract Introduction Conclusions References Tables Figures ◭ ◮ ◭ ◮ Back CloseFull Screen / Esc
Printer-friendly Version Interactive Discussion
(Majorowicz et al., 2004). The reconstructed variations of the ground surface tempera-ture (GST) history are depicted in Fig. 5a–c. In the case of the Czech and Portuguese profiles both individual and simultaneous inversions of the oldest and the most recent repeated logs were done (Fig. 5a–b). FSI of the Slovenian borehole, which was logged only once, was done for three different rock diffusivity values covering the expected
5
range (Fig. 5c). Whereas the effect of different diffusivity values on the reconstructed GST history is small, the GST histories reconstructed by individual inversions of the oldest and the youngest profiles differ considerably. This fact is connected with quickly decreasing resolution of the GST reconstruction going back in time.
Variation of the GST history at the Czech, Slovenian and Portuguese sites is shown
10
together with a variation of the mean annual SAT and its 11-year running average from meteorological stations in Prague, Ljubljana and Lisbon, respectively. The SAT series were shifted to the level of the reconstructed GST histories in the interval 1961– 1990. The used SAT series represents the longest one in each of the three countries. Observations in Prague began in the year 1771, in Ljubljana in 1851 and in Lisbon in
15
1856. A distance of the corresponding meteorological stations from the borehole sites is about 8 km in Prague, 80 km in Slovenia and 100 km in Portugal. Each of the stations is located in a large city, with Lisbon and Prague having about 1 million inhabitants each and Ljubljana about 0.3 million. Therefore, the amplitude of the recent warming which started at the end of the 19th century may have been enhanced by the anthropogenic
20
effect caused by the growing city ( ˇSafanda et al., 1997). Both amplitude and course of the Lisbon SAT warming is quite well reproduced by inversion of the Portuguese profile, where it amounts to about 1.5◦C. Amplitude of the SAT warming, about 2◦C,
observed both at Prague and Ljubljana is larger by 0.5–1◦C than amplitudes of the GST reconstructions at corresponding borehole sites and the GST warming started
25
CPD
3, 631–653, 2007 Repeated temperature logs from Czechia, Slovenia and Portugal J. ˇSafanda et al. Title Page Abstract Introduction Conclusions References Tables Figures ◭ ◮ ◭ ◮ Back CloseFull Screen / Esc
Printer-friendly Version Interactive Discussion
3.2 Observed and simulated temporal subsurface temperature changes
The repeated logs shown in Figs. 1–3 can be used to examine the temporal subsurface temperature changes over the logging period and their depth dependence. Figures 6– 8 depict differences between the most recent and the most remote temperature logs of the individual Czech, Slovenian and Portugal boreholes, down from the depth of 15 m.
5
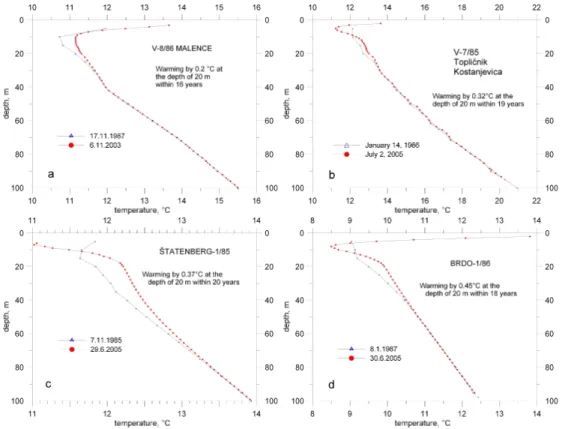
All differences indicate warming, which is in a qualitative agreement with the SAT observations. The most intensive one is observed in the Czech borehole, where its amplitude amounts to 0.6◦C at 20 m during the 12 year period 1993–2005 (Fig. 1) (warming rate of 0.050◦C/yr) and temporal changes are evident down to 90 m. Appre-ciably smaller changes were registered at the Slovenian station Malence (Fig. 2a) and
10
nearby borehole Topliˇcnik (Fig. 2b), with warming amplitude 0.2◦C in the 16 year period 1987–2003 (0.012◦C/yr) and 0.3◦C in the 19 year interval 1986–2005 (0.017◦C/yr), re-spectively. The differences here attenuate quickly with depth and diminish at 30–40 m. Slightly higher differences, about 0.4◦C at 20 m are displayed by another two Slovenian boreholes ˇStatenberg (Fig. 2c) and Brdo (Fig. 2d) over a span of 20 years (1985–
15
2005) (0.018◦C/yr) and 18 years (1987–2005) (0.025◦C/yr), respectively. They go also
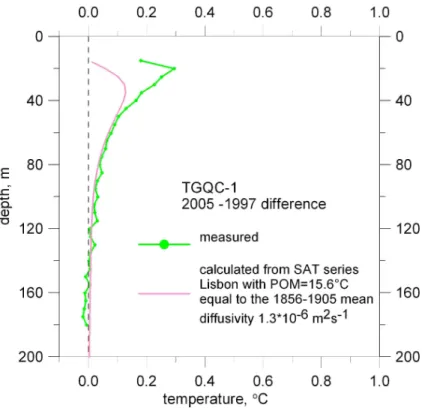
deeper than the previous two, to 90 m in ˇStatenberg and to 50 m in Brdo. Repeated logs of borehole TGQC-1 at the Portuguese station cover 8 year interval (1997–2005) and indicate warming of 0.3◦C at 20 m (0.037◦C/yr) fading out at the depth of 120 m.
In order to explore a degree of coupling between the air and ground temperatures
20
and propagation of the surface temperature changes downward into the bedrock, the observed differences are compared with the synthetic ones, which were calculated by solving the transient heat conduction equation in geothermal models of the individual borehole sites, using the SAT observations at the corresponding meteorological sta-tions as a surface forcing function. The heat conduction equation was solved by finite
25
difference method ( ˇSafanda, 1985, ˇSafanda and ˇCerm ´ak, 2000) in 500 m deep one-dimensional models with a zero heat flow boundary condition at the bottom. The sim-ulation ran since the beginning of the SAT observations to the time of the last logging.
CPD
3, 631–653, 2007 Repeated temperature logs from Czechia, Slovenia and Portugal J. ˇSafanda et al. Title Page Abstract Introduction Conclusions References Tables Figures ◭ ◮ ◭ ◮ Back CloseFull Screen / Esc
Printer-friendly Version Interactive Discussion
Solution of the equation – the subsurface transient response to the SAT forcing func-tion - depends on the initial temperature versus depth profile, which was considered constant and equal to the so called pre-observational mean (POM). This parameter influences strongly the shape of the transient profile ( ˇSafanda et al., 1997; Harris and Chapman, 1997; Majorowicz et al., 1999, 2004), but not so much the calculated
differ-5
ence of the synthetic transients. According to our numerical experiments, effect of the POM, varying by ±0.5◦C around the mean of the first 50 years of the SAT observations, on the simulated difference is of the order of hundredths of degree C.
The synthetic differences for the Czech, Slovenian and Portuguese boreholes were simulated using the SAT series from meteorological stations in Prague, Ljubljana and
10
Lisbon, respectively. They are plotted together with the observed differences in Figs. 6– 8. A distance between a borehole and a corresponding meteorological station is not more than 100 km in all cases. The POMs used for the Ljubljana and Lisbon SAT series were equal to the mean of the first 50 years of the observations, i.e. 9.0◦C (1851–1900)
and 15.6◦C (1856–1905), respectively. In the case of the Prague station, the used
15
POM, 9.5◦C, is slightly lower than the mean of the first 50 years, 9.77◦C (1771–1820), because SAT in Prague, as well as in the whole Northern Hemisphere, were in the end of the 18th century higher than a long-term mean at that time (Br ´azdil and Kotyza, 1995; Mann et al., 1999).
In computing the synthetic transients for the Portuguese and the Czech sites, we
20
used annual means of the SAT, because the repeated logs were done in the same sea-son of a year. In the case of the Slovenian sites, beside the annual also the monthly means were used alternatively to account for a possible influence of the annual run on the difference calculated from the repeated logs done in different seasons of a year. It turned out that below 15 m the results yielded by the two alternatives coincide within
25
several hundredths of degree C. Using the monthly means of the Ljubljana meteoro-logical station, we experimented also by a concept of the surficial active layer (Pollack et al., 2005), when surficial processes of the heat transfer are simulated by a reduced thermal diffusivity layer at shallow depths. We considered a layer 0–0.5 m bellow the
CPD
3, 631–653, 2007 Repeated temperature logs from Czechia, Slovenia and Portugal J. ˇSafanda et al. Title Page Abstract Introduction Conclusions References Tables Figures ◭ ◮ ◭ ◮ Back CloseFull Screen / Esc
Printer-friendly Version Interactive Discussion
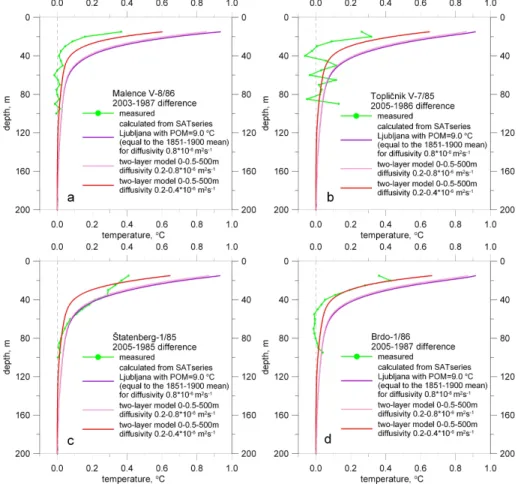
ground surface with diffusivity 0.2×10⁻⁶m2s−1. As can be seen in Fig. 7, influence of this low diffusivity layer on the synthetic differences is negligible. It is in agreement with the results of Pollack et al. (2005), because the difference between the repeated logs arises due to multi-year variations and a multi-decadal warming trend, which pass through the active layer without a substantial attenuation.
5
Fig.6-8 show that a degree of coincidence between the observed and simulated differences varies in a broad range. In the Portuguese and the Czech boreholes the synthetic difference approximates the observed one quite well below the depth of 40– 50 m, but amounts to only half of it at 20 m. On the contrary, in Slovenian boreholes Malence and Topliˇcnik, the synthetic difference is larger that the observed one even for
10
the lowest possible diffusivity of 0.4×10⁻⁶m2s−1. Relatively good agreement between the two differences appears in the remaining two Slovenian boreholes ˇStatenberg and Brdo for the realistic diffusivities 0.8×10⁻⁶m2s−1 and 0.4×10⁻⁶m2s−1, respectively.
4 Discussion
The most prominent feature of the SAT series is an acceleration of the warming in the
15
last two decades of the 20th century. In this respect it is interesting to compare ampli-tude of warming of the 11-year SAT running average and of the GST reconstructed by the FSI in the period 1980–2000. The GST warming surpassed the SAT one by 0.4◦C
in Czechia (1.4◦C versus 1.0◦C) (Fig. 5a) and by 0.2◦C in Portugal (0.8◦C versus 0.6◦C) (Fig. 5c), but was by 0.3◦C smaller in Slovenia (1.0◦C versus 1.3◦C) (Fig. 5b), in this
20
period. The last two decade warming has a strong influence on the temporal changes observed by the repeated logging. In accordance with the results of the FSI recon-structions of the GST, the observed differences are higher than the simulated ones at the Czech and Portuguese stations, but lower at the Slovenian station.
The largest difference was observed at the Czech station, 0.6◦C at 20 m (warming
25
rate of 0.050◦C/yr) (Fig. 6). It is two times more than the simulated difference sug-gests. Therefore, it cannot be excluded that subsurface temperature at the station is
CPD
3, 631–653, 2007 Repeated temperature logs from Czechia, Slovenia and Portugal J. ˇSafanda et al. Title Page Abstract Introduction Conclusions References Tables Figures ◭ ◮ ◭ ◮ Back CloseFull Screen / Esc
Printer-friendly Version Interactive Discussion
influenced by new structures built within the campus of the Geophysical Institute within the last 10–20 years and/or by other components of infrastructure (asphalt roads, a playground etc.). This suspicion is supported by an otherwise quite good correspon-dence of the two differences in a greater depth below 40–50 m.
The situation at the Portuguese station is qualitatively similar to that at the Czech
5
station. Also here the observed difference surpasses the simulated one in the up-permost 40 m and is similar to it below this depth. In absolute values, however, the differences and their misfit are much smaller. The observed warming of 0.3◦C at 20 m (warming rate of 0.037◦C/yr) is by half smaller than in Prague. The observed higher-than-simulated warming in the borehole might stem, at least partially, from possible
10
differences in the last two decade SAT warming on the Atlantic Ocean coast, repre-sented by the Lisbon SAT series, and at the borehole site with a more continental climate typical for the interior of the country.
The observed differences in borehole Malence at the site of the Slovenian station and in the nearby borehole Topliˇcnik are smaller that the simulated ones and diminish
15
to the noise level at shallow depths of 30–40 m. The smaller-than-expected warming of the ground is evident also from the GST history obtained by the FSI of the temperature log of the third borehole in the area, Brod-Podboˇcje. All three boreholes are situated in the alluvial plain of the Krka river and as the long-term temperature monitoring (since November 2003) in the uppermost 40 m of the Malence station indicates (Rajver et al.,
20
2006), a heat advection by a horizontal groundwater flow is very probably present here and interferes to a certain degree with the vertically propagating surface temperature changes.
The two remaining Slovenian boreholes, ˇStatenberg and Brdo display the best fit of the observed and simulated differences among the boreholes discussed in the
pa-25
per. In the Brdo borehole, a substantial difference appears only in the depth of 15 m and might be connected with an unusually deep and large annual run visible in the 2005 log (Fig. 2d). Similarly large annual run is indicated by the 2005 log of borehole
ˇ
CPD
3, 631–653, 2007 Repeated temperature logs from Czechia, Slovenia and Portugal J. ˇSafanda et al. Title Page Abstract Introduction Conclusions References Tables Figures ◭ ◮ ◭ ◮ Back CloseFull Screen / Esc
Printer-friendly Version Interactive Discussion
for the expected diffusivity range.
5 Conclusions
The repeated logging of 6 boreholes, among them those which became a part of the Czech, Slovenian and Portuguese borehole climate stations, revealed a warming of the subsurface within the logging period spanning 8–20 years prior 2003–2005. The
5
observed warming is in a qualitative, and in some boreholes also in a quantitative agreement with the warming simulated by the 150–230 year long SAT series from Prague, Ljubljana and Lisbon, which were used as a surface forcing function in solving the transient heat conduction equation in geothermal models of the borehole sites. The revealed discrepancies could indicate an imperfect air – ground surface temperature
10
tracking, but alternative explanations are possible. In the case of the Czech station it is mainly a possible transient warming effect of new buildings constructed in the last 10–20 years in a broader vicinity of the borehole. In the case of the Portuguese station, located 100 km inland, the rapid warming of the last two decades could be higher than that revealed in the Lisbon SAT series, where it might be moderated by proximity of
15
the Atlantic Ocean. At the Slovenian station, the weak subsurface warming could be connected with a horizontal groundwater flow.
The outlined alternative explanations of the observed and simulated differences of the repeated logs will be in a scope of the future research. We also hope to con-strain further the uncertainty concerning the air – ground surface temperature tracking
20
by continuing the repeated logging and by analyzing the time – temperature series obtained by the long-term monitoring at the three borehole climate stations.
Acknowledgements. This research has been supported by NATO Collaborative Linkage Grant PDD(CP)-(EST. CLG 980 152) and by the grant project IAA300120603 of the Grant Agency of the Academy of Sciences of the Czech Republic.
CPD
3, 631–653, 2007 Repeated temperature logs from Czechia, Slovenia and Portugal J. ˇSafanda et al. Title Page Abstract Introduction Conclusions References Tables Figures ◭ ◮ ◭ ◮ Back CloseFull Screen / Esc
Printer-friendly Version Interactive Discussion
References
Br ´azdil, R. and Kotyza, O.: History of Weather and Climate in the Czech Lands, Verlag Georg. Inst. ETH Zurich, pp. 260, 1995.
ˇ
Cerm ´ak, V. and Rybach, L.: Thermal conductivity and specific heat of minerals and rocks, in: Physical Properties of Rocks, edited by: Angenheister, G. Landolt-B ¨ornstein New Series,
5
Vol. V/1a, Springer, Berlin, 305–343, 1982. ˇ
Cerm ´ak, V., ˇSafanda, J., Kreˇsl, M. , D ˇedeˇcek, P., and Bodri, L.: Recent climate warming: surface air temperature series and geothermal evidence, Studia geoph. et geod., 44, 430– 441, 2000.
Harris, R. N. and Chapman, D. S.: Borehole temperature as a baseline for 20th-century global
10
warming estimates, Science, 275, 1618–1621, 1997.
Harris, R. N. and Chapman, D. S.: Mid-latitude (30◦–60◦) climatic warming inferred by combin-ing borehole temperatures with surface air temperatures, Geophys. Res. Lett., 28, 747–750, 2001.
Huang, S., Pollack, H. N., and Shen, P.-Y.: Temperature trends over the last five centuries
15
reconstructed from borehole temperatures, Nature, 403, 756–758, 2000.
Majorowicz, J., ˇSafanda, J., Harris, R. N., and Skinner, W. R.: Large ground surface tempera-ture changes of the last three centuries inferred from borehole temperatempera-tures in the Southern Canadian Prairies, Saskatchewan, Global Planet. Change, 20, 227–241, 1999.
Majorowicz, J., Skinner, W., and ˇSafanda, J.: Past surface temperature changes as derived
20
from continental temperature logs - Canadian and some global examples of application of a new tool in climate change studies, Advances in Geophysics, 47, 113-174, 2004.
Mann, M. E., Bradley, R. S., and Hyghes, M. K.: Northern Hemisphere temperatures during the past millennium: inferences, uncertaintes, and limitations, Geophys. Res. Lett., 26, 759–762, 1999.
25
Pollack, H. N. and Smerdon, J. E.: Borehole climate reconstructions: Spacial structure and hemispheric averages, J. Geophys. Res., 109, D11106, doi:10.1029/2003JD004163, 2004. Pollack, H. N., Smerdon, J. E., and van Keken, P. E.: Variable seasonal coupling between air
and ground temperatures: A simple representation in terms of subsurface thermal diffusivity, Geophys. Res. Lett., 32, L15405, doi:10.1029/2005GL023869, 2005.
30
Putnam, S. N. and Chapman, D. S.: A geothermal climate change observatory:First year results from Emigrant Pass in northwest Utah, J. Geophys. Res., 101, 21 877–21 890, 1996.
CPD
3, 631–653, 2007 Repeated temperature logs from Czechia, Slovenia and Portugal J. ˇSafanda et al. Title Page Abstract Introduction Conclusions References Tables Figures ◭ ◮ ◭ ◮ Back CloseFull Screen / Esc
Printer-friendly Version Interactive Discussion
Rajver, D., ˇSafanda, J., and D ˇedeˇcek, P.: Monitoring of air-ground temperature coupling and examples of shallow subsurface warming in Slovenia, Geologija, 49/2, 279–293, 2006. ˇ
Safanda, J.: Calculation of temperature distribution in two-dimensional geothermal profile, Stu-dia geoph. et geod., 29, 191–207, 1985.
ˇ
Safanda, J.: Effects of topography and climatic changes on the temperature in borehole GF ´U-1,
5
Prague. Tectonophysics, 239, 187–197, 1994. ˇ
Safanda, J. and ˇCerm ´ak, V.: Subsurface temperature changes due to the crustal magmatic activity - numerical simulation, Studia geoph. et geod., 44, 327–335, 2000.
ˇ
Safanda, J., ˇCerm ´ak, V., and Bodri, L.: Climate history inferred from borehole temperatures, data from the Czech Republic, Surveys in Geophysics, 18, 197–212, 1997.
10
Shen, P.-Yu. and Beck A. E.: Least squares inversion of borehole temperature measurements in functional space, J. Geophys. Res., 96, 19 965–19 979, 1991.
Smerdon, J. E., Pollack, H. N., ˇCerm ´ak, V., Enz, J. W., Kreˇsl, M., ˇSafanda, J., and Wehmiller, J. F.: Air-ground temperature coupling and subsurface propagation of annual temperature signals, J. Geophys. Res., 109, D21107, doi:10.1029/2004JD005056, 2004.
15
Smerdon, J. E., Pollack, H. N., ˇCerm ´ak, V., Enz, J. W., Kreˇsl, M., ˇSafanda, J., and Wehmiller, J. F.: Daily, seasonal and annual relationships between air and subsurface temperatures, J. Geophys. Res., 111, D07101, doi:10.1029/2004JD005578, 2006.
ˇ
Stulc, P.: Return to thermal equilibrium of an intermittently drilled hole: theory and experiment, Tectonophysics, 241, 35–45, 1995.
CPD
3, 631–653, 2007 Repeated temperature logs from Czechia, Slovenia and Portugal J. ˇSafanda et al. Title Page Abstract Introduction Conclusions References Tables Figures ◭ ◮ ◭ ◮ Back CloseFull Screen / Esc
Printer-friendly Version Interactive Discussion Fig. 1. Repeated temperature logs of the GFU-1 borehole at the site of the Czech borehole
CPD
3, 631–653, 2007 Repeated temperature logs from Czechia, Slovenia and Portugal J. ˇSafanda et al. Title Page Abstract Introduction Conclusions References Tables Figures ◭ ◮ ◭ ◮ Back CloseFull Screen / Esc
Printer-friendly Version Interactive Discussion Fig. 2. Repeated temperature logs done in Slovenia in borehole (a) V-8/86 Malence at the
site of the Slovenian borehole climate station, (b) V-7/85 Topliˇcnik, (c) ˇStatenberg-1/85 and (d) Brdo-1/86.
CPD
3, 631–653, 2007 Repeated temperature logs from Czechia, Slovenia and Portugal J. ˇSafanda et al. Title Page Abstract Introduction Conclusions References Tables Figures ◭ ◮ ◭ ◮ Back CloseFull Screen / Esc
Printer-friendly Version Interactive Discussion Fig. 3. Repeated temperature logs of the TGQC-1 borehole at the site of the Portuguese
CPD
3, 631–653, 2007 Repeated temperature logs from Czechia, Slovenia and Portugal J. ˇSafanda et al. Title Page Abstract Introduction Conclusions References Tables Figures ◭ ◮ ◭ ◮ Back CloseFull Screen / Esc
Printer-friendly Version Interactive Discussion Fig. 4. Temperature log of the upper part of borehole PDt-1 Brod-Podboˇcje.
CPD
3, 631–653, 2007 Repeated temperature logs from Czechia, Slovenia and Portugal J. ˇSafanda et al. Title Page Abstract Introduction Conclusions References Tables Figures ◭ ◮ ◭ ◮ Back CloseFull Screen / Esc
Printer-friendly Version Interactive Discussion Fig. 5. Ground surface temperature histories reconstructed by functional space inversion for
the Czech (a), Slovenian (b) and Portuguese (c) borehole climate stations. Variations of the ground temperature are shown together with variations of the surface air temperatures and their 11-year running averages from meteorological stations in Prague, Ljubljana and Lisbon, respectively. For the Czech and Portuguese boreholes both individual and simultaneous in-versions of the repeated logs were done. Three histories shown for the Slovenian borehole demonstrate the uncertainty given by a loosely constrained diffusivity.
CPD
3, 631–653, 2007 Repeated temperature logs from Czechia, Slovenia and Portugal J. ˇSafanda et al. Title Page Abstract Introduction Conclusions References Tables Figures ◭ ◮ ◭ ◮ Back CloseFull Screen / Esc
Printer-friendly Version Interactive Discussion Fig. 6. Comparison of the difference between the repeated logs (2005–1993) of the Czech
borehole GFU-1 versus the difference simulated by SAT series from Prague meteorological station.
CPD
3, 631–653, 2007 Repeated temperature logs from Czechia, Slovenia and Portugal J. ˇSafanda et al. Title Page Abstract Introduction Conclusions References Tables Figures ◭ ◮ ◭ ◮ Back CloseFull Screen / Esc
Printer-friendly Version Interactive Discussion Fig. 7. Comparison of the difference between the repeated logs of the Slovenian boreholes
versus difference simulated by SAT series from Ljubljana. (a) V-8/86 Malence at the site of the Slovenian borehole climate station, (b) V-7/85 Topliˇcnik, (c) ˇStatenberg-1/85 and (d) Brdo-1/86. Three different conductive models were considered.
CPD
3, 631–653, 2007 Repeated temperature logs from Czechia, Slovenia and Portugal J. ˇSafanda et al. Title Page Abstract Introduction Conclusions References Tables Figures ◭ ◮ ◭ ◮ Back CloseFull Screen / Esc
Printer-friendly Version Interactive Discussion Fig. 8. Comparison of the difference between the repeated logs (2005–1997) of the Portuguese