HAL Id: inserm-00143640
https://www.hal.inserm.fr/inserm-00143640
Submitted on 30 Nov 2007HAL is a multi-disciplinary open access archive for the deposit and dissemination of sci-entific research documents, whether they are pub-lished or not. The documents may come from teaching and research institutions in France or abroad, or from public or private research centers.
L’archive ouverte pluridisciplinaire HAL, est destinée au dépôt et à la diffusion de documents scientifiques de niveau recherche, publiés ou non, émanant des établissements d’enseignement et de recherche français ou étrangers, des laboratoires publics ou privés.
Dietary patterns and risk of colorectal tumors: a cohort
of French women of the National Education System
(E3N).
Emmanuelle Kesse, Françoise Clavel-Chapelon, Marie-Christine
Boutron-Ruault
To cite this version:
Emmanuelle Kesse, Françoise Clavel-Chapelon, Marie-Christine Boutron-Ruault. Dietary patterns and risk of colorectal tumors: a cohort of French women of the National Education System (E3N).. American Journal of Epidemiology, Oxford University Press (OUP), 2006, 164 (11), pp.1085-93. �10.1093/aje/kwj324�. �inserm-00143640�
Dietary Patterns and Risk of Colorectal Tumors: A Cohort of French Women of
the National Education System (E3N)
E. Kesse, F. Clavel-Chapelon, and M. C. Boutron-Ruault
*From the Inserm, ERI20, Equipe E3N, Institut Gustave Roussy, Villejuif Cedex, France.
Little is known about the dietary patterns associated with colorectal tumors along the adenoma-carcinoma sequence. Scores for dietary patterns were obtained by factor analysis in women from the French cohort of the European Prospective Investigation into Cancer and Nutrition (1993–2000). Their association with colorectal tumors was investigated in 516 adenoma cases (175 high-risk adenomas) and 4,804 polyp-free women and in 172 colorectal cancer cases and 67,312 cancer-free women. The authors identified four dietary patterns: ‘‘healthy’’ (vegetables, fruit, yogurt, sea products, and olive oil); ‘‘Western’’ (potatoes, pizzas and pies, sandwiches, sweets, cakes, cheese, cereal products, processed meat, eggs, and butter); ‘‘drinker’’ (sandwiches, snacks, processed meat, and alcoholic beverages); and ‘‘meat eaters’’ (meat, poultry, and margarine). For quartile 4 versus quartile 1, an increased risk of adenoma was observed with high scores of the Western pattern (multivariate relative risk (RR) = 1.39, 95% confidence interval: 1.00, 1.94; ptrend = 0.03) and the drinker pattern
(RR = 1.42, 95% confidence interval: 1.10, 1.83; ptrend = 0.01). The meat-eaters pattern was positively associated
with colorectal cancer risk (for quartile 4 vs. quartile 1: RR = 1.58, 95% confidence interval: 0.98, 2.53; ptrend =
0.02). Dietary patterns that reflect a Western way of life are associated with a higher risk of colorectal tumors. adenoma; cohort studies; colorectal neoplasms; diet; risk; women
Abbreviations: E3N, Etude Epidémiologique de Femmes de la Mutuelle Générale de l’Education Nationale; EPIC, European Prospective Investigation into Cancer and Nutrition; RR, relative risk.
Colorectal cancer is well known as a multifactorial disease involving especially diet, physical activity, and genetic and hormonal factors (1). Numerous substances, carcinogenic and anticarcinogenic, contained in food have been related to the risk of colorectal tumors. Recent findings were reviewed (2–9), but results of studies concerning dietary components have not always been consistent, and there are several disparities between case-control and cohort studies. Consumptions of vegetables (2) and dairy products (9) have frequently been related to a lower risk of colorectal cancer, while those of red and/or processed meat (4, 10, 11) and alcohol (6) have been associated with a higher risk. Most studies have typically investigated the effect of specific foods and/or nutrients. However, foods or nutrients tend to be closely correlated, so that it is not always easy to determine precisely the relative importance of each factor. Correlations between foods and/or nutrients are strong. Thus, the specific effect of a dietary component of interest may be difficult to identify and can be partly confounded by other dietary components (12), introducing bias into the estimation of the relation between diet and the studied disease. Therefore, several authors have investigated the effect of diet on colorectal cancer by considering dietary patterns built up by factor analysis (13–17), a method which creates dietary patterns by aggregating related variables, thus making the interpretation of dietary exposure easier. Few authors have produced data on the patterns associated with risk of incidence (18, 19) or recurrence (20) of adenomatous polyps. To investigate the patterns associated with risk of malignant and benign colorectal tumors among women participating in the French cohort of the European Prospective Investigation into Cancer and Nutrition (EPIC), we used the overall cancer-free population (at the time of the dietary interview) for whom dietary data were available to build up patterns. Then, we studied prospectively the association between these dietary patterns and the risk of adenomatous polyps and colorectal cancer.
*
Correspondence to Dr. M. C. Boutron-Ruault, Inserm, Equipe E3N, Institut Gustave Roussy, 39 rue Camille Desmoulins, 94805 Villejuif Cedex, France (e-mail: boutron@igr.fr).
MATERIALS AND METHODS Cohort study
The ‘‘Etude Epidémiologique de Femmes de la Mutuelle Générale de l’Education Nationale’’ (E3N) study is a prospective cohort study initiated in France in 1990 to study the risk factors for the most frequent sites of cancer in women (21). The cohort includes 100,000 women living in France, aged 40–65 years at baseline, and covered by the national teachers’ health insurance plan. E3N is the French part of the EPIC study (22). All study subjects signed an informed consent form in compliance with the French National Commission for Computed Data and Individual Freedom (Commission Nationale Informatique et Libertés) from which we obtained approval. Dietary habits, use of hormonal treatments, reproductive factors, lifestyle, anthropometric measurements, personal history of diseases, and family history of cancer were recorded in self–administered questionnaires, completed approximately every 24 months. Each questionnaire recorded the occurrence of personal medical events, in particular, intestinal polyps or cancer, since the last follow-up questionnaire.
Dietary data
Dietary data were collected between June 1993 and July 1995. The questionnaire was composed of two parts, the first including questions on consumption (quantity and frequency) of food groups and the second including qualitative questions which enabled a better definition of the food groups by use of individual food items. The questionnaire allowed the assessment of the consumption of 208 dietary items, beverages, and recipes. A booklet of photographs accompanied the questionnaire to facilitate the estimation of portion sizes.
Both the questionnaire and the booklet were validated (23, 24). The validity of the dietary questionnaire was estimated on a sample of 115 women, taking as the reference the average of twelve 24-hour recalls obtained monthly during 1 year. The reproducibility of the questionnaires completed after a 1-year interval was also tested. The Spearman correlation coefficient for dairy food consumption was 0.67 for validity and 0.73 for reproducibility. Similarly, coefficients were 0.43 and 0.64 for meat, 0.50 and 0.64 for vegetables, and 0.58 and 0.74 for fats. A high proportion of subjects (76 percent for foods and 72 percent for nutrients) were classified in the same or adjacent quintile by both the dietary questionnaire and the 24-hour recalls. The diet history questionnaire was sent to 95,644 women, and two reminders were sent to nonresponders. A total of 77,613 questionnaires were collected (81.1 percent). After the exclusions of 985 questionnaires because of the absence of consent for external health follow-up by the health insurer in the event of dropout, 2,050 questionnaires because of miscoded answers, eight questionnaires with all answers missing, and 46 questionnaires because of two answers to the questionnaire, 74,524 questionnaires were available for analysis.
Women with extreme values (in the bottom 1 percent or top 1 percent) of the ratio between energy intake and required energy (calculated after taking into account age, weight, and height) were also excluded. Overall, 73,034 women were considered in the present analysis.
Cases and noncases
Two separate studies were performed on adenoma and colorectal cancer risks. The adenoma study was based on the 1,933 subjects who reported the diagnosis of a colorectal polyp between the return of the dietary questionnaire (1993–1995) and December 1997. Pathology reports were obtained for 1,892 women (97.9 percent). Among them, 41 had a tumor of unidentified histologic type, 388 had no tumor (biopsy of normal mucosa), 108 had a colorectal cancer, 387 had hyperplastic polyps, and 968 had adenomatous polyps. We excluded subjects with previous cancer (n = 34), familial adenomatous polyposis (n = 7), inflammatory bowel disease (n = 7), personal history of previous adenoma (n = 390), or an adenoma diagnosed after the end of follow-up (December 1997) (n = 14). As adenomas are frequent (25) and mostly asymptomatic tumors, adenoma cases were compared with a polyp-free population. Thus, we considered as noncases subjects who reported a normal colonoscopy in the subsequent questionnaire, sent in June 2000, and who never reported a personal history of polyp or cancer. In order to identify the nutritional factors involved in adenoma progression, we isolated a group of high-risk adenomas with either a large adenoma (over 1 cm), severe dysplasia, multiple adenomas (i.e., three or more), or a villous component (26). The population for the adenoma study was thus composed of 516 women with adenomatous polyps, among which 175 were high-risk adenomas, and of 4,804 polyp-free women.
The colorectal cancer study was performed on subjects who reported a primary colorectal cancer between the dietary data record and June 2000. We excluded women with cancer diagnosed before the start of
follow-up (n = 4,592), non-histologically confirmed colorectal cancers (n = 7), familial polyposis syndrome (n = 334), or inflammatory bowel disease (n = 556), as well as subjects lost to follow-up (n = 61) after the dietary assessment. Finally, 172 women with colorectal cancer (129 with colon and 43 with rectal cancer) and 67,312 colorectal cancer-free women were included in this analysis.
Dietary patterns assessment
First, we assigned the 208 food items to 40 predefined food groups. Dietary patterns were produced from a factor analysis, based on the predefined food groups, using the procedure factor (principal component method). Dietary patterns were generated from the 68,442 subjects with no previous cancer at the time of dietary record. A negative (respectively positive) factor loading means that the food group or item is inversely (respectively positively) correlated with the factor.We arbitrarily considered only the food groups or items for which the loading coefficient was higher than 0.2 or lower than -0.2, as this value roughly corresponds to a statistical significance of p = 0.05. Labels were attributed to the dietary patterns according to the most significant foods associated with the patterns. Factors were rotated by an orthogonal transformation, using the SAS ‘‘Varimax’’ option (SAS Institute, Inc., Cary, North Carolina), in order to obtain a simpler structure to make interpretation easier. For each subject, the factor score for each pattern was calculated by summing up the standardized consumption of food groups weighted by the factor loadings.
Statistical methods
To investigate the association between dietary patterns, obtained from the whole population, and colorectal adenoma and cancer, we calculated relative risks, with age as the timescale, and 95 percent confidence intervals. For the adenoma study, subjects contributed person-time up to the date of the diagnosis of adenomatous polyp, date of cancer at any site (except basal cell skin carcinoma), date of the last completed questionnaire, date of death, or December 1997, whichever occurred first. For the cancer study, subjects contributed person-time up to the date of diagnosis of colorectal cancer, date of cancer at any other site (except basal cell skin carcinoma), date of the last completed questionnaire, date of death, or June 2000, whichever occurred first. Control for potentially confounding factors was ensured by adjustment for total daily energy intake from diet (as a continuous variable), body mass index (as a continuous variable), family history of colorectal cancer (yes/no), physical activity (tertiles of the weekly metabolic cost for exercise), high educational level (yes/no), and tobacco status (never/current/former smokers), all variables being assessed at the time of the dietary interview. Tests for linear trend were performed by considering quartiles of the individual factor scores as ordinal variables. We calculated age-adjusted relative risks and multivariate relative risks. All tests were two sided. We also stratified relative risks (findings not tabulated) for subjects older and younger than 51 years (median age of the tumor-free subjects). Analyses were performed using SAS, version 8.2, software (SAS Institute, Inc.).
RESULTS
Characteristics of the dietary patterns
We identified four main dietary patterns. Table 1 presents the factor-loading matrix between food items or food groups and the patterns. Pattern 1 was characterized by a high consumption of raw and cooked vegetables, legumes, fruit, yogurt, fresh cheese, breakfast cereals, sea products, eggs, and vegetable oils (olive oil and others) and by a low consumption of sweets; it was designated ‘‘healthy.’’ Pattern 2 was positively correlated with consumption of potatoes, pizza and pie, sandwiches, legumes, sweets, cakes, cheese, bread, rice, pasta, processed meat, eggs, and butter and was designated ‘‘Western.’’ Pattern 3 was associated with a high consumption of sandwiches, snacks, coffee, processed meat, sea products, wine, and other alcoholic beverages, as well as by a low consumption of soup and fruit. It was designated ‘‘drinker’’ and was strongly associated with ethanol intake. Pattern 4, designated ‘‘meat eaters,’’ was positively associated with a high consumption of potatoes, legumes, coffee, meat, poultry, vegetable oils (except olive oil), and margarine and negatively associated with tea, olive oil, and breakfast cereals.
TABLE 1. Factor loadings* for the four rotated factors (n = 68,442), France, 1993–2000
Food or food group Healthy Western Drinker Meat eaters
Potatoes 0.45 0.33
Raw vegetables 0.65
Cooked vegetables 0.68
Pizza and pies 0.48
Sandwiches 0.32 0.21 Legumes 0.33 0.32 0.23 Snacks 0.55 Coffee 0.30 0.26 Tea -0.32 Fruits 0.35 -0.29 Sweets -0.20 0.42 Cakes 0.41 Cheese 0.25 Yogurt 0.31 Fresh cheese 0.34 Pasta 0.63 Rice 0.55 Bread 0.37 Breakfast cereal 0.25 -0.23 Meat 0.52 Poultry 0.49 Processed meat 0.39 0.35 Sea products 0.49 0.20 Egg 0.26 0.23 Vegetable oils 0.41 0.58 Olive oil 0.48 -0.39 Butter 0.29 Margarine 0.26 Wine 0.54 Low-alcohol beverages 0.34 High-alcohol beverages 0.64 Soup -0.36
* Factor loadings of less than ±0.20 were omitted for simplicity (other fat, milk, sweet drinks, juice, nonmineral water, mineral water, chicory, and chocolate beverages).
Characteristics of subjects according to their factor score for each pattern are presented in table 2. Subjects with a high versus low score for the healthy pattern exercised more, had a higher level of education, and were also more frequently former smokers. TheWestern pattern score was significantly associated with lower age, higher level of exercise, and higher level of education. Subjects with a high score for the drinker pattern were younger and were more frequently current smokers. Subjects with a high score for the meat eaters pattern had more often a family history of colorectal cancer, a low level of education, and a sedentary lifestyle; they were younger and were less often current or former smokers. In addition, for all patterns, women with a high versus low score had a higher energy intake, as well as a higher body mass index, except for the Western pattern where body mass tended to be somewhat lower in subjects with a high score.
TABLE 2. Characteristics of the population (n = 68,442) by mean (standard deviation) or percent, unless otherwise specified, according to quartiles of factor scores for each pattern, France, 1993–2000
Quartile 1 Quartile 2 Quartile 3 Quartile 4 p value*
Healthy pattern Age† (years)
Body mass index† (kg/m2) Energy intake (kcal/day)
Family history of colorectal cancer (%) Sedentary lifestyle† (%)
No high education (%) Current smokers† (%) Former smokers† (%) Adenoma (no. (%))
High-risk adenoma (no. (%)) Colorectal cancer (no. (%))
52.7 (6.9) 22.5 (3.2) 1,853.3 (510.0) 12.41 44.11 13.40 15.20 19.49 124 (2.33) 46 (0.92) 48 (0.07) 52.8 (6.7) 22.8 (3.2) 1,967.9 (500.6) 12.34 37.41 11.32 13.90 22.36 132 (2.48) 42 (0.84) 45 (0.07) 52.8 (6.6) 23.1 (3.3) 2,065.1 (516.3) 12.76 34.60 10.84 13.70 23.98 140 (2.63) 46 (0.92) 40 (0.06) 52.7 (6.4) 23.6 (3.6) 2,229.2 (551.6) 11.96 30.61 10.87 14.24 26.17 120 (2.26) 41 (0.82) 39 (0.06) 0.30 <0.001 <0.001 0.41 <0.001 <0.001 0.01 0.01 0.19 0.27 0.28 Western pattern Age† (years)
Body mass index† (kg/m2) Energy intake (kcal/day)
Family history of colorectal cancer (%) Sedentary lifestyle† (%)
No high education (%) Current smokers† (%) Former smokers† (%) Adenoma (no. (%))
High-risk adenoma (no. (%)) Colorectal cancer (no. (%))
54.5 (6.8) 23.3 (3.4) 1,555.4 (356.3) 12.28 38.78 13.31 15.11 24.72 133 (2.50) 45 (0.90) 42 (0.06) 53.4 (6.7) 23.0 (3.2) 1,858.5 (339.0) 12.72 37.07 11.44 13.79 22.07 123 (2.31) 46 (0.92) 40 (0.06) 52.2 (6.5) 22.8 (3.2) 2,124.4 (362.6) 12.23 35.42 10.88 13.70 22.76 134 (2.52) 46 (0.92) 53 (0.08) 50.8 (6.0) 23.0 (3.5) 2,577.2 (470.3) 12.24 35.46 10.82 14.44 22.45 126 (2.37) 38 (0.76) 37 (0.05) <0.001 <0.001 <0.001 0.58 <0.001 <0.001 0.08 0.01 0.97 0.57 0.94 Drinker pattern Age† (years)
Body mass index† (kg/m2) Energy intake (kcal/day)
Family history of colorectal cancer (%) Sedentary lifestyle† (%)
No high education (%) Current smokers† (%) Former smokers† (%) Adenoma (no. (%))
High-risk adenoma (no. (%)) Colorectal cancer (no. (%))
54.0 (6.9) 22.6 (3.2) 2,088.1 (523.5) 12.37 38.20 12.78 6.30 16.63 124 (2.33) 47 (0.94) 37 (0.05) 53.0 (6.7) 22.9 (3.3) 1,947.2 (509.5) 12.40 37.25 12.12 10.92 21.63 130 (2.44) 39 (0.78) 47 (0.07) 52.3 (6.5) 23.1 (3.4) 1,968.7 (525.5) 12.03 35.77 11.21 15.65 25.37 119 (2.24) 42 (0.84) 50 (0.07) 51.7 (6.2) 23.4 (3.5) 2,111.5 (571.9) 12.67 35.51 10.33 24.25 28.42 143 (2.69) 47 (0.94) 38 (0.06) <0.001 <0.001 <0.001 0.64 <0.001 <0.001 <0.001 <0.001 0.05 0.43 0.83 Meat eaters pattern
Age† (years)
Body mass index† (kg/m2) Energy intake (kcal/day)
Family history of colorectal cancer (%) Sedentary lifestyle† (%)
No high education (%) Current smokers† (%) Former smokers† (%) Adenoma (no. (%))
High-risk adenoma (no. (%)) Colorectal cancer (no. (%))
53.0 (6.6) 22.5 (3.1) 1,886.5 (534.8) 11.85 32.14 9.64 15.62 24.58 111 (2.09) 37 (0.74) 29 (0.04) 53.0 (6.7) 22.8 (3.2) 1,932.5 (503.9) 11.91 35.47 11.06 14.15 23.11 143 (2.69) 55 (1.10) 36 (0.05) 52.7 (6.6) 23.1 (3.3) 2,044.0 (505.0) 12.61 37.85 12.06 13.49 22.21 126 (2.37) 38 (0.76) 55 (0.08) 52.4 (6.5) 23.8 (3.6) 2,252.4 (531.8) 13.10 41.27 13.67 13.80 22.12 136 (2.56) 45 (0.90) 52 (0.08) <0.001 <0.001 <0.001 <0.001 <0.001 <0.001 <0.001 <0.001 0.22 0.75 0.003 * χ2 test for ordinal qualitative variables and linear regression for continuous variables.
† At baseline.
Association between dietary patterns and risk of colorectal tumors
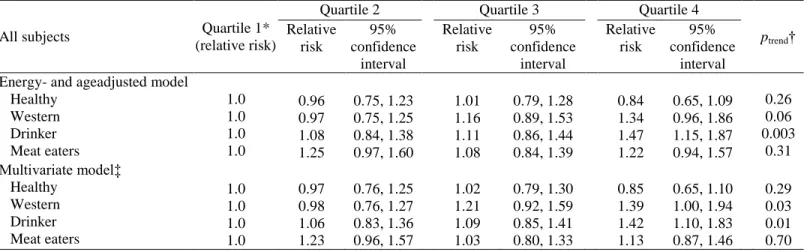
The relation between quartiles of scores of dietary patterns and the risk of overall adenoma is presented in table 3. A weak nonsignificant decrease in risk of adenoma was associated with a high score for the healthy
pattern with a multivariate relative risk of 0.85 (95 percent confidence interval: 0.65, 1.10) for the fourth compared with the first quartile. The Western and the drinker patterns were significantly associated with a higher risk of adenoma, with multivariate relative risks for the fourth versus first quartiles of 1.39 (95 percent confidence interval: 1.00, 1.94; ptrend = 0.03) and 1.42 (95 percent confidence interval: 1.10, 1.83; ptrend = 0.01),
respectively. In models stratified on age at baseline, no clear relation was observed between dietary patterns and risk of adenomas for women less than 51 years. In women aged 51 years or more (findings not tabulated), there was an increase in risk for subjects with high scores for the Western pattern (for quartile 4 vs. quartile 1: multivariate relative risk (RR) = 1.92, 95 percent confidence interval: 1.25, 2.97; ptrend = 0.005) and the drinker
pattern (for quartile 4 vs. quartile 1: multivariate RR = 1.37, 95 percent confidence interval: 0.99, 1.88; ptrend =
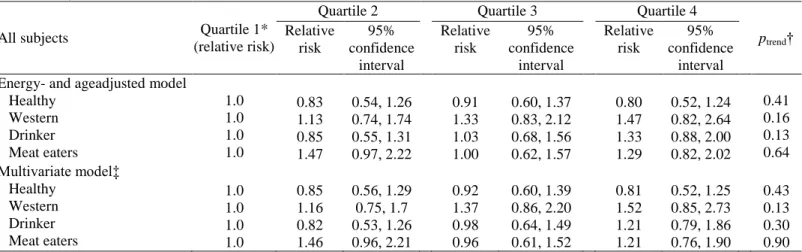
0.05). Regarding high-risk adenomas (table 4), we observed a nonsignificant increase in risk for subjects with high scores for the Western pattern (for quartile 4 vs. quartile 1: multivariate RR = 1.52, 95 percent confidence interval: 0.85, 2.73; ptrend = 0.13). This relation became statistically significant in women aged 51 or more years
(findings not tabulated), with a multivariate relative risk for the fourth versus first quartile = 2.27 (95 percent confidence interval: 1.06, 4.84; ptrend = 0.03). Relations between dietary patterns and colorectal cancer risk
according to age and site are presented in table 5. No clear association was found between colorectal cancer risk and the healthy, Western, or drinker patterns. A significant association was observed with the meat eaters pattern, with a multivariate relative risk for the upper versus lower quartile of 1.58 (95 percent confidence interval: 0.98, 2.53; ptrend = 0.02). All results were similar when all four patterns were included simultaneously in
the models.
TABLE 3. Relative risks of adenomas associated with quartiles of factor scores for each pattern, France, 1993–1997
All subjects Quartile 1*
(relative risk)
Quartile 2 Quartile 3 Quartile 4
ptrend† Relative risk 95% confidence interval Relative risk 95% confidence interval Relative risk 95% confidence interval Energy- and ageadjusted model
Healthy Western Drinker Meat eaters 1.0 1.0 1.0 1.0 0.96 0.97 1.08 1.25 0.75, 1.23 0.75, 1.25 0.84, 1.38 0.97, 1.60 1.01 1.16 1.11 1.08 0.79, 1.28 0.89, 1.53 0.86, 1.44 0.84, 1.39 0.84 1.34 1.47 1.22 0.65, 1.09 0.96, 1.86 1.15, 1.87 0.94, 1.57 0.26 0.06 0.003 0.31 Multivariate model‡ Healthy Western Drinker Meat eaters 1.0 1.0 1.0 1.0 0.97 0.98 1.06 1.23 0.76, 1.25 0.76, 1.27 0.83, 1.36 0.96, 1.57 1.02 1.21 1.09 1.03 0.79, 1.30 0.92, 1.59 0.85, 1.41 0.80, 1.33 0.85 1.39 1.42 1.13 0.65, 1.10 1.00, 1.94 1.10, 1.83 0.87, 1.46 0.29 0.03 0.01 0.70 * Quartile 1 = referent category.
† Wald test.
‡ Adjustment for daily energy intake (kcal/day), body mass index (kg/m2), physical activity level (low, medium, high), tobacco status (never/current/former smokers), family history of colorectal cancer (yes/no), and high education (yes/no).
DISCUSSION
Our data are the first to describe relations between dietary patterns and colorectal tumors at the various stages of the adenoma-carcinoma pathway in a prospective study. In this large cohort of French women, we observed an increased risk of adenomas with high scores of the Western and drinker dietary patterns, while a protective effect of the healthy pattern was only suggested. High-risk adenomas were positively associated with only the Western pattern in older women. The meat eaters pattern was associated with an increased risk of colorectal cancer. The associations of patterns with risk were stronger in women over the age of 51 years (the median age in our population) than in younger women; this is consistent with the hypothesis that the genetic component of risk is stronger in younger women, while the part attributable to environmental factors such as diet is stronger in older women. It is noteworthy that our median age of 51 years was close to the 50-year median age at menopause; an effect modification by menopause cannot therefore be ruled out and should be explored in further larger-scale studies. Generalizability of the defined patterns may be discussed, as our cohort was based
on volunteers who had a higher level of education than the general French population. However, patterns similar to some of ours were already described in previous studies (18, 20), adding to the consistency of our findings. An excessive homogeneity of our population is a potential limitation of our study, as it may be responsible for a lack of power for demonstrating relations between tumors and patterns, especially for the healthy pattern.
TABLE 4. Relative risks of high-risk adenomas associated with quartiles of factor scores for each pattern, France, 1993–1997
All subjects Quartile 1*
(relative risk)
Quartile 2 Quartile 3 Quartile 4
ptrend† Relative risk 95% confidence interval Relative risk 95% confidence interval Relative risk 95% confidence interval Energy- and ageadjusted model
Healthy Western Drinker Meat eaters 1.0 1.0 1.0 1.0 0.83 1.13 0.85 1.47 0.54, 1.26 0.74, 1.74 0.55, 1.31 0.97, 2.22 0.91 1.33 1.03 1.00 0.60, 1.37 0.83, 2.12 0.68, 1.56 0.62, 1.57 0.80 1.47 1.33 1.29 0.52, 1.24 0.82, 2.64 0.88, 2.00 0.82, 2.02 0.41 0.16 0.13 0.64 Multivariate model‡ Healthy Western Drinker Meat eaters 1.0 1.0 1.0 1.0 0.85 1.16 0.82 1.46 0.56, 1.29 0.75, 1.7 0.53, 1.26 0.96, 2.21 0.92 1.37 0.98 0.96 0.60, 1.39 0.86, 2.20 0.64, 1.49 0.61, 1.52 0.81 1.52 1.21 1.21 0.52, 1.25 0.85, 2.73 0.79, 1.86 0.76, 1.90 0.43 0.13 0.30 0.90 * Quartile 1 = referent category.
† Wald test.
‡ Adjustment for daily energy intake (kcal/day), body mass index (kg/m2), physical activity level (low, medium, high), tobacco status (never/current/former smokers), family history of colorectal cancer (yes/no), and high education (yes/no).
TABLE 5. Relative risks of colorectal cancer associated with quartiles of factor scores for each pattern, France, 1993–2000
All subjects Quartile 1*
(relative risk)
Quartile 2 Quartile 3 Quartile 4
ptrend† Relative risk 95% confidence interval Relative risk 95% confidence interval Relative risk 95% confidence interval Energy- and ageadjusted model
Healthy Western Drinker Meat eaters 1.0 1.0 1.0 1.0 0.93 1.05 1.43 1.19 0.62, 1.39 0.68, 1.61 0.93, 2.20 0.73, 1.95 0.83 1.57 1.65 1.85 0.55, 1.27 1.04, 2.36 1.08, 2.53 1.18, 2.90 0.83 1.29 1.37 1.78 0.54, 1.26 0.83, 2.02 0.87, 2.16 1.13, 2.81 0.32 0.08 0.12 0.003 Multivariate model‡ Healthy Western Drinker Meat eaters 1.0 1.0 1.0 1.0 0.92 0.99 1.48 1.16 0.61, 1.38 0.63, 1.56 0.96, 2.29 0.71, 1.90 0.81 1.44 1.72 1.74 0.53, 1.23 0.90, 2.31 1.12, 2.66 1.10, 2.73 0.77 1.09 1.36 1.58 0.49, 1.20 0.60, 2.00 0.85, 2.17 0.98, 2.53 0.20 0.40 0.13 0.02 * Quartile 1 = referent category.
† Wald test.
‡ Adjustment for daily energy intake (kcal/day), body mass index (kg/m2), physical activity level (low, medium, high), tobacco status (never/current/former smokers), family history of colorectal cancer (yes/no), and high education (yes/no).
For this study, we had excluded all cases of prevalent tumors at baseline in order to produce patterns from the diet of cancer-free subjects. Recall bias was avoided by the prospective design of the E3N-EPIC study. The high educational level and strong involvement of the participants, as highlighted by a 85 percent response rate after 10 years of follow-up, accounted for the good quality and reproducibility of the dietary data (23). Regarding the adenoma study, bias was limited by histologic confirmation of all cases and inclusion of polyp-free subjects as noncases, in order to avoid misclassification of noncases and to control for surveillance bias. Because adenomatous polyps are asymptomatic tumors, some of the adenoma subjects may have had their
adenomas at the time of the dietary interview, resulting in some misclassification of the time at risk. An accurate classification of time at risk would be very difficult to achieve; it would require a baseline polyp-free colonoscopy in all cohort subjects and then regular follow-up colonoscopies. However, only major changes in the diet of a large proportion of adenoma subjects would hamper a study such as ours, which are unlikely to have occurred as subjects were unaware of their having a polyp. The 6.3-year follow-up in the cancer analysis and 3.3-year follow-up in the adenoma analysis were relatively short, resulting in a limited number of cases and reduced statistical power. However, because events in the adenoma-carcinoma sequence are separated by 3- to 5-year periods (27, 28), this short follow-up period may be an advantage in that exposure likely corresponds to the studied step of the adenoma-carcinoma sequence. Traditionally, associations between diet and diseases are investigated through the analysis of selected nutrients or foods. Recently, the more global approach of dietary pattern assessment has emerged, including ‘‘a posteriori’’ analyses such as cluster and factor analyses and ‘‘a priori’’ analyses based on dietary recommendations (12). These studies classify people according to a global food consumption behavior, while the nutrient-food approach may be easier for interpretability and understanding of the mechanisms involved (29). The identification of dietary patterns by factor analysis has some limitations (12, 30), in particular as it involves subjective decisions such as the choice and definition of the food groups included in the factor analysis step, the number of components to extract, and the labeling of the identified patterns (31). In a recent review, Newby et al. (32) demonstrated the stability over time of dietary patterns derived from factor analysis, as well as reproducibility across populations, especially regarding major patterns such as healthy and Western. In our study, we identified a typical Western pattern, as previously described (32, 33), that was associated with adenomas but also a pattern characterized mostly by high meat intake, thus sharing only part of the characteristics of a usual Western diet, which was associated mainly with colorectal cancer.
In a US case-control study (16, 33), a Western pattern characterized by a high consumption of processed meat, organ meats, red meat, fast-food meat, eggs, butter, margarine, high-fat dairy foods, coffee, canned fruit, nuts, legumes, potatoes, high-sugar drinks, and high-sugar desserts was associated with a high risk of colon cancer in women. A prudent pattern, correlated with fresh juice, legumes, cruciferous vegetables, salad, carrots/tomatoes, and other vegetables, was associated with decreased risk, in agreement with our findings. Similarly, in the Nurses’ Health Study (16), a Western pattern was positively associated with the risk of colon cancer, while the protective effect of a prudent pattern was suggested. In a Swedish study (17), there was a nonstatistically significant negative association between the risk of colorectal cancer and the healthy pattern. In the opposite, in a country-specific analysis of four European cohort studies (DIETSCAN) (14), two common dietary patterns, i.e., vegetables and pork–processed meats–potatoes, were identified, but they were not consistently associated with colorectal cancer risk. Fewer studies have attempted to describe the relation between dietary patterns and colorectal adenomas. In a casecontrol study, a pattern defined by cluster analysis and characterized by a high consumption of bread, pork, oils other than olive oil, wine, starchy foods, and high-fat processed meat and a low consumption of fruit and vegetables was associated with an increased risk of both colorectal adenomas and cancers (18). In an intervention study on adenoma recurrence, high scores of a pattern characterized by a high consumption of oil, vegetables, fruit, legumes, and poultry tended to be associated with a decreased risk of adenoma recurrence in the left colon (20). Only one prospective study, in Japanese men, described associations between dietary patterns and colorectal adenomas. A significant inverse association was observed with a high-dairy, high-fruit and vegetables, high-starch, and low-alcohol pattern (19). Our findings are consistent with the most commonly described relations between colorectal tumors and diet. Adenomas, the precursor lesions to most colorectal cancers, have been found to be associated with a diet low in folate and high in alcohol (34, 35), low in dietary fiber (36), and low in fruit and vegetables (37), in agreement with the observed association with the Western and drinker patterns. The positive association between the meat eaters pattern and risk of colorectal cancer can be explained by an effect of red meat and processed meat on colorectal carcinogenesis (4, 11). Mechanisms underlying such a relation involve their content in fat, heme iron, N-nitroso compounds, heterocyclic amines, and polycyclic aromatic hydrocarbons due to cooking at high temperature (4, 11). Although our findings did not reach significance regarding the effect of our healthy pattern on the risk of colorectal tumors, the observed trend toward lower risks is consistent with a protective effect of fruit and vegetables on the risk of colorectal tumors (2). Vegetables and fruit are rich in fiber, antioxidant vitamins, folic acid, carotenoids, and other phytochemical compounds, which may yield beneficial properties and act in a synergic way against colorectal carcinogenesis.
In conclusion, our findings are consistent with a deleterious effect of patterns associated with a Western way of life—high in fats, animal products, and snacks and low in products of vegetable origin—on colorectal carcinogenesis. We observed some differences between the patterns associated with adenomas and those with cancer; this is not unexpected, as some cancers may not arise from an adenoma, and only a limited proportion of subjects with adenomas will eventually have cancer. Among subjects with Western dietary habits, those with a high meat intake may be particularly at risk of malignant transformation. These patterns may help to identify groups at high risk for whom prevention strategies may be particularly relevant.
Acknowledgments
The study was supported by the French League against Cancer, the European Community, the 3M Company, the Mutuelle Générale de l’Education Nationale, the Institut Gustave Roussy, and the Institut National de la Santé et de la Recherche Médicale.
The authors are grateful to all pathologists, practitioners, and medical personnel for providing pathology reports and to Rafika Chaït and Yann Follain for recording them. They are grateful to Lyan Hoang and Laurent Orsi for their technical assistance and to all the members of the E3N group.
Conflict of interest: none declared.
References
1. Potter JD. Colorectal cancer: molecules and populations. J Natl Cancer Inst 1999;91:916–32.
2. Riboli E, Norat T. Epidemiologic evidence of the protective effect of fruit and vegetables on cancer risk. Am J Clin Nutr 2003;78(suppl):559S–69S.
3. Gatof D, Ahnen D. Primary prevention of colorectal cancer: diet and drugs. Gastroenterol Clin North Am 2002;31:587–623, xi.
4. Norat T, Lukanova A, Ferrari P, et al. Meat consumption and colorectal cancer risk: dose-response meta-analysis of epidemiological studies. Int J Cancer 2002;98:241–56.
5. Key TJ, Allen NE, Spencer EA, et al. The effect of diet on risk of cancer. Lancet 2002;360:861–8.
6. Glade MJ. Food, nutrition, and the prevention of cancer: a global perspective. American Institute for Cancer Research/ World Cancer Research Fund, American Institute for Cancer Research, 1997. Nutrition 1999;15:523–6. 7. Nutritional aspects of the development of cancer. Report of the Working Group on Diet and Cancer of the
Committee on Medical Aspects of Food and Nutrition Policy. Rep Health Soc Subj (Lond) 1998;48:i–xiv, 1–274. 8. Schottenfeld D, Fraumeni JF. Cancer epidemiology and prevention. New York, NY: Oxford University Press,
1996.
9. Norat T, Riboli E. Dairy products and colorectal cancer. A review of possible mechanisms and epidemiological evidence. Eur J Clin Nutr 2003;57:1–17.
10. Chao A, Thun MJ, Connell CJ, et al. Meat consumption and risk of colorectal cancer. JAMA 2005;293:172–82. 11. Norat T, Bingham S, Ferrari P, et al. Meat, fish, and colorectal cancer risk: the European Prospective Investigation
into Cancer and Nutrition. J Natl Cancer Inst 2005;97:906–16.
12. Hu FB. Dietary pattern analysis: a new direction in nutritional epidemiology. Curr Opin Lipidol 2002;13:3–9. 13. Slattery ML, Edwards SL, Boucher KM, et al. Lifestyle and colon cancer: an assessment of factors associated with
risk. Am J Epidemiol 1999;150:869–77.
14. Dixon LB, Balder HF, Virtanen MJ, et al. Dietary patterns associated with colon and rectal cancer: results from the Dietary Patterns and Cancer (DIETSCAN) Project. Am J Clin Nutr 2004;80:1003–11.
15. Slattery ML. Diet, lifestyle, and colon cancer. Semin Gastrointest Dis 2000;11:142–6.
16. Fung T, Hu FB, Fuchs C, et al. Major dietary patterns and the risk of colorectal cancer in women. Arch Intern Med 2003;163:309–14.
17. Terry P, Hu FB, Hansen H, et al. Prospective study of major dietary patterns and colorectal cancer risk in women. Am J Epidemiol 2001;154:1143–9.
18. Rouillier P, Senesse P, Cottet V, et al. Dietary patterns and the adenomacarcinoma sequence of colorectal cancer. Eur J Nutr 2005;44:311–18.
19. Mizoue T, Yamaji T, Tabata S, et al. Dietary patterns and colorectal adenomas in Japanese men: the Self-Defense Forces Health Study. Am J Epidemiol 2005;161:338–45.
20. Cottet V, Bonithon-Kopp C, Kronborg O, et al. Dietary patterns and the risk of colorectal adenoma recurrence in a European intervention trial. Eur J Cancer Prev 2005;14:21–9.
21. Clavel-Chapelon F. Cumulative number of menstrual cycles and breast cancer risk: results from the E3N cohort study of French women. Cancer Causes Control 2002;13:831–8.
22. Riboli E. Nutrition and cancer: background and rationale of the European Prospective Investigation into Cancer and Nutrition (EPIC). Ann Oncol 1992;3:783–91.
23. van Liere MJ, Lucas F, Clavel F, et al. Relative validity and reproducibility of a French dietary history questionnaire. Int J Epidemiol 1997;26(suppl 1):S128–36.
24. Lucas F, Niravong M, Villeminot S, et al. Estimation of food portion size using photographs: validity, strength, weaknesses and recommendations. J Hum Nutr Diet 1995;8:65–74.
25. Neugut AI, Jacobson JS, De Vivo I. Epidemiology of colorectal adenomatous polyps. Cancer Epidemiol Biomarkers Prev 1993;2:159–76.
26. Bedenne L, Faivre J, Boutron MC, et al. Adenoma–carcinoma sequence or ‘‘de novo’’ carcinogenesis? A study of adenomatous remnants in a population-based series of large bowel cancers. Cancer 1992;69:883–8.
27. Peipins LA, Sandler RS. Epidemiology of colorectal adenomas. Epidemiol Rev 1994;16:273–97.
28. Prevost TC, Launoy G, Duffy SW, et al. Estimating sensitivity and sojourn time in screening for colorectal cancer: a comparison of statistical approaches. Am J Epidemiol 1998;148:609–19.
29. Jacobs DR Jr, Steffen LM. Nutrients, foods, and dietary patterns as exposures in research: a framework for food synergy. Am J Clin Nutr 2003;78(suppl):508S–13S.
30. Jacques PF, Tucker KL. Are dietary patterns useful for understanding the role of diet in chronic disease? Am J Clin Nutr 2001;73:1–2.
31. Martinez ME, Marshall JR, Sechrest L. Invited commentary: factor analysis and the search for objectivity. Am J Epidemiol 1998;148:17–19.
32. Newby PK, Weismayer C, Akesson A, et al. Long-term stability of food patterns identified by use of factor analysis among Swedish women. J Nutr 2006;136:626–33.
33. Slattery ML, Boucher KM, Caan BJ, et al. Eating patterns and risk of colon cancer. Am J Epidemiol 1998;148:4– 16.
34. Giovannucci E, Chen J, Smith-Warner SA, et al. Methylenetetrahydrofolate reductase, alcohol dehydrogenase, diet, and risk of colorectal adenomas. Cancer Epidemiol Biomarkers Prev 2003;12:970–9.
35. Giovannucci E, Stampfer MJ, Colditz GA, et al. Folate, methionine, and alcohol intake and risk of colorectal adenoma. J Natl Cancer Inst 1993;85:875–84.
36. Peters U, Sinha R, Chatterjee N, et al. Dietary fibre and colorectal adenoma in a colorectal cancer early detection programme. Lancet 2003;361:1491–5.
37. Mathew A, Peters U, Chatterjee N, et al. Fat, fiber, fruits, vegetables, and risk of colorectal adenomas. Int J Cancer 2004;108:287–92.