A Clinician-mediated, Longitudinal Tracking System
for the Follow-up of Clinical Results
by
Daniel Todd Rosenthal
B.S., Biology (1997)
Duke University
M.D. (2001)
University of South Florida College of Medicine Submitted to the Health Sciences and Technology Division
and the Division of Biomedical Informatics in Partial Fulfillment of the Requirements for the Degree of Master of Science in Biomedical Informatics
at the
Massachusetts Institute of Technology
May 16, 2005 3u e a z0i 7j
© 2005 Daniel Rosenthal. All rights reserved.
The author hereby grants M.I.T. permission to reproduce and distribute publicly paper and electronic copies of this thesis and to grant others the right to do so.
Signature
of Author ...
...
...
Health Sciences and Technology
Mav 16, 2005
Certified by ...
/
Henry Chueh M.D., M.S. Assistant Professor of Medicine, Harvard Medical School Thesis SupervisorAccepted by ... ... ...
Martha L. Gray Ph.D. Edward Hood Taplin Professor of Medical and Electrical ngineering Co-director, Harvard-MIT Division of Health Sciences and Technology
A Clinician-mediated, Longitudinal Tracking System
for the Follow-up of Clinical Results
by
Daniel Todd Rosenthal
Submitted to the Health Sciences and Technology Division and the Division of Biomedical Informatics
May 16, 2005
In Partial Fulfillment of the Requirements for the Degree of Master of Science in Biomedical Informatics at the
Massachusetts Institute of Technology
ABSTRACT
Failure to follow-up on abnormal tests is a common clinical concern comprising the quality of care. Although many clinicians track their patient follow-up by scheduling follow-up visits or by leaving physical reminders, most feel that automated, computerized systems to track abnormal test results would be useful. While existing clinical decision support systems and computerized clinical reminders focus on providing assistance with choosing the appropriate follow-up
management, they fail by not tracking that follow-up effectively. We believe that clinicians do
not want suggestions how to manage their patients, but instead want help tracking follow-up results once they have decided the management plan. We believe that a well-designed system
can successfully track this follow-up and only require a small amount of information and time
from the clinician. We have designed and implemented a complete tracking system including 1)
an authoring tool to define tracking guidelines, 2) a query tool to search electronic medical
records and identify patients without follow-up, and 3) a clinical tool to send reminders to clinicians and allow them to easily choose the follow-up management. Our tracking system has made improvements on previous reminder systems by 1) using our unique risk-management guideline model that more closely mirrors, yet does not attempt to replicate, the clinical decision process, 2) our use of massive population-based queries for tracking all patients simultaneously, and 3) our longitudinal approach that documents all steps in the patient follow-up cycle. With
these developments, we are able to track 450 million pieces of clinical data for 1.8 million patients daily.
Keyword follow-up tracking; reminder system; preventive medicine; computerized medical
record system; practice guidelines; clinical decision support system
Thesis Supervisor: Henry Chueh M.D., M.S.
Table of Contents
1 Introduction ... 4
2 Background ... 6
2.1 Preventive M edicine & Appropriate Follow-up ... 6
2.2 Case Study ... 7
2.2.1 Background ... 7
2.2.2 M ethods ... 7...
2.2.3 Results ... 8
2.2.4 Im plications ... 8
2.3 Identifying Patients without Follow-up ... 9
2.4 Representing Logic ... 10
2.5 Guidelines ... I11 2.6 Com puterized Clinical Rem inders ... 12
2.7 Barriers to Guidelines and Resulting Rem inders ... 12
2.8 Goals for Tracking System ... 13
2.8.1 Risk-M anagem ent Stratification ... 13
2.8.2 Tim ing of Intervention ... 14
2.8.3 Scope and Scale ... 14
3 Design ... 15
3.1 G uideline M odel ... 15
3.2 Clinical Elem ent Dictionary ... 16
3.3 Patient D ata ... 17
3.4 Identifying Patient Sets ... 17
3.5 Rem inder grouping ... 18
3.6 Application Architecture ... 19
4 Im plem entation ... ... 21
4.1 Tracker Authoring Tool ... ... ... 222... 4.2 Tracker Query Tool ... . 25
4.2.1 Gather Patient Data ... 26
4.2.2 Construct SQ L From Tracker Logic ... 26
4.2.3 Planned Versus Completed Follow-up Scores ... 29
4.3 Tracker Clinical Tools ... ...30
4.3.1 Clinical Services ... 30
4.3.2 Inbox Application ... 32
5 Discussion ... 34
1 Introduction
The failure to successfully apply evidenced-based guidelines to the prevention and management of disease has been described as the "quality chasm" by the Institute of Medicine (IOM).[1] Important factors contributing to this "knowledge-performance" gap in delivering quality care include time limitations during the clinical encounter,[2] difficulty managing an increasing burden of clinical data,[3] and lack of appropriate follow-up of abnormal results.[4]
Clinical decision support systems (CDSS) have shown some success improving adherence to
guidelines. [5] In addition, computerized clinical reminder (CCR) systems have shown promise; however they are historically "real-time" tools, making recommendations to the provider with the patient present at the point-of-care. Alternatively, other applications have shown success improving guideline adherence by delivering recommendations to the provider "asynchronously" between patient visits. [6]
While these advances aim to improve the quality of care, they also contribute to the increasing volume of data presented to clinicians. In the outpatient setting, the average clinician cares for several hundred patients who often have only one or two office visits each year. With the increasing amount of
information to manage, failure to follow-up on abnormal tests is a common clinical concern comprising the quality of care. Furthermore, this failure to follow-up is a significant source of malpractice litigation in outpatient medicine. Currently, providers remember to check follow-up by either a) scheduling a follow-up visit, b) writing a physical note, c) leaving the patient's chart on their desk, or d) manually setting a reminder using an electronic resource such as a calendar program. Providers feel that automated systems to track abnormal test results would be useful. [7]
Our goal was to produce a follow-up tracking system. While existing CDSS and CCR systems focus on providing assistance with choosing the appropriate follow-up management, they fail by not tracking that follow-up. We believe that clinicians do not want suggestions how to manage their patients at the point-of-care, but instead want help tracking follow-up management once the patient has left the office.
We designed our system to reflect this philosophical difference by changing the focus from point-of-care suggestions to follow-up tracking. Our tracking guidelines do not attempt to replicate the decision process, but instead focus on representing all plausible follow-up choices to allow for easy selection for disease follow-up. We are able to catch patients who may fall through the proverbial cracks of follow-up by using a population searching approach rather than tracking patients individually. We search all electronic health records and administrative claims databases to identify groups of patients who need follow-up, send reminders to the clinicians, and then track the follow-up.
Our tracking system provides the solutions to the process of follow-up care (Figure 1) including 1) a unique guideline model created specifically for ease of follow-up tracking, 2) a population-based search engine that identifies sets of patient without follow-up, and 3) a notification tool that clinicians use to view new results and choose follow-up management. Our system then tracks these follow-up plans, continually searches the patient records, and notifies clinicians if follow-up has been missed. We describe the tracking system we created.
Icted) identify
patients
iVmedical exiperts (l, eflt'A...fnc at risk iqucnt) icenttracker
guideline t IIIJ l LCfollow-up
-cords (followv-up nccdcd) \Ynotify
clinicians iO clinicians planfollow-up
Figure 1. Process of Follow-up Care.
To effectively track patients and their follow-up, a system must 1) define what patients require follow-up, 2) search medical records and identify those patients, 3) notify their clinicians, then 4) track their follow-up management. This entire process needs to be repeated frequently and reliably to catch all patients who are missing follow-up. i i i I i i 1 ·, ·: ·
2 Background
2.1 Preventive Medicine & Appropriate Follow-up
Prevention is increasingly the goal of health care delivery. Prevention strategies differ according to when the preventive action is taken during the disease process, including primary, secondary, and tertiary prevention. Primary prevention occurs before a disease begins to develop. Examples of primary prevention include immunizations and health counseling. Secondary prevention occurs after a disease has begun to develop but prior to symptoms. Most cancer screening programs fall into the category of secondary prevention because they aim to detect existing cancers while the patients are still asymptomatic
and unaware of the cancer. In cancer cases this is particularly important as early detection often yields
better prognoses. Lastly, tertiary prevention occurs after a disease has developed. While primary prevention may prevent disease and secondary prevention may minimize the impact of an early
developing disease, tertiary prevention aims to reduce the negative effects of an existing disease. Chronic disease management is an example of tertiary prevention, such as prevention of end-organ damage from poorly-managed diabetes or mortality from worsening heart disease. Prevention programs that are most successful have a significant public health impact, a long interval of disease progression, an established screening method to identify the target population, and an effective intervention.
However, these preventive efforts are frequently undermined by lack of timely follow-up. This is especially problematic when there is a lack of rapid follow-up in cancer screening. Reducing the burden of morbidity and mortality attributed to cancer have been a national health care priority in the United States for several decades, primarily through prevention. [8, 9] Great strides have been made in improving initial screening rates, but screening alone cannot prevent cancer. For screening to be effective, timely follow-up of abnormal findings is essential. Delays in follow-up and subsequent
treatment can decrease survival. Studies demonstrate that many individuals with abnormal screening tests do not receive this timely follow-up. In a study of women with abnormal screening mammograms, inadequate follow-up occurred in 18% of these women. [10] Other studies have suggested that non-white women may experience delays in addressing abnormal mammogram results. [11] In another case series, only 54% of women recommended to have mammographic surveillance after a percutaneous biopsy complied. [12] For cervical cancer screening, studies have shown that between 7 and 49% of women with abnormal Pap smear tests fail to receive appropriate follow-up.[13, 14] In a study of women diagnosed with invasive cervical cancer, 11% had failed to follow-up on a previous abnormal Pap smear. [15] In the Minnesota Colon Cancer Control Study, 5% of individuals with a positive fecal occult blood test (FOBT) did not complete follow-up with a physician. [16] In the Danish FOBT trial, 16% with an abnormal test did not have a complete colonoscopy performed. [17]
2.2 Case Study
2.2.1 Background
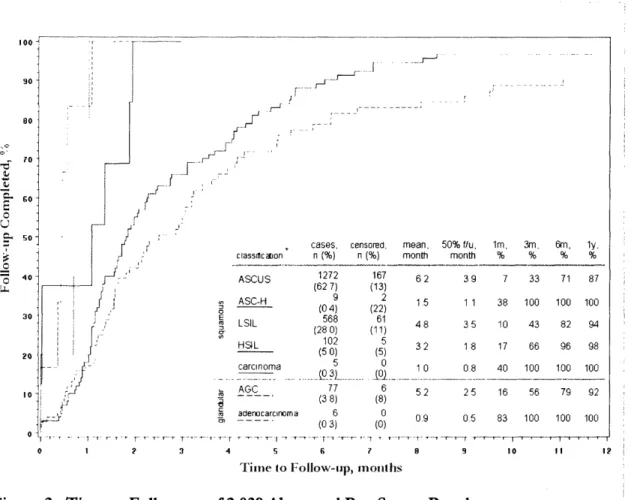
Clearly, effective cancer prevention requires screening and appropriate follow-up. For a disease specific needs assessment, we looked at follow-up rates for cervical cancer screening. In 2004, an estimated 10,520 new cases of invasive cervical cancer (ICC) will be diagnosed in the United States, and 3,900 women will die from the disease, accounting for 1.4% of cancer deaths among women. [18] The average latency period from the earliest detectible pre-malignant stage to invasive cervical cancer is between 10 and 20 years. [19] Papanicalou cytology (Pap smear) is the most effective screening test for pre-malignant cervical changes. Abnormal cells detected on Pap smear provide an opportunity for further diagnosis and treatment. Currently, nearly 9 3% of women in the United States report having at least one Pap smear in their lifetime.[20] While 2% of abnormal pap smears progress to ICC at 24 months,[19] in a 2004 case series 4% of women diagnosed with ICC had a history of an abnormal pap smear without appropriate follow-up in the following 6 months. [21] Thus, the continuing goal of ICC prevention is timely follow-up of abnormal results. Eighteen month follow-up of abnormal results range from 22% to 64%. [22] The goal of this case study is to characterize patterns of follow-up for different Pap smear results over a 4 year period within our own academic health center.
2.2.2 Methods
We analyzed 32,890 Pap smear reports from a cohort of 13,401 women cared for in the Massachusetts General Hospital (MGH) Internal Medicine Associates (IMA) primary care practice between January 1, 2001 and December 31, 2004. All available pathology reports during this period were retrieved from the Clinical Data Repository (CDR) and linked to demographic and administrative claims data from the Research Patient Data Repository (RPDR). We extracted and categorized data from Pap smear reports according to the Bethesda Classification of Cervical Cytology. Abnormal result categories included
atypical squamous cells of undetermined significance (ASCUS), atypical squamous cells unable to exclude
a high grade lesion (ASC-H), atypical glandular cells (AGC), low grade squamous intraepithelial lesion (LSIL), high grade squamous intraepithelial lesion (HSIL), squamous cell carcinoma, and
adenocarcinoma. We limited our data analysis to the 29,863 (91%) reports with cytology quality documented as "satisfactory." We defined the follow-up interval to be the time between the abnormal Pap smear result and a subsequent gynecology office visit or procedure, e.g. repeat Pap smear, human papillomavirus DNA assay, colposcopy, curettage, or biopsy. We chose to examine our data with survival analysis methods which allow censoring of patients lost to follow-up, thus removing them from the study population at the time contact was lost. This methodology identifies the patients lost to follow-up and includes the time follow-up until the loss of contact in our follow-follow-up timing estimates, providing a more accurate view of the actual follow-up trends. For example, if a patient did not receive follow-up for an abnormal Pap smear yet was seen in another MGH clinic 8 months later for an unrelated problem, those 8 months would be included in our analysis, but the patient would be removed from the analysis after that point, regardless of the total time that had passed since the Pap smear was performed. Patients who died before follow-up were censored at their date of death. Patients who did not receive follow-up were censored at the last date that an administrative claim was recorded anywhere within the MGH health care system. We used SAS for the survival analysis. To assess the stability of our data, we created several models by 1) redefining follow-up to include only gynecology procedures, 2) restricting the cases to include only new or progressive disease, and 3) redefining the censoring end date to include only office visits. Since follow-up rates and general trends did not significantly change with any of these alternate models, we chose the most inclusive model for our final analysis.
2.2.3 Results
Of the 32,890 clinical reports, 99.9% were cross-referenced in the administrative claims data, thus
validating the use of claims data in this cohort. Of the 29,863 (90.8%) satisfactory specimens, we were
able to classify 29,846 (99.9%) yielding 27,753 (92.9%) normal and 2,039 (6.8%) abnormal results (Figure
2).
100
90
00
cases censored. mean, 50% fi n (%) n (%) month mont 167 62 3 (13) 2 1.5 1 (22) 61 6(11 48 3 (11) 5 32 1 (5) 10 0 (0) 6 (8) 0 (0) 52 2 0.9 0 i, Im, 3m, 6m. ly, h % % % % 9 7 33 71 87 1 38 100 100 100 5 10 43 82 94 8 17 66 96 98 8 40 100 100 100 5 16 56 79 92 5 83 100 100 100 ---- - -- - -- -8 --7 8 9
Tilme to Follow-tlp, molhs
Figure 2. Time to Follow-up of 2,039 Abnormal Pap Smear Resul
10 I 12
Is.
* ASCUS: atypical squamous cells of undetermined significance; ASC-H: atypical squamous cells unable to
exclude a high grade lesion; LSIL: low grade squamous intraepithelial lesion; HSIL: high grade squamous intraepithelial lesion; AGC: atypical glandular cells.
Censoring accounted for 239 (11.7%) cases without follow-up and 2 deaths. Of these 239 cases, 55% did not have follow-up at 3 months, 3 5% at 6 months, 19% at one year, and 14% at 18 months. Of the remaining 1,798 (88.2%) cases with follow-up, ASC-H, carcinoma, and adenocarcinoma received the
timeliest follow-up with 100% by 3 months. ASCUS results received the slowest follow-up with 50% at
3.9 months, and 87% at 1 year. AGC, LSIL and HSIL received intermediate follow-up with 50%
between 1.8 and 3.5 months, and 92-98% at 1 year, resulting in 122 (16.4%) cases without follow-up at 6 months, and 42 (5.6%) cases at 1 year.
2.2.4 Implications
We identified sub-optimal follow-up of abnormal Pap smear results in a cohort of primary care patients cared for within our academic health system. Our definition of follow-up was chosen to be the most inclusive of all current practice patterns and includes any subsequent evaluation. However, this
70 GO 50 40 l T. © © Qi G 30 C lassic alon ASCUS ASC-H X LSIL HSIL carcinoma AGC_ C adenocarclnoma a _ I0 1272 (62 7) 9 (04) 568 (28 0) 102 (5 0) 5
1...03)
. ... . 77 (38) 6 (0 3) 2 3 4_____^__
--.IIIXIIII-- ---.. .... j r _ j _ - I $' --- I I I i r E F T--- --- - -r -- - - 1 -_ r-preliminary study does not comment on the appropriateness of such follow-up for a given clinical history and Pap smear result. Therefore actual appropriate follow-up rates would likely be lower than our
estimates, namely for the higher risk lesions of LSIL and HSIL. These empiric data provided justification for designing and implementing our tracking system for result follow-up.
2.3 Identifying Patients without Follow-up
The first task in such a tracking system is to identify at-risk patients without follow-up. This system should monitor these patients along the clinical care pathway (Figure 3).
risk
management
-. risk assessment diagnosis plan order - complete -- deliver results
-Figure 3. Clinical Care Pathway
During a clinical visit, the provider assesses the patient's risk of having a particular disease and decides a preliminary diagnosis. The clinician and patient then decide a management plan. From this point, there are many sequential tasks that need to be completed until these management results return back to the clinician. The process then reiterates with the new information, however with a time delay until this next visit.
To continue with the cervical cancer screening example, during an initial visit (ta) with a woman, they decide that she is at average, albeit low, risk for developing cervical cancer and they plan to perform cervical cancer screening according to national guidelines. The clinician performs the pelvic exam during the same visit and orders a Pap smear to pathology for evaluation. The remainder of the screening process then occurs without the patient present, asynchronously. At a later date, the pathologist examines the Pap smear and dictates a report which is then sent back to the primary care provider. This
process usually takes 1-2 weeks.
The clinical care pathway begins again when the clinician receives the report (tl). If it is abnormal, the woman's risk of developing cervical cancer increases. At this moment, the clinician processes the abnormal results within the context of the patient's clinical history and usually has a follow-up plan in mind for further diagnostic testing according to national guidelines, thus is a high-yield opportunity to begin tracking this follow-up process. Yet this plan is seldom recorded until the next patient visit. To complete the follow-up, the patient needs to be contacted, schedule a follow-up visit, decide a follow-up plan with the clinician and then execute this management of further testing. Due to the complex nature of asynchronous communications and scheduling, this follow-up cycle (t1) is prone to system errors and
delays. We believe clinicians benefit more from assistance at follow-up (t1) than during the initial visit at
We aim to facilitate patient tracking along this care pathway by identifying those at risk for disease who have not had follow-up. This process requires us to identify several sets of patients based on
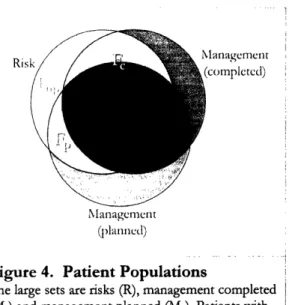
documented risk factors and recorded management actions (Figure 4).
1. R - patients at risk
As evident in the case study, it is plausible to identify these sets from existing data sources. The reason not all patients in Mc came from R is because sometimes management is completed without explicitly documenting risk factors.
T ·-. I
In additlon to completed management, it is important to also record management plans. Theoretically, if
systems could identify all risks and replicate the Ris decision process from diagnosis to plan, all
management could be predicted and successfully tracked. However, this task is complex and not practical to design reliably. Recording the provider plans provides a more reliable prediction of what management results should be performed. Furthermore patients with documented follow-up
lanagement I
:omplctcd)
plans snouuI DC racKcu ullercnIuy Lanl paucnts Wl11 NIanagcmnent
no follow-up plan at all. By recording documented (lallnc
follow-up plans, we can identify Mp. Not all patients in Mc are in Mp, because most patients receive
Figure 4. Patient Populations management without receiving documented plans. Figure 4. Patient Populations
The large sets are risks (R), management completed (Mc) and management planned (Mp). Patients with
3. MP - patients with documented, planned completed up are Fc; with planned
follow-management up are Fp; and no follow-up plan are Fnp.
From the sets R, Mp, and Mc, we can identify three follow-up sets. Patients at risk who have had completed follow-up, R n Mc, are F. For these patients, it is important to record when the follow-up was completed and not send a meaningless reminder to the clinician. Next, patients at risk with no completed management, yet who have a document follow-up plan, (R - Mc) n Mp, are Fp. It is important to track these patients to ensure their management plan is completed. The remaining at-risk patients, without completed or planned management, R - Mc - Mc, are Fnp. It is important to notify their clinicians of the lack of follow-up.
4. Fc - patients with documented, completed follow-up 5. Fp - patient with documented, planned follow-up 6. F,p - patients with no documented plan for follow-up
When a management plan is chosen, those patients move from Fnp to Fp. As time passes, if the planned management is performed, those patients move from Fp to F,. However if the management is not performed, those patients move from Fp back to Fn,. It is these patients who move back into Fnp that
become the subjects for delinquent management intervention.
As patients miss more follow-up attempts, more time elapses, diseases progress, and their prognoses worsen. Therefore, these delinquent management patients are the high-yield intervention patients, because the clinician has already decided on management, yet there has been a breakdown in the management pathway. To identify longitudinal errors in this pathway, it is important to maintain a history of how patients move between the three follow-up sets.
2.4 Representing Logic
Before we can begin to identify patients without follow-up, we need a formalism for describing the characteristics of these patient populations. Boolean logic provides such a formalism, using "and," "or," "not" and "if-then" logic represented symbolically by ^, v, -, and)-, respectively. A simple disease
process with only one management plan could be represented in English as "for all patients, if they match specific set of risk factors, then they should have a specific set of follow-up management."
R-
M
The resulting set of patients without follow-up is those with the risk factors and who have not had management.
R^ 'M
The risks can be defined as multiple risk groups joined by "or." Each risk group contains one or more clinical elements. For example, a risk group of men > 30 years-old or women > 40 years-old could be
represented as:
(gender="male" ^ age>"30") v (gender="female" ^ age>"40")
Logical clauses may be nested within one another, however most clinical logic is no more than a few
layers deep.
(gender="male" ^ (diagnosis="diabetes" v diagnosis="heart disease"))
Management choices contain similarly structured logic.
(procedure="sigmoidoscopy" v procedure="colonoscopy")
The ultimate structure of a tracker consists of risks and managements.
R(riskgroup, v ... riskgroups) - M(managementgroup v ... managementgroup)
Formalizing follow-up tracking as groups of patient sets defined by Boolean logic both mirrors the clinical decision process and is more easily converted into computerized guidelines and database searching programs.
2.5 Guidelines
Clinical care guidelines aim to document and disseminate best-practice patterns to clinicians as we learn more about successful health care delivery. Guidelines are usually consensus statements written by governmental organizations, medical societies, such as the American College of Cardiology, and hospitals. These groups gather data from previous medical studies in a process known as evidence based medicine (EBM), defined as "the conscientious, explicit, and judicious use of current best evidence in making decisions about the care of individual patients."[23] In the past decade, EBM has helped shape best-practice standards in delivering clinical care. [24]
Dissemination of these guidelines in an environment of rapidly changing clinical evidence has been a challenge for the medical community. As a result, in 1998 the Agency for Healthcare Research and Quality (AHRQ), a branch of the US Department of Health and Human Services, in conjunction with the American Medical Association (AMA), created the National Guideline Clearinghouse (NGC), a website of all published guidelines. Although the clearinghouse currently contains 1,552 guidelines, the
NGC does not choose which guidelines are representative for a given disease. Instead, it displays all pertinent guidelines and allows the clinicians to choose which guidelines to follow. Implementing these
guidelines in automated clinical systems can be problematic because they are often written in free-text which requires interpretation to local disease trends and are not structured for easy computer
interpretation.
To solve this problem, a longstanding goal of medical artificial intelligence has been to develop computer interpretable guidelines (CIG). Most computational models for representing and interpreting guidelines, including Arden, Asbru, EON, GEM, GLIF, GUIDE, Prodigy, Protege, and Proforma, use "if-then" logic powered from EMR data. [25] Most models try to represent the full clinical process, all decision steps, supporting patient data, and appropriate management options. The natural extension of these guidelines is to assist with quality healthcare delivery. One mechanism to encourage compliance with guidelines is electronic reminders.
2.6 Computerized Clinical Reminders
Preventive computerized clinical reminder (CCR) systems, working in conjunction with
guidelines, have been shown to be effective.[5] Reminders are often delivered by email,
alphanumeric pager, printed document, automated phone call, or during computer-based charting or order entry. In primary prevention, outpatient physician reminders increased use of
immunization services by an odds ratio of 3.80 (95% CI 3.31-4.37) in a review of 81 studies.[26]
In secondary prevention, evaluation of a reminder systems implemented at MGH in 1992
showed long-term changes in compliance with clinical guidelines over 5 years, including cervical
cancer screening (64% to 7 5%) and breast cancer screening (63% to 70%).[27] In Pittsburgh, a Veteran Affairs Hospital reminder system demonstrated an increase in prostate cancer screening
(17% to 86%) between 1998 and 2001 after implementing their system.[28] In tertiary
prevention, health practice organizations have begun to use clinical reminders to implement a
chronic care model at the primary care level, demonstrating significant quality improvement. [29]
Despite the success of these systems for basic reminders, little has been done using reminders to
track the follow-up process due to significant process barriers.
2.7 Barriers to Guidelines and Resulting Reminders
Although CIG and CCR systems have the potential to improve the quality of care, their actual effectiveness is diminished by both technological and clinician barriers. With so many versatile CIG models and formats, the main technological barrier to their adoption is not representing the guideline programmatically; rather it is logistic challenges in gathering supportive evidence to power the guideline logic. Clinical data is represented differently within each electronic health record (EHR). When a guideline is applied to local data, each term must be mapped accordingly. Even if this challenge could be easily overcome, the clinical data is often not recorded in the detail that the guidelines require. Diagnoses and some physical findings may be recorded in the EHR and contained in a problem list, however more specific details are frequently recorded in free-text and not codified. Therefore these guidelines often can not function without requiring the clinician to input further patient data, which interrupts an already busy office visit.
Even if we assume that guidelines can be mapped to local patient resources and all available patient data exists to power the guideline, the larger question remains regarding the usefulness of guidelines to experienced clinicians. While clinicians prefer to have reminders delivered during the clinical encounter, they tend not to interact with reminders that request further information, as it interrupts their clinical workflow. [30] Furthermore, CIG systems often generate reminders that are not specific to the patient
a patient, because the management had already been performed. In addition, clinicians are often aware of best-practice guidelines and feel CIG systems generate reminders that do not provide them with
additional information, but instead overwhelm them with requests that provide minimal additional value to their clinical care. CIG systems fail to deliver their intended outcome due to these technical issues and lack of clinician buy-in.
Previous efforts to develop these systems have focused on what is possible, rather than on what is needed. Simply because it can be done, does not mean that it should be done. Many guideline and reminder systems attempt to replicate the clinical decision process leaving clinicians with
recommendations that they usually already know. We believe the low-hanging fruit of reminder systems is not in making management suggestions; instead clinicians need assistance tracking the follow-up management results.
2.8 Goals for Tracking System
With these barriers in mind, we set out to develop a unique, population-based tracking system.
Successful guideline and reminder systems need to operate as an adjunct to the clinical process as opposed to a substitute. We set out to develop a tracker system that mirrors the bare essence of the clinical decision process, assists clinicians at the optimal time for intervention during the clinical care pathway, and can track unlimited patients and disease processes. Our system assists the busy clinician by tracking their intended follow-up, rather than simply suggesting a follow-up plan that the clinician already knows.
2.8.1 Risk-Management Stratification
While most guidelines attempt to assist providers with clinical decisions, we believe that clinicians would benefit more from tracking of follow-up once those decisions have been made. Only a small amount of information is required to begin the tracking process. The process of risk-management stratification requires the aggregation and processing of many risk
factnrs. nd then the selection of one or more of manv risk factors
management options. However, no matter how complicated the risk assessment, the clinical information
is always distilled to a single risk-management stratum
(Figure 5). The follow-up for a given stratum is often
1. I I 1. - I I~ I
lirmted to a handtul ot subsequent tests or procedures, risk-management stratum
-- -1- - - _- r _. r~~~~
~,
__ - _- rr-~
hot.8. aUllUrIIlal LII:bL -lrly / ccaiL -lay, LUiLPULLCU
tomography, or surgical consult; abnormal Pap smear -) repeat Pap smear, colposcopy, curettage, biopsy, or gynecology consultation; high LDL repeat LDL to
assess management effectiveness. These limited options
are thus easier to codify in guidelines and are usually management process-oriented and often available in administrative
claims data. Therefore, the most efficient entry point is Figure 5. Risk-Management Stratum
at the risk-management stratum, for it is the most broad A complex collection of risk factors is simplified
and least granular concept in the clinical decision to a single risk-management stratum, e.g. high
process, and therefore the easiest to represent. If we risk, through the clinical decision process. This
stratum usually an easily definable collection of
allow a clinician to jump right to a risk-management stratum usually an easily definable collection of
management follow-up options.
stratum, we can quickly display follow-up choices.
By focusing on the risk-management strata, we avoid attempts to replicate the complex risk assessment process. Instead, we provide some basic risk factors but let the clinician perform the majority of the risk-management process by presenting few risk-risk-management strata. From there we do not suggest which management is appropriate. Instead we simply present all management options related to that stratum
and leave the management decisions to the clinician. For these reasons, we built our tracker model around this clinical concept of risk-management stratification.
2.8.2 Timing of Intervention
We believe the optimal moment for guideline intervention is not during risk assessment, rather during results review. To properly interpret the results, the clinician is required to recall the patient history and clinical details and is thus primed to plan for the follow-up. If follow-up is needed, it is decided at this point, often when the patient is not present. Therefore, this asynchronous process is more prone to errors of lost communications and is an opportunity for more successful intervention. We believe that providing guidelines and reminders at results review eliminates the low-yield task of duplicating the clinical decision process and focuses on the high-yield results of process-oriented clinical data tracking. Thus our primary goal of patient tracking is to asynchronously facilitate the follow-up of disease processes.
2.8.3 Scope and Scale
For the greatest clinical impact, we aim to develop a system that can track any disease process, ranging in context from annual screening for diabetes to the specific follow-up of an abnormal Pap smear. From a public health perspective, we aim to be able to track allpatients for all disease processes using all available clinical data. Our system is specifically designed on this massive scale.
Most reminder systems were designed to work synchronously during a clinical encounter, therefore were often built to collect and process data on a single patient at a time. This data process is often performed during the visit by accessing multiple data sources and running logical rules one by one for specific disease processes. Alternatively, this individual patient query is performed when a new clinical result is received electronically. This design works well for small a small number of patients (100's - 1000's) and a small number of simple guidelines. However to track patients not during a visit would require searching all data resources for all patients every day or by setting hundreds of these triggers for any result related to a disease process. Existing reminder system models simply can not support the volume of clinical data and processing power required to track a large volume of patients asynchronously between visits.
We propose a tracking system designed not for the individual patient, but instead for the entire patient population. Rather than gathering clinical data as needed, we choose to maintain all available clinical data, and process all disease trackers for all patients using all clinical data in large batch processes offline, and simply record the results of these processes. The advantages of this approach allow us to provide:
1. support for a large scale
2. quality assurance on centrally located data 3. instantaneous access to pre-processed results
3 Design
Our goal is to identify patients who have not had follow-up, notify their clinicians, and then track the subsequent follow-up. To accomplish this task, our tracking system searches patient data using defined rules for each disease process. Our tracker guidelines provide the logic for these searching rules. These guidelines automatically search the clinical and administrative data to identify and track the patients without follow-up. When patients fall off track, the system generates reminders to the clinicians, who use the system for both chronic disease management and follow-up tracking. We describe designing the guideline model, identifying patients without follow-up, generating reminders, and lastly the technologies we used in the application architecture.
3.1 Guideline Model
Our guideline model (Figure 6) contains multiple top-level trackers for each disease process we want to track ("Cervical Cancer"). Within each tracker are one or more risk-management strata that represent the culmination of the risk assessment process ("routine screening"). Each risk-management stratum contains a single risk set and an accompanying single management set; our goal is to ensure that the patients in the risk set have had follow-up and therefore are also in the management set. The risk set and management set contain one or more groups, each composed of one or more clinical elements, e.g. "male > 40 years old," "diabetes and LDL > 100mg/dl", and optional or-groups with one or more nested clinical elements.
<trackers> <managementset> <trackers> <managementgroupl> <riskmanagementstratuml> <clinicalelement/> <riskset> and <riskgroupl> <orgroupn> <clinicalelementl/ > <clinicalelement./ > and </orgroupn> <clinicalelementn/ > </managementgroupl> and or <orgroupl> <managementgroupn> < clinicalelement 2/> ... or </managementgroupn> <clinicalelementn/ > </managementset> </orgroupl> </riskmanagementstratuml> and or <orgroupn> <riskmanagementstratumn> </orgroup.> </riskmanagementstratumn> </riskgroupl> </trackerl> or or <riskgroup,> <tracker,> </riskgroup,,> </tracker,,> </riskset> </trackers>
Figure 6. Tracker Guideline Model in XML
Each tracker contains risk-management strata, risk/management groups, or-groups and clinical elements
The smallest units in our model are the clinical elements. These elements describe patient clinical data including demographics, diagnoses, procedures, clinical encounters, clinical providers, medications and laboratory tests. A patient's health history is a collection of these clinical elements. Demographic data
are continuous (age) and categorical (race, gender). Diagnoses, procedures, medications, clinical encounters and clinical providers are categorical. Laboratory tests may be either categorical or continuous depending on the test result type. All clinical elements have a unique full name and an abbreviated name. Constraints for each clinical element may include dates ("in the past 1 year") and value limits and their logical operators ("> 100mg/dl"). For example, to identify the set of all patients who had a low density lipoprotein (LDL) level greater than 100mg/dl in the last year, the clinical element would look as follows, represented in XML:
<clinicalelement name="LDL" fullname="Lab\Chemistry\LDL"
operator="greaterThan" lowerValue="100" units="mg/dl" dateLowerLimitNum="1" dateLowerLimitUnit="year"/>
These clinical elements are used as both risk factors and management choices. The results of today's management choices become the potential risk factors for tomorrow's risk assessment. For example, if a person has an LDL > 1 00mg/dl (today's risk factor) then an LDL should be repeated in the next year (tomorrow's management choice). The results of this repeated LDL test will then serve as the risk factor for its subsequent follow-up, and so on.
3.2 Clinical Element Dictionary
The clinical elements are the language we use to understand the patient health records. To successfully search these records, this language must contain a standardized vocabulary of terms, or a lexicon. Numerous medical lexicons have been created to define health records. In an effort too combine all available medical lexicons, the National Library of Medicine created the Unified Medical Language System (UMLS). As a result, this dictionary of dictionaries, called a metathesaurus, contains information about over 5 million biomedical terms from more than 100 lexicons used for patient records.
Importantly, the UMLS contains vocabularies and coding systems designated as US standards for the exchange of administrative and clinical data.
For our clinical element dictionary, we chose a lexicon built from UMLS but with additional terms defining local data that are not contained in the UMLS. Our patient data are contained in the Research Patient Data Registry (RPDR).[31] This data warehouse contains patient data from multiple hospital
systems within the Partners Healthcare System in Boston, Massachusetts. The RPDR metathesaurus contains 63,000 terms with corresponding UMLS codes, including demographics (age, gender, race), diagnoses (Internal Classification of Diseases, Ninth Revision), laboratory results (Logical Observation Identifiers Names and Codes (LOINC) and local terminology), medications (National Drug Code), procedures (Current Procedural Terminology), and clinical encounters and providers (local terminology). The structure of the RPDR metathesaurus is hierarchical (Figure 7). Broadly defined terms are grouped into categories that contain more specific categories; these categories, in turn, contain even more specific categories, and so on. At the bottom of this hierarchical structure are the individual clinical elements. Each of those groups contains even more specific categories.
The advantages of using the RPDR metathesaurus are that 1) it is derived from the UMLS which allows us to integrate our system with other UMLS-based systems, and 2) its hierarchical structure allows for simplified clinical element terms. To give an example of how using a hierarchical metathesaurus can help simplify guideline terminology, defining the laboratory test "cholesterol" can be simplified to a single term that represents all related cholesterol lab names. The RPDR metathesaurus maps all local lab names and codes from different systems, in different hospitals, from different points in time, all to UMLS terms. The LOINC code for "cholesterol" contained in
the UMLS is 2093-3. However, there are 23
different local definitions for this single concept within the Partners Healthcare System, because many systems are older legacy systems and do not take advantage of standard concept coding. To fix this problem, the RPDR metathesaurus represents all of these terms in a single
"Labs\Chemistry\Cholesterol" group. If a '~ r, l:ng.trhr h-at rc a E,nPn'.l0lr hlr-. j lr ,, I]rlto c ~ i If ¢hc!Itl-t'r C,,ttor l aii .. ,r-l t) RhP rnal to Se
Jl Medlttorls ~ i Arterlalst~ ¢ul( disease
jI F¢'tL'dure , j erehrl:luascilar di-sease
tj F';'defs j 'C tl.il RheuatJ: hearl disease I ,i eae of 3illies j Ll'.tse of pulnlFrlra, ilrcJlatlrln
J H,'pere'sr.e dispse
E 5.r ential hip -ter rsion i[stlIlg es-er,l 31 'l~[erlre'15lp
· ' 4llilallte en l:] i l~lerte l orl 'ipi ,
I Irllr v i "flp .Pr! lal hvpe!pnl,r l
j H'riltPl-lr ' h.'Art arid le rl dliCPasr
H',perILensil h dt dl,,e'-e
iJ Hi-c' ielteisi,e renal lisea, P
'J jel: ondar;. h',pertr l o
i Ischetur hearlt dlease
i thei frms he iiof rii di -eF
i 'earl-lJs anl' tlimilphatlf disease '1 -'rcl-l'nu!tiis Ir the ieri atall peiu od
Figure 7. RPDR Metathesaurus Hierarchy
Each category contains either subcategories or individual elements with increasing specificity. In this example, the circulatory diagnoses category contains the subcategories of rheumatic fever, vascular disease, cerebrovascular disease, hypertensive disease, etc.
guideline requires the lab term "cholesterol," the author may include all 23 terms in the guideline within an or-group, or simply include the one RPDR term "Labs\Chemistry\Cholesterol," thus simplifying the data representation. If the guideline wanted to refer to any chemistry lab, it would simply be represented as "Lab\Chemistry" rather than all of its 3,174 individual chemistry terms.
3.3 Patient Data
Once we define our guidelines with clinical elements, they guide the search through patient data. Our system uses patient data from multiple data warehouses. These clinical repositories contain diagnoses, medications, laboratory test results, procedures, visit information and clinical providers. Information missing in one repository is complimented by data from another. Primarily we use the RPDR data which
are stored in a Microsoft SQL 2000 database running on a Windows 2000 server. This data warehouse contains over 450 million clinical elements for 1.8 million patients seen at either Massachusetts General Hospital (MGH) or Brigham & Women's Hospital (BWH) from as far back as 1987. Additional information is extracted from the Partners Clinical Data Repository (CDR).
3.4 Identifying Patient Sets
After we search the patient data using our guidelines, we generate summary scores for all guidelines for all patients. An example question the tracker aims to answer would be, "Have all women with a Pap smear result had timely acknowledgement of the report and follow-up, if abnormal?" The tracker would be "cervical cancer" and the risk-management stratum would be "routine screening." The risk set would contains all women with a Pap smear report, and the management set would be either a repeat Pap smear after some time interval or another gynecologic procedure or office visit.
MRN tracker maximum risk set 000004 annual (gender="male" check-up ^ age>30) 152342 annual (gender="female" check-up ^ age>40) maximum maximum
risk score management set
0.5 (procedure=
(1/2 match) "chest x-ray"
A
lab="chem7"
^ lab="CBC")
1.0 (procedure=
(all match) "chest x-ray"
A
lab="chem7"
maximum management score 0.33 (1/3 completed) 1.0 (all completed) ^ lab="CBC")000004 heart (lab="LDL> 100") 1.0 (lab="LDL" 0.0
disease (all match) ^ medicine="statin") (none completed)
Table 1. Summary Patient Scores for All Risk-Management Strata
For example, for the risk set of ( (gender="male" ^ age>30) v (gender="female" ^ age>40) ), a 25 year-old man would receive 1 out of 2 points (0.5) for matching half of the risk group (gender="male" ^ age>30), but would
receive a score of 0 for not matching any of the risk group (gender="female" ^ age>40). Therefore, his risk set score would be his maximum score for those risk groups, 0.5. Alternatively a 65 year-old woman would receive a
risk set score of 1.0, for matching both (gender="female") and (age>40). Management scores are also recorded.
To identify these patients, we calculate scores, between 0 and 1, representing how close the patients match the clinical scenario (Table 1). For each tracker risk-management strata, all patients receive both a risk set score and management set score. These scores are the maximum risk group score and maximum management group score, respectively. Each group score is the fraction of clinical elements that match
for that patient. If two groups tie for the maximum risk or management set score, both are recorded. After scores for all patients are calculated for all trackers and their risk-management strata, they are recorded in a database.
3.5 Reminder grouping
With these scores, we track patients as they move through the clinical care process and send reminders to clinicians when patients fall off track. To avoid sending a high volume of reminders to clinicians and thus
overwhelming them, we built intelligent grouping into the guideline model. These reminder groupings allow us to send results in batches rather than separately. Each management clinical element can have a separate alert type of either none, routine, or priority. These alerts are defined by the minimum time to wait before reporting grouped results to the clinician and the maximum time to wait before reporting missing results (Table 2).
result min wait time
alerting before reporting
type results
none
priority 0 (deliver each
immediately as they arrive) routine tmn, (deliver together but abnormal immediately)
max wait time before reporting missing results .
tmax-p
tmax-r
Table 2. Grouping Types and Timing
For example, if a clinician chooses to follow-up a patient
by ordering management consisting of (labl ^ lab2^procedurel ^procedure2), a clinician may choose
routine delivery for the labs (tm r = 3 days, tmaxf = 7 days), andprioriy delivery for the procedures (tma- p
= 1 month). If lab, results arrive to the electronic health record in 1 day, it will not be sent to the
clinician until waiting a total of 3 days (tn r) for lab2results to arrive. After 3 days, labl and lab2results, if
available, will be sent together. If for some reason a lab result is not received, a delinquent alert will be sent to the clinician after the tma,,, of 7 days is reached. For the priority procedures, since the minimum wait time is 0, as soon as the result is received, it will be sent to the clinician. The tmax p is set higher, to 1 month, because procedures usually take longer to schedule, perform, interpret and report. Alternatively,
i i i i
if a clinician chooses to check results manually and does not want to be alerted by the system, an alert type of none is chosen.
To define these reminder groupings, the following attributes are added to the management clinical elements: alertType {"none", "routine", "priority"}, alertMinNum {number}, alertMinUnit {"day", "week", "month", "year"}, alertMaxNum {number}, alertMaxUnit {"day", "week", "month", "year"}. The above example is represented in XML:
<managementgroup>
<clinicalelement name="labl" alertType="routine" alertMinNum="3" alertMinUnit="day"
alertMaxNum="7" alertMaxUnit="day"/> <clinicalelement name="lab2" alertType ="routine"
alertMinNum="3" alertMinUnit="day" alertMaxNum="7" alertMaxUnit="day"/>
<clinicalelement name="procedurei" alertType= "priority" alertMinNum="O" alertMinUnit="day"
alertMaxNum "1" alertMaxUnit="month"/>
<clinicalelement name="procedure2" alertType="priority" alertMinNum="O" alertMinUnit="day" alertMaxNum="1" alertMaxUnit="month"/> </managementgroup>
3.6 Application Architecture
9 i i i Ij i i i i i z I i i iFigure 8. Three Tier Application Architecture
As information travels through the application infrastructure, it is processed using different programming languages, converted to other data formats, and transmitted to the next tier.
Creating guidelines, searching and scoring patient data, and generating reminders are all controlled by computer programs within our application architecture. We use a number of technologies and computing languages across three tiers: database, business logic, and presentation (Figure 8).
The database tier consists of both the data storage and the technologies to access these data. We use the structured query language (SQL) to retrieve data from the Microsoft SQL Server relational databases. For data sources that do not allow direct SQL queries, such as the CDR, we use other services to collect those data and store a copy in a local database that we can then query with SQL.
The business logic tier contains the functional programs that communicate between the data and the user interface. Our applications run on Internet servers using Microsoft Active Server Pages (ASP) written in JavaScript. These applications are divided into data services, programs that query and gather information from the database tier, and presentation services, programs that format these data for the user interface. Data is passed between the database and presentation tiers through the business logic tier in the
eXtensible Markup Language (XML) standard. These XML data are transformed to the format required by the destination tier using eXtensible Stylesheet Language Transformations (XSLT).
The presentation tier is the display that allows the user to interact with the data. One presentation technology we use is a web browser, displaying data with the Dynamic Hypertext Markup Language (DHTML). Additional presentation logic is programmed within the browser using JavaScript, providing a direct connection to the business logic. This technology enables us to update the webpage dynamically without the need to reload the page.
Another presentation technology we use is Macromedia Flash, a multimedia authoring environment that is presented in the Flash Player, a virtual machine application that runs within a web browser. Flash applications are written in ActiveScript 2.0, an object-oriented language.
4 Implementation
Our tracking system addresses each challenge of the process of follow-up care (Figure 9). The tracking process begins with medical experts defining the guidelines. These guidelines are then used to
automatically search patient medical records and identify patients without follow-up. Messages are sent to clinicians who can then view these patients and choose the appropriate follow-up management. If the
management occurs on time, those results become part of the patient's medical record, and the next time
the patient record is searched, that patient will now have documented follow-up. However, if the management has not occurred, automated reminders are sent to the clinician. This process of searching for patients without follow-up, tracking subsequent follow-up and generating reminders occurs
automatically every day as new results are received and new managements are chosen.
search all patient clinical clcmcnts using the
Tracker Query Tool
guidelines using the
Tracker Authoring To f....~ k .w... patients complcte follow-up ...- . . : ... .- -I- - .1 . , -..- - .. .. 0.;,R1. ... kiS tralcker guidlclities il [1 .· identify patient sets and calculate
c,,1 ...-... ,
tracker scrvic reminder mce to clinicians
_ clinicians clloose ollow-up
Ces send
ssagcs
IT1llmanagement Using tnil
Tracker Clinical Tool
Figure 9. Process of Follow-up Care in the Tracker System
The tracker system encompasses all aspects of the follow-up care process. Medical experts create tracker guidelines using the Tracker Authoring Tool. The Tracker Query Tool automatically searches all patient
medical records daily, identifies patients without follow-up and records their status for all trackers in the
watchlist. Other services access the watchlist and generate messages to clinicians, such as a new result requires follow-up, or a patient requires annual cancer screening. Third party applications present these messages to clinicians. Clinicians then choose a management option using the Tracker Clinical Tool. Once management is planned, the entire process begins again, and all patients are tracked until all issues requiring follow-up have been resolved.
medical experts define
tLJ ,,' ~L ~ 11 a i,. I,·~· I·- ;,·., , , - 1"' .." =Ira~~~~~
Most of our program interfaces are designed for a rich, web-based environment. Utilizing the Internet allows clinicians to access our tools using a standard Internet browser and removes the need to distribute and maintain client-side software. However with the advantages of a web-based environment come the limitations of a less interactive, sluggish experience using a web-browser. Therefore, to create a smooth, rich experience we employ several web-based techniques including client-side H'ITP, hierarchical navigation and drag-n-drop. These technologies make the user interaction more comparable to standard window-based applications.
Client-side HTTP technology utilizes JavaScript objects to directly connect to server-side data and subsequently modify the browser interface with Dynamic HTML. Therefore, the user does not have to submit the webpage to update the data; the result is a smooth interactive experience with minimal observed delay and preservation of the interface and data state. This client-side technology is especially useful for loading large amounts of data in small batches as needed, providing a quick initial load and allowing for hierarchical navigation.
Our interface mirrors the underlying data structure. Tracker guidelines and the RPDR metathesaurus are both structured hierarchically. This organization is intuitive to users and mimics how data is organized in disease-related groups with increasing clinical detail in subgroups. At the top level, the user sees only the most basic groups, but as needed, may expand each group to see nested subgroups and other disease-related items. For example, although the RPDR metathesaurus contains 63,000 terms, initially only the top 7 categories are displayed: Demographics, Diagnoses, Encounters, Labs, Medications, Procedures, and Providers. Expanding the Diagnoses group reveals the main categories of diagnoses. This hierarchical structure prevents the user from information overload and results in a clean graphical user interface.
cal experts fine the r guidelines
-ffi¢
4.1 Tracker Authoring Tool
To begin the tracking process, clinical experts define the tracking guidelines. The Tracker Authoring Tool is a web-based application that enables clinical experts to build tracker guidelines from clinical elements (Figure 10). The user interface displays the tracker navigator on the far left (a), the risk-management composer in the main portion of the screen (b), and system messages and tips in the bottom left (c).
The tracker navigator hierarchy (a) is retrieved using the Tracker Definition Service (TDS), one of many data services that queries the Tracker guideline database in SQL, then transforms the resulting tracker XMI, guidelines dynamically into HTML for display. The tracker navigator mirrors the structure of the underlying guideline model, such that authors can view trackers, risk-management strata, and clinical elements hierarchically. Using the tracker navigator, the author can create, view and edit trackers and risk-management strata.
IJ - - 4 I E jd E dt w * new tracker · Breast Cancer * Cervical Cancer * Colorectal Canc * Diabetes o Hypercholestert * new risktnn O low risk O ri* group 0 r1i:lator * r , * rut .' * rlrd'~tol mng group I medium risk * Hvyertension · Iejr ohath y :e _ ; ,1. ,,,i ,. . ler na lter firoyp il 1f'~' , 1 ,, group , X~ id ''', 'Iqa-group ',,-y
~ ~ ~ ~
$ ;1l D ' -I ': ' ~ i 'I , Off as'-~ ! '~.
, -,. '~ - ,'!' ),' , . d u ·' ' groin ..e j ;-1 ·if i E , 1191' _ I _ '4 j j , ,s, -1, ' |1 .6, 1a!F 4] F. i ,,t S lI i i, is ,, , ! i -j .Figure 10. Tracker Authoring Tool
The tracker navigator (a) displays the current tracker hierarchy with embedded action links to author new trackers. The risk-management composer (b) graphically represents the risk-management stratum which includes the risk set (d) and the management set (e), each with several groups (f, g) consisting of clinical elements (h). The composer center space contains the RPDR metathesaurus (i) and searching tool (j). Confirmation messages and tips are shown in the system message window (c).
Once the author selects a management stratum, the remainder of the authoring occurs in the risk-management composer (b). Since the risk set (d) and risk-management set (e) in the tracker model have the same data structure, graphically they appear similarly, side by side. The author selects either the risk or management set by clicking the appropriate tab at the top of the composer; the corresponding set is displayed in the center of the screen (d), and the other set is displayed to the right (e). The author can view both sets of groups simultaneously, for they are intimately related in terms of clinical logic, i.e. R
M.
The author creates a new risk group by clicking "new" in the composer tool bar (j). The author then finds the relevant clinical elements either by manually navigating the metathesaurus hierarchy (i) or by searching for terms explicitly using the search tool (j). The RPDR metathesaurus display data are
managed by RPDR Metathesaurus Service. To add the clinical element to the group, the author drags the element from the metathesaurus and drops it in the appropriate group. The author can select individual items (i icon) or an entire RPDR category (1 icon) as a clinical element.
The author then defines the attributes of each clinical element. If the author is editing a risk group, risk-oriented attributes are displayed (Figure 11). All RPDR data types have an inclusion date interval, which narrows the dates that the guideline searches for patients with a clinical element. Laboratory risk factors have additional value attributes ("> 100") and normal/abnormal ranges. A mouse-over these areas in
this window explains the attribute. In addition, the author may indicate that this clinical element should be the lack of evidence, by clicking the NOT logically box.
- n rrana =- -[S =- --b amn.lr-rRnnlllllomaF - --- - @~~~ | i i i i .- ._ . I.
%V~
Define LDL (mgfdl)
11, i i r I .
Figure 11. Risk clinical element definition.
For continuous laboratory terms, the RPDR metathesaurus provides ranges of normal and abnormal values as defined by different laboratories with the Partners Healthcare system, as indicated by the gradient color bar. The red area indicates that results in this range are considered abnormal; orange indicates that some laboratories consider these values abnormal; and, green indicates that values in this range are universally considered normal. This clinical element would identify patients with an LDL value greater than 100mg/dl in the past 1 year.
Alternatively, management clinical elements contain alert grouping parameters (Figure 12). For example, the date interval here is the time from when the patient initially became at-risk up to the time at which this management should have occurred. The alert grouping displays the default values for that RPDR clinical element.
Figure 12. Defi
This management d months from when ' routine," and resul If no results have be
Alerts: uNew and eltu Peu fl l !
" r0tt, 1.- .'"f 7
n ome'Iil: -le t
lne management clinical element.
efinition identifies patients who have not had an LDL result within 3 they became at-risk ("LDL > 100mg/dl"). The alerting is set to ts will be held up to 1 week until other grouped results are received. een received after 1 month, the system sends a delinquent alert.
,itie LDL mufdl)